Journal Description
International Journal of Plant Biology
International Journal of Plant Biology
is an international, peer-reviewed, open access journal on all different subdisciplines of plant biology, published quarterly online by MDPI (from Volume 13, Issue 1 - 2022).
- Open Access— free for readers, with article processing charges (APC) paid by authors or their institutions.
- High Visibility: indexed within Scopus, Biological Abstracts and BIOSIS Previews (Web of Science), and other databases.
- Rapid Publication: manuscripts are peer-reviewed and a first decision is provided to authors approximately 19.7 days after submission; acceptance to publication is undertaken in 3.9 days (median values for papers published in this journal in the second half of 2024).
- Recognition of Reviewers: APC discount vouchers, optional signed peer review, and reviewer names published annually in the journal.
Latest Articles
Testing the Antioxidant Activity of Different Leaf Extracts and the Phenolic Content of Young Moringa oleifera Lam. Plants Grown in a Temperate Climate Zone
Int. J. Plant Biol. 2025, 16(1), 11; https://doi.org/10.3390/ijpb16010011 - 10 Jan 2025
Abstract
Moringa (Moringa oleifera Lam.) is a tree that grows in tropical and subtropical regions. In this study, the plants were grown in a temperate climate zone from seeds collected at the Island of St. Lucia. Cultivation was carried out in the field
[...] Read more.
Moringa (Moringa oleifera Lam.) is a tree that grows in tropical and subtropical regions. In this study, the plants were grown in a temperate climate zone from seeds collected at the Island of St. Lucia. Cultivation was carried out in the field and in a greenhouse in Prešov, East Slovakia. Leaf samples were taken from young plants and dried naturally. In the ethanol and hot water extracts of the leaves, the dry matter, total phenolic substances, and antioxidant activity were determined using three methods: superoxide anion radical scavenging activity, hydroxyl radical scavenging activity, and ferric reducing ability of plasma (FRAP) assay. The highest amount of total phenols was detected in the ethanolic extract of the leaves from the field 911.14 mg GAE L−1, resp. 69.70 mg GAE g−1 DM. The lowest amount was noticed in the leaves from the greenhouse 408.88 mg GAE L−1, resp. 13.07 mg GAE g−1 DM. The amount was significantly lower in the aqueous extracts. A high antioxidant activity of the leaves from the field was detected in all ethanolic and hot water extracts. Both types of leaf extracts from the greenhouse showed statistically significant lower antioxidant activity. The obtained results indicate that outdoor cultivation in a temperate climate zone was stressful for the plants, leading to an increased formation of phenolic substances, and consequently to higher antioxidant activity.
Full article
(This article belongs to the Section Plant Physiology)
Open AccessArticle
Genome De Novo (WGS) Sequence Resource of the Lasiodiplodia theobromae Bot-2018-LT45 Isolate Causing Dieback in Apple
by
Adrián V. Valdez-Tenezaca, Sergio A. Hernández Covarrubias, Alexis G. Murillo Carrasco, Matías I. Guerra Peñalosa, Jean F. Castro Figueroa, M. Ernesto Delgado Fernández, José A. Corona-Gómez and Gonzalo A. Díaz Ulloa
Int. J. Plant Biol. 2025, 16(1), 10; https://doi.org/10.3390/ijpb16010010 - 9 Jan 2025
Abstract
Lasiodiplodia theobromae is a pathogenic fungus associated with tropical perennial fruit plants worldwide. In apple trees, L. theobromae causes dieback and canker, a disease that affects the architecture of the wood producing the progressive death of branches and stems, from the tips to
[...] Read more.
Lasiodiplodia theobromae is a pathogenic fungus associated with tropical perennial fruit plants worldwide. In apple trees, L. theobromae causes dieback and canker, a disease that affects the architecture of the wood producing the progressive death of branches and stems, from the tips to the base, invading the vascular tissue, manifesting necrotic lesions in the bark, impeding the flow of nutrients and water. The present work reports the whole genome de novo sequencing (WGS) of L. theobromae strain Bot-2018-LT45 isolated from apple trees with dieback symptoms. Genomic DNA of L. theobromae was sequenced using Illumina paired-end short-read technology (NovaSeq6000) and PacBio SMRTbellTM (Single Molecule, Real-Time) long-read technology. The genome size was 44.17 Mb. Then, assembly and annotation revealed a total of 12,948 genes of which 11,634 encoded proteins. The genome was assembled into 34 contigs with an N50 (Mb) value of 3.23. This study is the first report of the L. theobromae genome de novo obtained from apple trees with dieback and canker symptoms in the Maule Region, Chile. This genetic information may set the basis for future study of the mechanisms of L. theobromae and establish the possibility of specific molecular improvements for the control of dieback and canker.
Full article
(This article belongs to the Section Plant Biochemistry and Genetics)
►▼
Show Figures
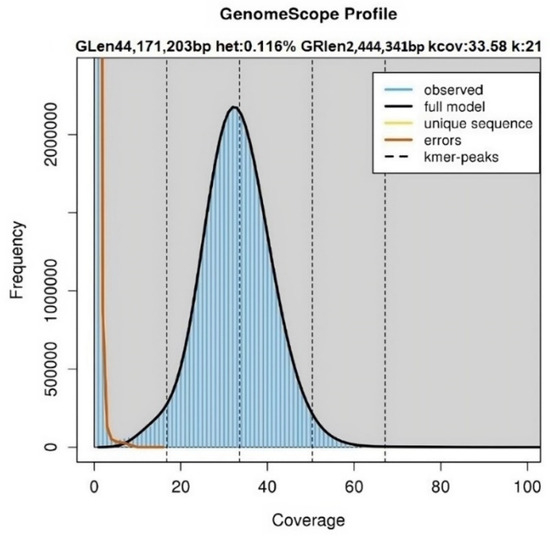
Figure 1
Figure 1
<p>Genome size and heterozygosity estimation by k-mer analysis. k-mer analysis (k = 21) for <span class="html-italic">L. theobromae</span> Bot-2018-LT45 revealed that the k-mer distributions followed a Poisson distribution with low heterozygosity (<0.5%) and the estimated genome size is 44.17 Mb. The pronounced peak on the left indicates random sequencing errors, whereas the peak on the right corresponds to high-quality and accurate sequencing data. Frequency: number of times a given k-mer (a nucleotide sequence of length “k”) appears in the dataset. Coverage: average number of times a specific k-mer is observed in the analyzed DNA sequences. k-mer coverage: mean k-mer coverage for heterozygous bases. Heterozygosity: overall rate of heterozygosity. Genome length: inferred genome length. Genome repeat length: length of the genome that is repetitive.</p> Full article ">Figure 2
<p>BUSCO result plot. The completeness of the <span class="html-italic">L. theobromae</span> Bot-2018-LT45 genome assembly assessed with BUSCO v5.1.2 at the <span class="html-italic">Eukaryota</span> level revealed that the strain contains 98.43% complete orthologs at the <span class="html-italic">Eukaryota</span> level (<span class="html-italic">n</span> = 255).</p> Full article ">Figure 3
<p>Genome overview of <span class="html-italic">L. theobromae</span> Bot-2018-LT45 strain. The genome size of the Bot-2018-LT45 strain is 44.17 Mb. Tracks indicate (inward) (a) scaffolds, (b) gene density, 293 genes per Mb, and (c) GC content. These density metrics were calculated with 100 kb sliding windows.</p> Full article ">Figure 4
<p>Evolutionary relationships among <span class="html-italic">L. theobromae</span> isolates AM2As (cocoa), CSS-01S (grapevine), and Bot-2018-LT45 (apple). (<b>A</b>) Distribution of gene number per orthologous group among the <span class="html-italic">L. theobromae</span> strains tested. The violin plot illustrates the distribution of gene counts associated with each orthologous group in strains AM2As, CSS-01S, and Bot-2018-LT45. Each violin represents the density of the data for a given strain. (<b>B</b>) Phylogenetic tree illustrating evolutionary relationships based on comparative genomic analysis. (<b>C</b>) Venn diagram of predicted gene families in Bot-2018-LT45, AM2As, and CSS-1S. Values explain the joining counts of orthologous gene families shared among the different <span class="html-italic">L. theobromae</span> strains.</p> Full article ">Figure 5
<p>Functional annotation of <span class="html-italic">L. theobromae</span> Bot-2018-LT45 genes was performed using the databases Swiss-Prot Proteins (7819 genes), Pfam (7877 genes), Cdd (3335 genes), Gene Ontology (5909 genes), Tigrfam (707 genes), and Eggnog (11,073 genes).</p> Full article ">
Open AccessReview
Plant-Growth-Promoting Microorganisms: Their Impact on Crop Quality and Yield, with a Focus on Rice
by
Winston Franz Ríos-Ruiz, Henry Giovani Jave-Concepción, Edson Esmith Torres-Chávez, Franz Rios-Reategui, Euler Padilla-Santa-Cruz and Nelson Elias Guevara-Pinedo
Int. J. Plant Biol. 2025, 16(1), 9; https://doi.org/10.3390/ijpb16010009 - 9 Jan 2025
Abstract
This article presents a systematic review of the ecophysiological mechanisms underpinning the essential role of plant-growth-promoting microorganisms (PGPMs) in improving rice yield and quality. The scientific literature is thoroughly reviewed, highlighting how PGPMs positively influence the growth, development, and health of rice plants.
[...] Read more.
This article presents a systematic review of the ecophysiological mechanisms underpinning the essential role of plant-growth-promoting microorganisms (PGPMs) in improving rice yield and quality. The scientific literature is thoroughly reviewed, highlighting how PGPMs positively influence the growth, development, and health of rice plants. Key aspects, such as nitrogen fixation, nutrient solubilization, hormone production, and disease resistance induction, are emphasized. Additionally, technological advancements related to PGPM use are analyzed, including the identification of effective strains, the formulation of enhanced biofertilizers, and genetic engineering. The article concludes that PGPMs represent a promising tool with which to boost the sustainability and productivity of rice cultivation, providing a robust foundation for future research and practical applications in a field crucial to global food security.
Full article
(This article belongs to the Section Plant–Microorganisms Interactions)
►▼
Show Figures
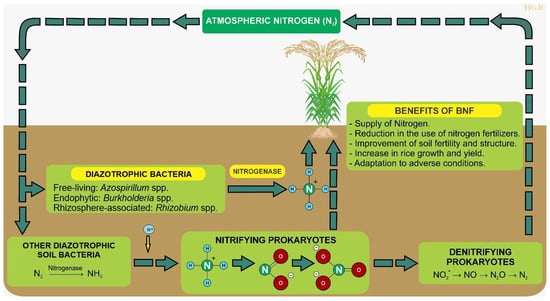
Figure 1
Figure 1
<p>Biological nitrogen fixation (BNF) in rice cultivation. The diagram illustrates the mechanisms of BNF in rice cultivation, highlighting the role of diazotrophic bacteria. These bacteria can live freely, associate with the rhizosphere, or be endophytic. The nitrogen fixation process is depicted, showing how the enzyme nitrogenase catalyzes the conversion of atmospheric nitrogen (N<sub>2</sub>) into ammonium (NH<sub>4</sub><sup>+</sup>), which is then absorbed by the rice plant. The diagram also emphasizes the role of nitrogen-fixing bacteria in enriching the soil fertility, reducing the need for chemical fertilizers and enhancing plant growth through the production of phytohormones.</p> Full article ">Figure 2
<p>Phosphate solubilization in rice cultivation. The diagram illustrates how bacteria and fungi produce organic acids, phosphatase enzymes, and siderophores to solubilize phosphates, releasing soluble phosphate ions that plants can absorb. The diagram highlights the benefits of increased phosphorus availability, improved plant growth, reduced use of chemical fertilizers, and enhanced resistance to abiotic stress. PGPM = plant-growth-promoting microorganism.</p> Full article ">
Open AccessArticle
Monochromatic Light Interactions in the Early Hypocotyl Elongation of Sunflower (Helianthus annuus L.) Seedlings
by
Dragan Vinterhalter, Vaclav Motyka and Branka Vinterhalter
Int. J. Plant Biol. 2025, 16(1), 8; https://doi.org/10.3390/ijpb16010008 - 7 Jan 2025
Abstract
Sunflower is a crop species well adapted for cultivation in open fields under full sunlight. Young plantlets can be grown in growth chambers under low irradiance, where different aspects of light can be easily tracked. Using time-lapse imaging, we have shown how monochromatic
[...] Read more.
Sunflower is a crop species well adapted for cultivation in open fields under full sunlight. Young plantlets can be grown in growth chambers under low irradiance, where different aspects of light can be easily tracked. Using time-lapse imaging, we have shown how monochromatic red, blue, and far-red light and their combinations interacted, affecting the rhythmicity and elongation of sunflower hypocotyls. Monochromatic light of any color, applied individually, canceled all manifestations of diurnal rhythmicity and anticipation of imminent light transitions present in diurnal photoperiods established by white LED light panels. Monochromatic light also significantly increased the rate of hypocotyl elongation, which became uniform (arrhythmic) and often triggered the appearance of guttation. The rate of hypocotyl elongation was highest with the blue light and lowest with red light. In double light combinations, red light suppressed the stimulative effect of blue light, but it promoted the elongation rate when used together with far-red light. A triple light combination of red, blue, and far-red light stimulated hypocotyl elongation to a high degree and increased the elongation rate more than twofold compared with red and fourfold compared with white LED light.
Full article
(This article belongs to the Section Plant Response to Stresses)
►▼
Show Figures
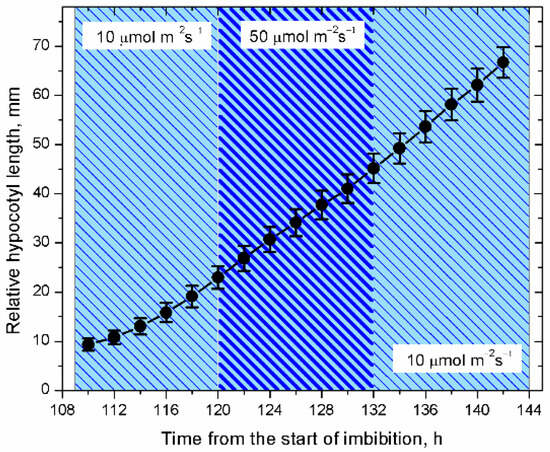
Figure 1
Figure 1
<p>Hypocotyl elongation of cv. Kondi plantlets grown in a white light 14/10 h light to darkness diurnal photoperiod and then placed under green monochromatic light (9.0 µmol m<sup>−2</sup> s<sup>−1</sup>). <span class="html-italic">n</span> = 16.</p> Full article ">Figure 2
<p>In blue and other monochromatic light treatments, hypocotyl elongation is saturated, showing little changes in the elongation rate if irradiance is increased or decreased. Cv. Kondi; irradiance levels 10 and 50 µmol m<sup>−2</sup> s<sup>−1</sup>; <span class="html-italic">n</span> = 16.</p> Full article ">Figure 3
<p>The hypocotyl elongation rate in 2.5 µmol m<sup>−2</sup> s<sup>−1</sup> of far-red light is significantly higher than in 70.0 µmol m<sup>−2</sup> s<sup>−1</sup> of white LED light, even if it is supplemented with white light. The light of white LEDs either prevents high hypocotyl elongation or requires more of the stimulatory far-red light or both. Cv. H7749; <span class="html-italic">n</span> = 21.</p> Full article ">Figure 4
<p>Genotype and monochromatic light treatments as factors affecting the relative rate of hypocotyl elongation mm/h. Average values ± SE of the mean; <span class="html-italic">n</span> = 15–20.</p> Full article ">Figure 5
<p>Hypocotyl elongation in seedlings of sunflower cvs. Sureli, Achilles, H7749, and P64LL155 grown under far-red light (2.5 µmol m<sup>−2</sup> s<sup>−1</sup>) for 24 h with a transfer to blue light (10.0 µmol m<sup>−2</sup> s<sup>−1</sup>). <span class="html-italic">n</span> = 20–24.</p> Full article ">Figure 6
<p>(<b>A</b>) Hypocotyl elongation rates (mm/h) in doublets and the triple light combination compared with elongation rates in treatments with individually provided light colors. Average rate of relative hypocotyl elongation ± SE of the mean. Treatments consisted of batches with 15–20 plants from 4–6 different cultivars and lines (Achilles, Sureli, P64LL166, H7749, Kondi, CX1CON, AN3IMI) providing <span class="html-italic">n</span> = 95–120 plants per light treatment. (<b>B</b>) One-way ANOVA average values labeled with the same letter are not significantly statistically different according to Duncan’s multiple range test at <span class="html-italic">p</span> ≤ 0.05.</p> Full article ">Figure 7
<p>Carry-over and decay of hypocotyl elongation in red light. Fast elongation, in blue light TT 120–128 h, continues initially in the blue + red doublets (carry-over) but later declines in TT 128–136 h. In the triple blue + red + far-red light combination, elongation is strongly promoted (TT 136–144 h), but it gradually declines in the following red light treatment (TT144–152 h). Cv. Sureli; <span class="html-italic">n</span> = 20.</p> Full article ">Figure 8
<p>Hypocotyl elongation in red + blue color doublets with components at different irradiance levels. Treatments include: 1. white LEDs; 2. red + blue; 3. dark; 4. strong red + blue; 5. red + strong blue; and 6. strong blue + far-red light. Light irradiance (µmol m<sup>−2</sup> s<sup>−1</sup>): red (10.0), strong red (20.0), blue (20.0), strong blue (40.0), and far-red light (7.0). Cv. P64LL155; <span class="html-italic">n</span> = 17.</p> Full article ">Figure 9
<p>Circumnutations (<b>A</b>,<b>B</b>) and guttation (<b>C</b>,<b>D</b>). (<b>A</b>) At TT 146 h, which was at the end of a 6 h treatment with a blue + far-red light doublet, the average hypocotyl length exceeded 60 mm. (<b>B</b>) Blue light was then replaced by red light, while far-red light was maintained. The replacement of blue light with red light was sufficient to trigger circumnutations, which became intense after 150 min. (<b>C</b>) Guttation in a batch of plants exposed to blue light for 8 h at TT 120 h became visible at TT 126 h and continued with the doublet application of blue + far-red light for the next 8 h, reaching the highest expression at TT 136 h (<b>D</b>), before it gradually declined in the triple combination of blue + far-red + red light. Treatments were set with AN3IMI plants.</p> Full article ">
Open AccessArticle
Characterization of the N6-Methyladenosine Gene Family in Peanuts and Its Role in Abiotic Stress
by
Wei Wang, Jianxin Bian, Xiaoyu Liu and Xiaoqin Liu
Int. J. Plant Biol. 2025, 16(1), 7; https://doi.org/10.3390/ijpb16010007 - 6 Jan 2025
Abstract
Members of the m6A gene family are involved in key biological processes such as plant growth, development, stress responses, and light signal transduction. However, the function of m6A genes in peanuts has been understudied. Our analysis identified 61 m
[...] Read more.
Members of the m6A gene family are involved in key biological processes such as plant growth, development, stress responses, and light signal transduction. However, the function of m6A genes in peanuts has been understudied. Our analysis identified 61 m6A family members in the peanut genome, including 21 writer genes, 22 eraser genes, and 18 reader genes, distributed across 20 chromosomes. Phylogenetic analysis revealed that ALKBH proteins are categorized into six subfamilies, while YTH family proteins form nine subfamilies. Promoter cis-element analysis indicated that m6A gene promoters contain light-responsive, hormone-responsive, growth-related, low-temperature defense, and other stress-related elements. Expression studies of AhALKBH8Ba and AhALKBH8Bb in various peanut tissues suggest that these genes play vital roles in peanut fruit needle development. Furthermore, AhETC1a and AhETC1b were significantly upregulated following the loss of mechanical pressure in peanut pods. This study identifies several key genes involved in light and mechanical stress response during peanut pod development.
Full article
(This article belongs to the Section Plant Biochemistry and Genetics)
►▼
Show Figures
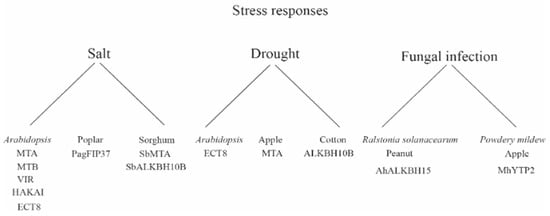
Figure 1
Figure 1
<p>Role of plant m<sup>6</sup>A gene in stress response.</p> Full article ">Figure 2
<p>Chromosomal distribution of the peanut m<sup>6</sup>A gene. Use the left ruler of the image to estimate the location of the m<sup>6</sup>A gene and the size of each chromosome; genes are shown at the right end of each chromosome.</p> Full article ">Figure 3
<p>Phylogenetic tree of the peanut m<sup>6</sup>A gene. The phylogenetic tree of m<sup>6</sup>A genes were constructed using maximum likelihood (ML). (<b>A</b>) Phylogenetic tree was constructed based on the protein sequences of 22 eraser genes; (<b>B</b>) phylogenetic tree was constructed based on the protein sequences of 19 reader genes.</p> Full article ">Figure 4
<p>Gene structure and conserved domains of the peanut m<sup>6</sup>A gene. (<b>A</b>) The distribution of ten conserved motifs in the m<sup>6</sup>A gene was analyzed by MEME. Different colors represent different patterns and positions; (<b>B</b>) analysis of the gene structure of the m<sup>6</sup>A gene. The yellow rectangle represents the exon, the light green rectangle represents the UTR, and the gray line connecting the two exons represents the intron.</p> Full article ">Figure 5
<p>Collinearity analysis of the peanut m<sup>6</sup>A gene. The red lines represent the presence of collinearity between genes.</p> Full article ">Figure 6
<p>Collinearity of the m<sup>6</sup>A gene among peanut, <span class="html-italic">Arabidopsis thaliana</span> and soybean. (<b>A</b>), Collinearity analysis of the writer gene. (<b>B</b>) Collinearity analysis of the eraser gene. (<b>C</b>) Collinearity analysis of the reader gene. The gray line represents the collinearity between all members, and the red line represents the collinearity between members of the m<sup>6</sup>A gene family.</p> Full article ">Figure 7
<p>Promoter element analysis of the peanut m<sup>6</sup>A gene. Different cis-regulatory elements in the promoter are denoted by square bars of different colors.</p> Full article ">Figure 8
<p>The heatmap presented the expression pattern of m<sup>6</sup>A genes in 15 tissues in peanut. The utilizing row-wise normalization with Z-scores based on previously published RNA-seq data. Main leaf, main stem leaf; Root, roots of 10 days postemergence; Flwr, petals, keel, and hypanthium sepals; AerPeg, elongating aerial pegs; Subpeg, elongating subterranean pegs; ExpPod, Pattee 1 pod; GynStlk, Pattee 1 stalk of gynophore; PodPt3, Pattee 3 pod; PerPt5, Pattee 5 pericarp; SdPt5, Pattee 5 seed; PerPt6, Pattee 6 pericarp; SdPt6, Pattee 6 seed; SdPt7, Pattee 7 seed; SdPt8, Pattee 8 seed; SdPt10, Pattee 10 seed [<a href="#B26-ijpb-16-00007" class="html-bibr">26</a>].</p> Full article ">Figure 9
<p>The qRT-PCR showing the expression levels of 9 m<sup>6</sup>A genes.</p> Full article ">Figure 10
<p>Expression of members of the peanut m<sup>6</sup>A gene under light and mechanical stress. The utilizing row-wise normalization with Z-scores based on previously published RNA-seq data. Peanut pods were immediately wrapped in air-permeable black paper bags to simulate the loss of mechanical stress alone, and D samples collected after 58 h of treatment (day 3) were designated D3. The pods were exposed to air for 58 h (day 3) to simulate darkness and loss of mechanical stress and were designated as sample L3. Two biological replicates were performed for each sample.</p> Full article ">Figure 11
<p>m<sup>6</sup>A protein–protein interaction network.</p> Full article ">
Open AccessArticle
Comprehensive In Silico Analysis of the NHX (Na+/H+ Antiporter) Gene in Rice (Oryza sativa L.)
by
Hoa Hai Thi Bui, Duong Huy Nguyen, Le Thu Thi Dinh, Hang Thu Thi Trinh, Thoa Kim Vu and Van Ngoc Bui
Int. J. Plant Biol. 2025, 16(1), 6; https://doi.org/10.3390/ijpb16010006 - 6 Jan 2025
Abstract
The Na+/H+ antiporter (NHX) gene family plays a pivotal role in plant salt tolerance in regulating intracellular Na+ and H+ homeostasis. In this study, seven candidate OsNHX genes (OsNHX1 to OsNHX7) were identified in
[...] Read more.
The Na+/H+ antiporter (NHX) gene family plays a pivotal role in plant salt tolerance in regulating intracellular Na+ and H+ homeostasis. In this study, seven candidate OsNHX genes (OsNHX1 to OsNHX7) were identified in the rice genome and classified into three phylogenetic clusters (Vac, Endo, and PM) based on their predicted subcellular localization. Five OsNHX gene pairs (OsNHX1/OsNHX2, OsNHX1/OsNHX3, OsNHX1/OsNHX4, OsNHX2/OsNHX6, and OsNHX5/OsNHX6) were found to have arisen from dispersed duplication events and exhibited purifying selection, indicating functional conservation. Analysis of cis-regulatory elements (CREs) revealed a diverse range of elements associated with tissue-specific expression, hormone signaling, and stress responses, particularly to dehydration and salinity. Notably, CREs associated with tissue/organelle-specific expression and stress responses were the most abundant, suggesting a potential role for OsNHX genes in regulating growth, development, and stress tolerance in rice. Importantly, expression profiling revealed that OsNHX1, OsNHX2, OsNHX3, and OsNHX5 were upregulated under salt stress, with significantly higher expression levels in the salt-tolerant rice cultivar Pokkali compared to the salt-sensitive cultivar IR64. Our findings provide a comprehensive analysis of the evolutionary, structural, and functional features of the OsNHX gene family and highlights their critical role in rice salt tolerance, offering insights into potential applications for crop improvement.
Full article
(This article belongs to the Topic Tolerance to Drought and Salt Stress in Plants, 2nd volume)
►▼
Show Figures
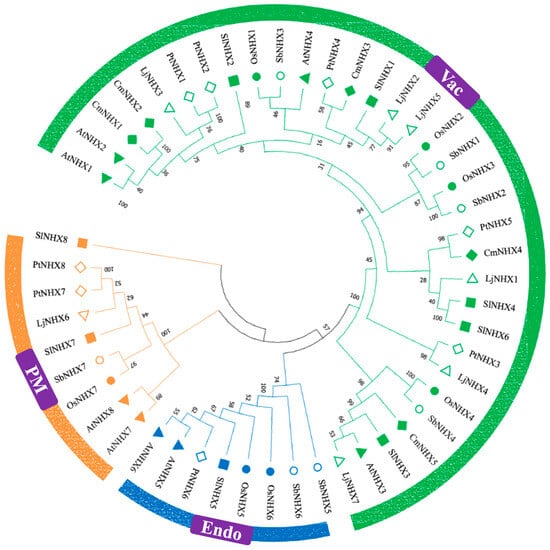
Figure 1
Figure 1
<p>Phylogenetic relationships among NHX proteins from <span class="html-italic">Oryza sativa</span> (Os), <span class="html-italic">Arabidopsis thaliana</span> (At), <span class="html-italic">Solanum lycopersicum</span> (Sl), <span class="html-italic">Cucurbita maxima</span> (Cm), <span class="html-italic">Lonicera japonica</span> (Lj), <span class="html-italic">Populus trichocarpa</span> (Pt), and <span class="html-italic">Sorghum bicolor</span> (Sb). The phylogenetic tree was constructed using the amino acid sequences of selected NHX proteins. MEGA 11 software was employed with the MUSCLE alignment algorithm, the neighbor-joining (NJ) method, and 1000 bootstrap repetitions. Proteins from these plants are represented by distinct color clusters and shapes.</p> Full article ">Figure 2
<p>Schematic representation of the chromosomal distribution and synteny blocks of seven <span class="html-italic">OsNHX</span> genes. The circles, arranged from outer to inner, depict the <span class="html-italic">OsNHX</span> gene sites, gene density (blue), GC skew (green), GC ratio, N ratio, and chromosomes containing collinear blocks. Colored lines connect the duplicated <span class="html-italic">OsNHX</span> gene pairs.</p> Full article ">Figure 3
<p>Analysis of <span class="html-italic">OsNHX</span> gene structure, protein motifs and domains. (<b>a</b>) Phylogenetic tree was constructed using the N-J method in MEGA11. (<b>b</b>) Exon/intron structures of the <span class="html-italic">OsNHX</span> genes were represented, with exons, introns, and UTRs depicted in yellow, black lines, and pale purple, respectively. (<b>c</b>) Motif distribution in OsNHX proteins was visualized by TB tool. (<b>d</b>) Conserved NHX protein domains. (<b>e</b>) Logo and amino acid composition of each motif were predicted by MEME tool.</p> Full article ">Figure 4
<p>Predicted tertiary structures of OsNHX proteins in rice, showing N and C termini and domains. 3D models of OsNHX transporters viewed from the side. Amiloride binding sites are shown schematically in red, while ND motifs are represented as pink spheres (these sites are illustrated with zoomed-in views as in the OsNHX1 protein).</p> Full article ">Figure 5
<p>Characterization of amiloride binding sites and conserved ND motifs of NHX proteins were visualized by the T-COFFEE tool. Multiple sequence alignment of NHX proteins from <span class="html-italic">Oryza sativa</span> (OsNHX1-7); <span class="html-italic">Arabidopsis thaliana</span> (AtNHX1, AtNHX6, AtNHX7 and AtNHX8); <span class="html-italic">Solanum lycopersicum</span> (SlNHX1); <span class="html-italic">Pyrococcus abyssi</span> (PaNhaP); <span class="html-italic">E.Coli</span> (EcNhaA); <span class="html-italic">Thermus thermophilus</span> (TtNapA), <span class="html-italic">and Homo sapiens</span> (SLC9A3_NHE3).</p> Full article ">Figure 6
<p>GO enrichment analysis of <span class="html-italic">OsNHX</span> genes in <span class="html-italic">Oryza sativa</span>. The results are grouped into three main categories: biological process (BP), cellular component (CC), and molecular function (MF). The y-axis shows the number of genes, while the x-axis shows the predicted functions.</p> Full article ">Figure 7
<p>Analysis of <span class="html-italic">cis</span>-regulatory elements (CREs) in <span class="html-italic">OsNHX</span> genes. (<b>A</b>) The stacked bar chart of 11 CREs groups was identified from the PLACE PLANT database. (<b>B</b>) Phylogenetic tree was constructed using the N-J method in MEGA11. (<b>C</b>) Heatmap showing the frequency and distribution of stress-responsive CREs.</p> Full article ">Figure 8
<p>Heat map showing differential expression levels in FPKM of <span class="html-italic">OsNHX</span> genes under salt stress from two cultivars (IR64 and Pokkali). IR64_Control_FPKM: non-treated IR64; IR64_SS_FPKM: IR64 salt stress; PK_SS_FPKM: Pokkali salt stress; PK_Control_FPKM: non-treated Pokkali. The high expression level is indicated by the red color and the low expression level is shown by blue, with the color scale from 0 to 3.5 representing the FPKM expression values.</p> Full article ">
Open AccessReview
A Review of Edible Wild Plants Recently Introduced into Cultivation in Spain and Their Health Benefits
by
Benito Valdes, Ekaterina Kozuharova and Christina Stoycheva
Int. J. Plant Biol. 2025, 16(1), 5; https://doi.org/10.3390/ijpb16010005 - 3 Jan 2025
Abstract
Before the Bronze age, when agricultural practices spread throughout the Iberian Peninsula, the diet of the native people was based on hunting, fishing, and gathering wild plants. In spite of modern agriculture, the popular gathering of wild species for medical use, food, craftwork,
[...] Read more.
Before the Bronze age, when agricultural practices spread throughout the Iberian Peninsula, the diet of the native people was based on hunting, fishing, and gathering wild plants. In spite of modern agriculture, the popular gathering of wild species for medical use, food, craftwork, etc., for centuries has left a detailed knowledge on the use of many of these species. Of the 6176 Angiosperms native to the Iberian Peninsula and the Balearic Islands, over 200 species were introduced into cultivation during the Neolithic period outside the Iberian Peninsula. The names of 30 of the progenitors still popularly used as food are listed in this paper, together with the names of their derived crops. This review focuses on five wild species collected as food from ancient times, namely Borago officinalis L. Prunus spinosa L., Silene vulgaris (Moench) Garke subsp. vulgaris, Scolymus hispanicus L., and Asparagus acutifolius L. In response to great demand, they have been recently introduced into cultivation in Spain and are now harvested and commercialized as new crops. Special attention is paid to their basic bioactive compounds and pharmacological properties. The limitation of this study is that the published information about the bioactive compounds of these five plants originates from different parts of the world where they grow wild or are cultivated. Therefore, further research is needed to trace the metabolomic dynamics of these plants regarding geographical and ecological principles, as well as wild versus cultivated origins.
Full article
(This article belongs to the Section Plant Ecology and Biodiversity)
►▼
Show Figures
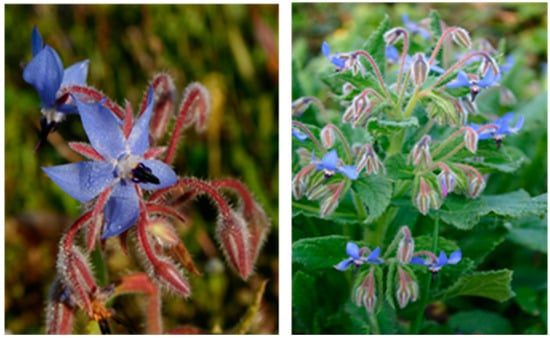
Figure 1
Figure 1
<p><span class="html-italic">Borago officinalis</span> L. (Photo by B. Valdés): flower (<b>left</b>); inflorescence (<b>right</b>).</p> Full article ">Figure 2
<p><span class="html-italic">Prunus spinosa</span> L. fruit (Photo by E. Kozuharova).</p> Full article ">Figure 3
<p><span class="html-italic">Silene vulgaris</span> (Moench) Garke subsp. <span class="html-italic">vulgaris</span> (Photo by B. Valdés).</p> Full article ">Figure 4
<p><span class="html-italic">Scolymus hispanicus</span> L. (Photos by B. Valdés): stem and flower heads (<b>left</b>); flower heads (<b>right</b>).</p> Full article ">Figure 5
<p><span class="html-italic">Asparagus acutifolius</span> L. (Photo by B. Valdés).</p> Full article ">
Open AccessArticle
Effect of Different Media and Plant Hormone Concentrations on Callus Induction and Regeneration of Red Squill (Squilla maura) and Peruvian Squill (Oncostema peruviana)
by
Ibtisam Chakrane, Omar Chlyah, Said Boughribil, Fatima Gaboun and Meriem Mdarhri Alaoui
Int. J. Plant Biol. 2025, 16(1), 4; https://doi.org/10.3390/ijpb16010004 - 2 Jan 2025
Abstract
Two bulbous plant species, Squilla maura and Oncostema peruviana (Asparagaceae), show particularly interesting ornamental and medicinal characteristics. Micropropagation could be a promising alternative method to accelerate their naturally slow spreading pattern. This study focused on the effects of different growth regulators and culture
[...] Read more.
Two bulbous plant species, Squilla maura and Oncostema peruviana (Asparagaceae), show particularly interesting ornamental and medicinal characteristics. Micropropagation could be a promising alternative method to accelerate their naturally slow spreading pattern. This study focused on the effects of different growth regulators and culture media on callus induction and shoot regeneration, from which an effective protocol was established. Leaf explants were cultured on Murashige and Skoog (MS), MS/2, or B5 medium, containing one auxin—1-Naphthaleneacetic acid (NAA), 2,4-Dichlorophenoxyacetic acid (2.4-D), or 3-indolebutyric acid (IBA)—combined with the cytokinin 6-Benzylaminopurine (BAP), at various concentrations. All treatments resulted in callogenesis rates between 65–100% for both species. These treatments led to direct bulbil regeneration. Among the treatments, the B5 medium with 1 mgL−1 BAP and 1 mgL−1 2,4-D gave the highest regeneration rate (89.2%) for O. peruviana, while the ½MS medium with 0.5 mgL−1 BAP and 0.5 mgL−1 NAA showed the highest regeneration rate (85.5%) for S. maura. The highest mean number of bulils per explant was 7.44 for O. peruviana on the MS medium (0.5 mgL−1 BAP and 2 mgL−1 IBA), and 9.5 for S. maura on the MS medium (1 mgL−1 BAP and 0.5 mgL−1 NAA). The regenerated bulbils were transferred for multiplication to the MS medium with a hormone combination (2 mgL−1 BAP and 0.2 mgL−1 NAA) which increased the multiplication rate compared to the callus induction me dium, with a highest recorded multiplication rate of 177 (O. peruviana) and 104.33 (S. maura). The propagation stage achieved the highest number of bulbils/explant after a second subculture for the two species. An efficient micropropagation protocol was established for S. maura, which answers our main objective, and it would contribute to their conservation and sustainable use in ornamental and medicinal applications.
Full article
(This article belongs to the Section Plant Reproduction)
►▼
Show Figures
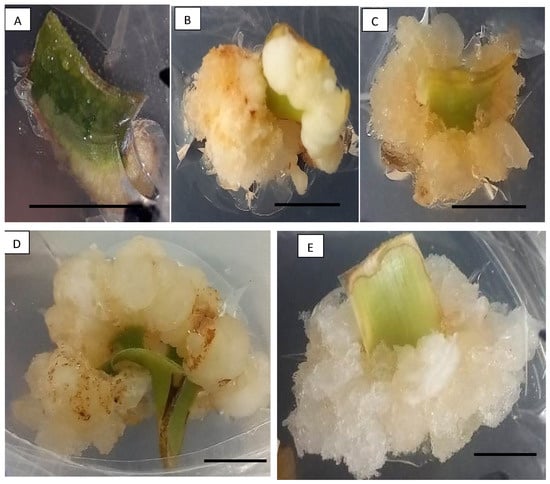
Figure 1
Figure 1
<p>Different types of calluses obtained on <span class="html-italic">O. peruviana</span> explants after 45 days of cultivation. (<b>A</b>): swelling of the base of the leaf explant; (<b>B</b>): compact beige callus; (<b>C</b>): brittle beige callus; (<b>D</b>): compact white callus; and (<b>E</b>): brittle white callus. Scale: 1 cm.</p> Full article ">Figure 2
<p>Different types of calluses and embryos obtained on leaf explants of <span class="html-italic">S. maura</span>. (<b>A</b>): compact beige calluses, (<b>B</b>): nodular beige calluses, (<b>C</b>): globular embryos, (<b>D</b>): cordiform embryos, and (<b>E</b>): torpedo embryos. Scale: 0.1 cm.</p> Full article ">Figure 3
<p>Regeneration phase: (<b>A</b>): <span class="html-italic">O. peruviana</span> bulbils on MS medium supplemented with 0.5 mgL<sup>−1</sup> of BAP + 1 mgL<sup>−1</sup> of 2,4-D, after six weeks of culture at 25 °C in the dark. Scale: 1 cm. (<b>B</b>): Bulbils on MS/2, and (<b>C</b>): bulbils on B5 media supplemented with 0.5 mgL<sup>−1</sup> BAP + 1 mgL<sup>−1</sup> IBA, after six weeks of culture at 25 °C in the dark. Scale: 0.1 cm; and (<b>D</b>): <span class="html-italic">S. maura</span> bulbils rooted on MS/2 medium supplemented with 1 mg/L BAP and 0.5 mg/L NAA, after six weeks of culture at (25° ± 1) °C in the dark. Scale: 1 cm.</p> Full article ">Figure 4
<p>Bulbils of <span class="html-italic">O. peruviana</span> regenerated in vitro, having proliferated on MS4 medium supplemented with 2 m.gL-1 of BAP in association with 0.2 mg/L of NAA under a photoperiod of 16/8 h after eight weeks of culture. (<b>A</b>,<b>B</b>): Bulbils before and after their separation. (<b>C</b>): Bulbils regenerated indirectly from brittle calluses. Scale: 1 cm.</p> Full article ">Figure 5
<p>Bulbils of <span class="html-italic">S. maura</span> regenerated in vitro, having proliferated on MS4 medium supplemented with 2 mgL<sup>−1</sup> of BAP in association with 0.2 mgL<sup>−1</sup> of NAA under a photoperiod of 16/8 h after eight weeks of culture. Scale: 1 cm.</p> Full article ">Figure 6
<p>Seedlings of <span class="html-italic">O. peruviana</span> before (<b>A</b>) and after acclimation (<b>B</b>,<b>C</b>), and seedlings of <span class="html-italic">S. maura</span> before (<b>D</b>) and after acclimatization (<b>E</b>) one month later. Scale: 1 cm.</p> Full article ">
Open AccessBrief Report
The Effects of Bradyrhizobium japonicum Inoculation and Superphosphate Fertilizer on the Growth and Development of Lablab (Lablab purpureus L.)
by
Latoya Miranda Mthimunye, Gudani Millicent Managa and Lufuno Ethel Nemadodzi
Int. J. Plant Biol. 2025, 16(1), 3; https://doi.org/10.3390/ijpb16010003 - 2 Jan 2025
Abstract
Nutrient-poor savanna soils severely limit agricultural productivity in Africa, hindering crops and livestock intensification and threatening food security. Addressing these deficiencies is crucial to meeting the world’s growing food demands and ensuring sustainable agricultural development. The experiment was conducted in a greenhouse laid
[...] Read more.
Nutrient-poor savanna soils severely limit agricultural productivity in Africa, hindering crops and livestock intensification and threatening food security. Addressing these deficiencies is crucial to meeting the world’s growing food demands and ensuring sustainable agricultural development. The experiment was conducted in a greenhouse laid in a randomized complete block design with eight treatments, namely: (T1) control, (T2) 45 kg/ha superphosphate, (T3) 60 kg/ha superphosphate, (T4) 75 kg/ha superphosphate, (T5) Bradyrhizobium japonicum inoculant, (T6) Bradyrhizobium japonicum inoculant +45 kg/ha superphosphate, (T7) Bradyrhizobium japonicum inoculant +60 kg/ha superphosphate, and (T8) Bradyrhizobium japonicum inoculant +75 kg/ha superphosphate. The findings showed that the highest plant height was noted when lablab was supplemented with T4 treatment at day 21, while T2 of superphosphate had the highest leaf area. Conversely, soil supplemented with superphosphate at different levels and/or lablab seeds treated with Bradyrhizobium inoculant did not have a significant effect on the number of leaves. Overall, the application of superphosphate to the soil at different levels and treating lablab seeds with Bradyrhizobium inoculant did not have any significant effect on the plant height, number of leaves, and leaf area. On day 37, the highest leaf chlorophyll was recorded on T1 and became constant amongst all the treatments as the growth progressed. From the current study, it is concluded that growing lablab in a controlled environment would benefit subsistence farmers and rural communities for its leaves consumed as vegetables and ultimately ensure food security.
Full article
(This article belongs to the Section Plant Physiology)
►▼
Show Figures
Figure 1
Open AccessArticle
Hormonal Priming to Increase Germination of Stevia rebaudiana Bertoni Seeds in Saline Environments
by
Iman Janah, Abdelhadi Elhasnaoui, Houssam Abouloifa, Mohamed Ait-El-Mokhtar and Raja Ben Laouane
Int. J. Plant Biol. 2025, 16(1), 2; https://doi.org/10.3390/ijpb16010002 - 2 Jan 2025
Abstract
Hormonal priming has recently emerged as a powerful strategy to increase seed germination and early seedling growth, especially in challenging abiotic stress environments. This study explored the impact of gibberellic acid (GA) and salicylic acid (SA) priming on the germination performance of Stevia
[...] Read more.
Hormonal priming has recently emerged as a powerful strategy to increase seed germination and early seedling growth, especially in challenging abiotic stress environments. This study explored the impact of gibberellic acid (GA) and salicylic acid (SA) priming on the germination performance of Stevia rebaudiana seeds under saline conditions. Stevia seeds were either hydroprimed with distilled water (control) or primed with varying concentrations of GA (0.1 and 0.2%) and SA (0.25 and 0.5 mM) and then exposed to salt stress (0 and 80 mM NaCl). The results demonstrated that GA and SA priming significantly enhanced germination rates, reduced mean germination time, and improved the salt tolerance index compared to untreated seeds. Primed seeds showed notable improvements in seedling vigor, including greater shoot and root lengths under salinity stress. The best results were achieved with 0.1% GA and 0.5 mM SA, effectively alleviating the detrimental impact of high salinity on germination. The primed seeds also exhibited reduced electrolyte leakage, signifying improved membrane stability under salt stress. In conclusion, this study presents robust evidence that GA and SA priming is an effective approach for enhancing the germination, salt tolerance index, and early growth of Stevia under saline conditions, offering a practical solution to improve crop establishment in salinity-affected regions.
Full article
(This article belongs to the Section Plant Response to Stresses)
►▼
Show Figures
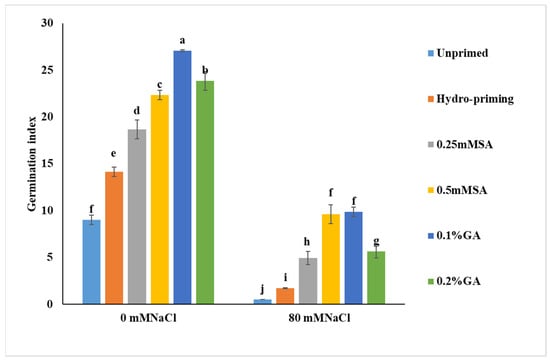
Figure 1
Figure 1
<p>Effect of salicylic acid (0.25 and 0.5 mM) and gibberellic acid (0.1 and 0.2%) priming on germination index of Stevia seeds under salt stress (0 and 80 mM NaCl) conditions. Results are expressed as mean ± SD of 3 independent replicates. Values followed by different lowercase letters are significantly different according to LSD test (<span class="html-italic">p</span> ≤ 0.05).</p> Full article ">Figure 2
<p>Effect of salicylic acid (0.25 and 0.5 mM) and gibberellic acid (0.1 and 0.2%) priming on precocity of germination of Stevia seeds under salt stress (0 and 80 mM NaCl) conditions. Results are expressed as mean ± SD of 3 independent replicates. Values followed by different lowercase letters are significantly different according to LSD test (<span class="html-italic">p</span> ≤ 0.05).</p> Full article ">Figure 3
<p>Effect of salicylic acid (0.25 and 0.5 mM) and gibberellic acid (0.1 and 0.2%) priming on total germination of Stevia seeds under salt stress (0 and 80 mM NaCl) conditions. Results are expressed as mean ± SD of 3 independent replicates. Values followed by different lowercase letters are significantly different according to LSD test (<span class="html-italic">p</span> ≤ 0.05).</p> Full article ">Figure 4
<p>Effect of salicylic acid (0.25 and 0.5 mM) and gibberellic acid (0.1 and 0.2%) priming on the mean germination time of Stevia seeds under salt stress (0 and 80 mM NaCl) conditions. Results are expressed as mean ± SD of 3 independent replicates. Values followed by different lowercase letters are significantly different according to LSD test (<span class="html-italic">p</span> ≤ 0.05).</p> Full article ">Figure 5
<p>Effect of salicylic acid (0.25 and 0.5 mM) and gibberellic acid (0.1 and 0.2%) priming on salt tolerance index of Stevia seeds under salt stress (0 and 80 mM NaCl) conditions. Results are expressed as mean ± SD of 3 independent replicates. Values followed by different lowercase letters are significantly different according to LSD test (<span class="html-italic">p</span> ≤ 0.05).</p> Full article ">Figure 6
<p>Effect of salicylic acid (0.25 and 0.5 mM) and gibberellic acid (0.1 and 0.2%) priming on seed vigor index of Stevia seeds under salt stress (0 and 80 mM NaCl) conditions. Results are expressed as mean ± SD of 3 independent replicates. Values followed by different lowercase letters are significantly different according to LSD test (<span class="html-italic">p</span> ≤ 0.05).</p> Full article ">
Open AccessArticle
Plant Growth-Promoting and Biocontrol Characteristics of Four Bacillus Strains and Evaluation of Their Effects on Wheat (Tr. aestivum L.)
by
Mariana Petkova, Marina Marcheva, Antonia-Lucia Petrova, Vanya Slavova and Stefan Shilev
Int. J. Plant Biol. 2025, 16(1), 1; https://doi.org/10.3390/ijpb16010001 - 27 Dec 2024
Abstract
The present study investigated developing biological control agents against plant pathogens as an alternative to pesticides. The plant growth-promoting (PGP) and biocontrol potential of bacteria from the Bacillus genus is due to their ability to produce proteolytic and amylolytic enzymes, assist in the
[...] Read more.
The present study investigated developing biological control agents against plant pathogens as an alternative to pesticides. The plant growth-promoting (PGP) and biocontrol potential of bacteria from the Bacillus genus is due to their ability to produce proteolytic and amylolytic enzymes, assist in the solubilization of phosphorus and zinc, and the production of siderophores. Cell culture and cell-free supernatant were used to investigate the antimicrobial activity of different Bacillus strains against the phytopathogenic fungus Fusarium graminearum in vitro. Fusarium graminearum is a fungus that causes plant disease, particularly in cereals like wheat and barley. As a result, significant suppression of the growth and development of this plant pathogen was observed. Plant growth-promoting activity manifested when the bacteria were applied alone and in combination. A single strain and combinations of two, three, and four strains of Bacillus were tested for their antimicrobial effects against Fusarium graminearum. The fluorescence spectroscopy results proved that the combination of Bacillus subtilis, Bacillus circulans, Bacillus megaterium, and Bacillus licheniformis showed the best stimulation of development, expressed as a comparative evaluation of the yield compared to the untreated control variant. The four strains showed their potential application as a biocontrol agent against Fusarium graminearum. The four Bacillus strains also can promote plant growth by affecting nutrition, root structure, and plant health, and they have the capacity to dissolve phosphates and zinc.
Full article
(This article belongs to the Section Plant–Microorganisms Interactions)
►▼
Show Figures
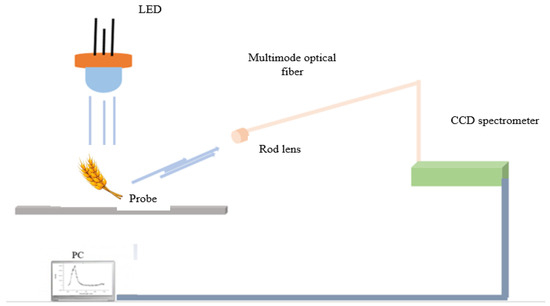
Figure 1
Figure 1
<p>Mobile fiber-optic scheme for the measured fluorescence emission signals of individual wheat samples.</p> Full article ">Figure 2
<p>Indole-3-acetic acid production by the test bacteria in a medium with 0.1% (<span class="html-italic">w</span>/<span class="html-italic">v</span>) L-tryptophan incubated at 30 °C and 150 rpm for 24 h. Note: a and b indicate statistical references and * indicates high significance (<span class="html-italic">p</span> < 0.05).</p> Full article ">Figure 3
<p>1.5% agarose gel showing the PCR products from (<b>A</b>) <span class="html-italic">ituC</span> (423 bp), (<b>B</b>) <span class="html-italic">fen</span>D (269 bp), and (<b>C</b>) <span class="html-italic">surfAA</span> (231 bp). The marker (M) lane contains the 100 bp DNA ladder New England Biolabs (Cambridge, UK. Lane 1—<span class="html-italic">B. subtilis</span>, lane 2—<span class="html-italic">B. licheniformis</span>, lane 3—<span class="html-italic">B. megaterium</span> and lane 4—<span class="html-italic">B. circulans</span>.</p> Full article ">Figure 4
<p>Antifungal activity of the tested strains against <span class="html-italic">Fusrium graminearum</span> NBIMCC 2294 on PDA for 7 days incubation at 28 °C.</p> Full article ">Figure 5
<p>(<b>a</b>) Differences in emission wavelength for Control (1), <span class="html-italic">B. subtilis</span> (2, 20, and 40), <span class="html-italic">B. licheniformis</span> (3, 27, and 31), <span class="html-italic">B. circulans</span> (4, 36, and 18), and <span class="html-italic">B. megaterium</span> (4, 36, and 18). (<b>b</b>) Differences in emission wavelength for <span class="html-italic">B. subtilis</span> (2, 20, and 40), <span class="html-italic">B. subtilis</span> + <span class="html-italic">B. licheniformis</span> (6, 17, and 35), <span class="html-italic">B. subtilis</span> + <span class="html-italic">B. circulans</span> (7, 21, and 42), <span class="html-italic">B. subtilis</span> + <span class="html-italic">B. megaterium</span> (8, 30, and 45), <span class="html-italic">B. subtilis + B. licheniformis + B. circulans</span> (12, 29, and 33), <span class="html-italic">B. subtilis + B. circulans + B. megaterium</span> (13, 26, and 39), <span class="html-italic">B. subtilis + B. circulans + B. megaterium</span> (14, 24, and 37), and <span class="html-italic">B. subtilis + B. licheniformis + B. circulans + B. megaterium</span> (16, 25, and 46). (<b>c</b>) Differences in emission wavelength for <span class="html-italic">B. licheniformis</span> (3, 27, and 31), <span class="html-italic">B. subtilis + B. licheniformis</span> (6, 17, and 35), <span class="html-italic">B. licheniformis + B. circulans</span> (9, 19, and 38), <span class="html-italic">B. licheniformis + B. megaterium</span> (10, 22, and 41), <span class="html-italic">B. subtilis + B. licheniformis + B. circulans</span> (12, 29, and 33), <span class="html-italic">B. subtilis + B. circulans + B. megaterium</span> (13, 26, and 39), <span class="html-italic">B. licheniformis + B. circulans + B. megaterium</span> (15, 28, and 44), and <span class="html-italic">B. subtilis + B. licheniformis + B. circulans + B. megaterium</span> (16, 25, and 46). (<b>d</b>) Differences in emission wavelength for <span class="html-italic">B. circulans</span> (4, 18, and 36), <span class="html-italic">B. subtilis + B. circulans</span> (7, 21, and 42), <span class="html-italic">B. licheniformis + B. circulans</span> (9, 19, and 38), <span class="html-italic">B. circulans + B. megaterium</span> (11, 23, and 34), <span class="html-italic">B. subtilis + B. licheniformis + B. circulans</span> (12, 29, and 33), <span class="html-italic">B. licheniformis + B. circulans + B. megaterium</span> (15, 28, and 44), <span class="html-italic">B. subtilis + B. circulans + B. megaterium</span> (14, 24, and 37), and <span class="html-italic">B. subtilis + B. licheniformis + B. circulans + B. megaterium</span> (16, 25, and 46). (<b>e</b>) Differences in emission wavelength for <span class="html-italic">B. megaterium</span> (5), <span class="html-italic">B. subtilis + B. megaterium</span> (8, 30, and 45), <span class="html-italic">B. licheniformis + B. megaterium</span> (10, 22, and 41), <span class="html-italic">B. circulans + B. megaterium</span> (11, 23, and 34), <span class="html-italic">B. subtilis + B. circulans + B. megaterium</span> (13, 26, and 39), <span class="html-italic">B. licheniformis + B. circulans + B. megaterium</span> (15, 28, and 44), <span class="html-italic">B. subtilis + B. circulans + B. megaterium</span> (14, 24, and 37), and <span class="html-italic">B. subtilis + B. licheniformis + B. circulans + B. megaterium</span> (16, 25, and 46).</p> Full article ">
Open AccessArticle
The Role of Different Rhizobacteria in Mitigating Aluminum Stress in Rice (Oriza sativa L.)
by
Mercedes Susana Carranza-Patiño, Juan Antonio Torres-Rodriguez, Juan José Reyes-Pérez, Robinson J. Herrera-Feijoo, Ángel Virgilio Cedeño-Moreira, Alejandro Jair Coello Mieles, Cristhian John Macías Holguín and Cristhian Chicaiza-Ortiz
Int. J. Plant Biol. 2024, 15(4), 1418-1436; https://doi.org/10.3390/ijpb15040098 - 23 Dec 2024
Abstract
Aluminum toxicity in acidic soils threatens rice (Oryza sativa L.) cultivation, hindering agricultural productivity. This study explores the potential of plant growth-promoting rhizobacteria (PGPR) as a novel and sustainable approach to mitigate aluminum stress in rice. Two rice varieties, INIAP-4M and SUPREMA
[...] Read more.
Aluminum toxicity in acidic soils threatens rice (Oryza sativa L.) cultivation, hindering agricultural productivity. This study explores the potential of plant growth-promoting rhizobacteria (PGPR) as a novel and sustainable approach to mitigate aluminum stress in rice. Two rice varieties, INIAP-4M and SUPREMA I-1480, were selected for controlled laboratory experiments. Seedlings were exposed to varying aluminum concentrations (0, 2, 4, 8, and 16 mM) in the presence of four PGPR strains: Serratia marcescens (MO4), Enterobacter asburiae (MO5), Pseudomonas veronii (R4), and Pseudomonas protegens (CHAO). The INIAP-4M variety exhibited greater tolerance to aluminum than SUPREMA I-1480, maintaining 100% germination up to 4 mM and higher vigor index values. The study revealed that rhizobacteria exhibited different responses to aluminum concentrations. P. protegens and S. marcescens showed the highest viability at 0 mM (2.65 × 10¹⁰ and 1.71 × 10¹⁰ CFU mL−1, respectively). However, P. veronii and S. marcescens exhibited the highest viability at aluminum concentrations of 2 and 4 mM, indicating their superior tolerance and adaptability under moderate aluminum stress. At 16 mM, all strains experienced a decrease, with P. protegens and E. asburiae being the most sensitive. The application of a microbial consortium significantly enhanced plant growth, increasing plant height to 73.75 cm, root fresh weight to 2.50 g, and leaf fresh weight to 6 g compared to the control (42.75 cm, 0.88 g, and 3.63 g, respectively). These findings suggest that PGPR offer a promising and sustainable strategy to bolster rice resilience against aluminum stress and potentially improve crop productivity in heavy metal-contaminated soils.
Full article
(This article belongs to the Section Plant–Microorganisms Interactions)
►▼
Show Figures
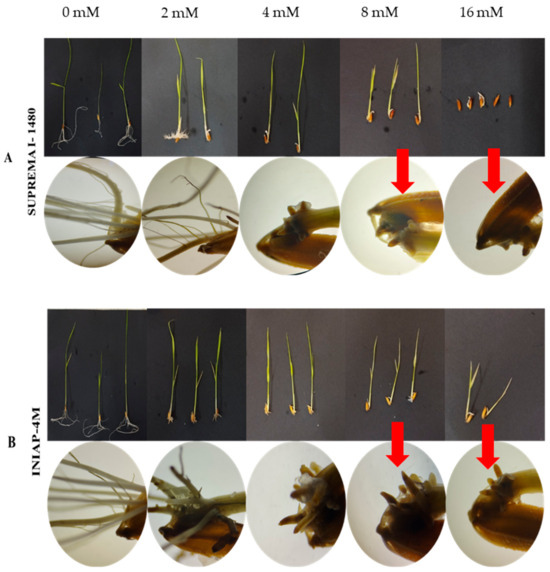
Figure 1
Figure 1
<p>Analysis of morphological traits in rice genotypes grown on water–agar with different concentrations of aluminum. (<b>A</b>) Degree of tolerance to aluminum of the SUPREMA I-1480 genotype. (<b>B</b>) Degree of tolerance to aluminum of the INIAP-4M genotype. The red arrows indicate root necrosis at concentrations of 8 and 16 mM.</p> Full article ">Figure 2
<p>Viability of aluminum-tolerant rhizobacteria (Al<sub>2</sub>(SO<sub>4</sub>)<sub>3</sub>). The bars indicate the individual SD (standard deviation) for treatment (±). Means with equal letters on the lines do not differ significantly, according to Tukey’s test (<span class="html-italic">p</span> ≤ 0.05).</p> Full article ">Figure 3
<p>Cellular content of aluminum-tolerant rhizobacteria. The red arrows indicate the degree of tolerance at a 16 mM concentration. The Al concentration in X, while the abundance of specific species in Y from the figure.</p> Full article ">Figure 4
<p>Tolerance of rhizobacteria to different concentrations of aluminum. The bars indicate the individual SD (standard deviation) for treatment (±). Means with equal letters in the column do not differ significantly, according to Tukey’s test (<span class="html-italic">p</span> ≤ 0.05).</p> Full article ">Figure 5
<p>Hydrogen potential content of aluminum-tolerant bacteria. Bars indicate individual SD (standard deviation) for treatment (±). Means with equal letters in the column do not differ significantly, according to Tukey’s test (<span class="html-italic">p</span> ≤ 0.05).</p> Full article ">Figure 6
<p>Plant and root length inoculated with aluminum-tolerant rhizobacteria. Bars indicate individual SD (standard deviation) for treatment (±). Means with equal letters in the column do not differ significantly, according to Tukey’s test (<span class="html-italic">p</span> ≤ 0.05).</p> Full article ">Figure 7
<p>Effect of rhizobacteria on fresh and dry weight of roots in aluminum-contaminated soil. Bars indicate individual SD (standard deviation) for treatment (±). Means with equal letters in the column do not differ significantly according to Tukey’s test (<span class="html-italic">p</span> ≤ 0.05).</p> Full article ">Figure 8
<p>Effect of rhizobacteria on fresh and dry weight of leaves in soil contaminated with aluminum. Bars indicate individual SD (standard deviation) for treatment (±). Means with equal letters in the column do not differ significantly, according to Tukey’s test (<span class="html-italic">p</span> ≤ 0.05).</p> Full article ">Figure 9
<p>Viability of the presence of tolerant rhizobacteria in aluminum-contaminated soil. Bars indicate individual SD (standard deviation) for treatment (±). Means with equal letters in the column do not differ significantly according to Tukey’s test (<span class="html-italic">p</span> ≤ 0.05). CUF: colony-forming units.</p> Full article ">
Open AccessArticle
Characterization of the Rhizobiome of the Yellow Pitcher Plant (Sarracenia flava) in Wild and Restored Habitats of Virginia
by
Bo-Young Lee, Nikki Andresen, Phil Sheridan and Bonnie L. Brown
Int. J. Plant Biol. 2024, 15(4), 1405-1417; https://doi.org/10.3390/ijpb15040097 - 23 Dec 2024
Abstract
The yellow pitcher plant, Sarracenia flava, is an insectivorous perennial distributed extensively in southeastern North America. In Virginia, it is restricted to a few wetland ecosystems, with only one natural site known to remain. To uncover whether there were microbial differences in
[...] Read more.
The yellow pitcher plant, Sarracenia flava, is an insectivorous perennial distributed extensively in southeastern North America. In Virginia, it is restricted to a few wetland ecosystems, with only one natural site known to remain. To uncover whether there were microbial differences in the rhizospheres across natural and reintroduced sites of pitcher plant restoration, shotgun metagenome sequencing was undertaken to characterize the microbiomes of the healthy rhizosphere in the last remaining natural stand in Virginia compared to rhizospheres sampled in two restored habitats where pitcher plants were reintroduced and a nearby control habitat without pitcher plants. Statistical analysis showed no significant differences in rhizobiome communities among the natural, reintroduced, and control sites. Comparison of test rhizobiomes with those of other soil types revealed no significant difference in S. flava habitats versus wildland soil types but significant difference from agricultural soils. Indicator species analysis found Pseudomonas was a significantly more abundant genus in the S. flava habitats. The control site was enriched with iron-reducing bacteria compared to the rest of the sites. Further studies based on gene expression could better facilitate an understanding of the role of Pseudomonas in S. flava rhizosphere specific to habitats, which will provide better knowledge for local conservation of this plant.
Full article
(This article belongs to the Section Plant–Microorganisms Interactions)
►▼
Show Figures
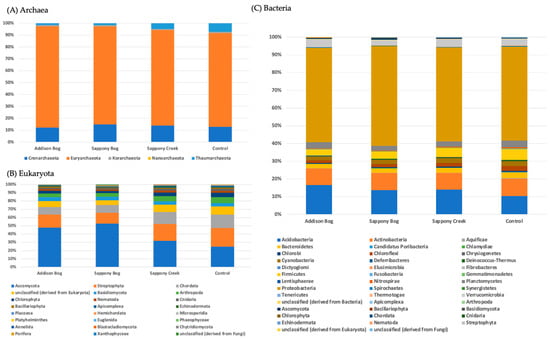
Figure 1
Figure 1
<p>Relative normalized abundance (≥0.01%) of rhizobiome consortia in four Virginia habitats, three with living <span class="html-italic">Sarracenia flava</span> stands and one without. (<b>A</b>) Archaea proportions; (<b>B</b>) Eukaryote; and (<b>C</b>) Bacteria. <span class="html-italic">X</span>-axis: site; <span class="html-italic">y</span>-axis: relative abundance (%).</p> Full article ">Figure 2
<p>Rhizobiome consortia in <span class="html-italic">S. flava</span> at the last known natural stand, restored, and control sites. (<b>A</b>) Rhizobiome composition of <span class="html-italic">S. flava</span> in Sappony Creek up to the class level; (<b>B</b>) NMDS plots of microbiome communities in four different habitats; (<b>C</b>) Heap map of the most abundant 21 genera across the habitats.</p> Full article ">Figure 3
<p>Comparison of microbiome genera across four different S. flava rhizobiomes in Virginia and 14 other soil rhizobiomes accessed through MG-RAST. (<b>A</b>) NMDS plots of microbiome composition from different soil types and regions; (<b>B</b>) <span class="html-italic">p</span>-values of pairwise Adonis analysis based on soil type; (<b>C</b>) Relative abundance heat map of most abundant 45 genera in 18 sites.</p> Full article ">Figure 4
<p>Functional annotation of <span class="html-italic">S. flava</span> rhizobiome sequences. (<b>A</b>) KEGG Orthology annotation at Level 1 and Level 2; (<b>B</b>) The top ten KO pathways annotated by sequence read in each sample.</p> Full article ">
Open AccessArticle
Evaluation of Tomato Landraces for Tolerance to Drought Stress Using Morphological and Physiological Traits
by
Stanislava Grozeva, Elena Topalova, Daniela Ganeva and Ivanka Tringovska
Int. J. Plant Biol. 2024, 15(4), 1391-1404; https://doi.org/10.3390/ijpb15040096 - 23 Dec 2024
Abstract
Drought is among the stress factors that, on a global scale, have direct negative effects on plant growth, yield, and quality. Great efforts are directed towards water shortage adaptation. Exploring the genetic diversity of landraces often tolerant to locally occurring stress can represent
[...] Read more.
Drought is among the stress factors that, on a global scale, have direct negative effects on plant growth, yield, and quality. Great efforts are directed towards water shortage adaptation. Exploring the genetic diversity of landraces often tolerant to locally occurring stress can represent a valuable source for the development of cultivars with yield stability and improved quality under stress conditions. This study aimed to identify drought-tolerant tomato landraces based on an integrated approach involving morphological traits and physiological parameters. To investigate the effects of water deficit, five landraces and two controls were tested under optimum and 50% reduced irrigation. Yield and yield-related traits, color, firmness, and chlorophyll fluorescence measurements were evaluated. The summarized results indicated that the tomato landraces differed in their responses to water deficit. Water deficit decreased the yield by 44% and the average fruit weight by 29%. Physiological parameters were also significantly affected by water scarcity, with a decrease in the ratios Fv/Fm (the maximum quantum yield of PSII) and Fv/Fo (the maximum primary yield of photochemistry) of 8.2% and 35.5%, respectively, at 14 days’ exposure to stress. Landrace 1352, characterized by indeterminate growth habit and large, rounded, and red-colored fruits, showed a significantly lower reduction in yield and physiological parameters under reduced irrigation and could be used in breeding programs to develop new tomato lines combining resistance with quality.
Full article
(This article belongs to the Section Plant Response to Stresses)
►▼
Show Figures
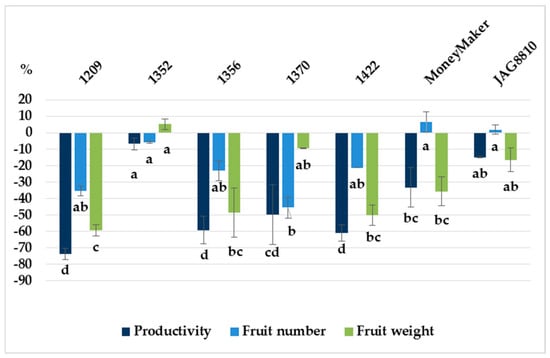
Figure 1
Figure 1
<p>Percentage of change in the value of productivity, fruit number, and fruit weight in five tomato landraces and two controls under 50% reduced irrigation compared to the optimum irrigated plants. Each observation is a mean, ±SD. The different letters under the bars of the same color indicate statistically significant differences according to Tukey’s HSD Test (<span class="html-italic">p</span> < 0.05).</p> Full article ">Figure 2
<p>Effect of water regime (optimum irrigation, OI; reduced irrigation, RI) for fruit physical traits of five landraces and two controls (sensitive MM and tolerant JAG). L*: lightness, a*: redness, and b*: yellowness; C*: chroma, CI*: color index. Each observation is a mean, ±SD. For each figure, the different letters above the bars indicate statistically significant differences according to Tukey’s HSD Test (<span class="html-italic">p</span> < 0.05).</p> Full article ">Figure 3
<p>Effects of different water deficits on (<b>a</b>) initial fluorescence (Fo), (<b>b</b>) maximum quantum efficiency of PSII photochemistry (Fv/Fm), and (<b>c</b>) Fv/Fo in leaves of tomato <span class="html-italic">S. lycopersicum</span> after 7 and 14 days of water deficit. Means, SE (n = 5). The different letters near the bars of the same color indicate statistically significant differences according to Tukey’s HSD Test (<span class="html-italic">p</span> < 0.05).</p> Full article ">
Open AccessArticle
General Physicochemical Parameters, Phenolic Composition, and Varietal Aromatic Potential of Three Red Vitis vinifera Varieties (“Merlot”, Syrah”, and “Saborinho”) Cultivated on Pico Island—Azores Archipelago
by
António M. Jordão, Ana C. Correia, Bárbara Martins, Ana Romão and Bruno Oliveira
Int. J. Plant Biol. 2024, 15(4), 1369-1390; https://doi.org/10.3390/ijpb15040095 - 18 Dec 2024
Abstract
Pico Island is one of the islands of the Azores archipelago located in the North Atlantic Ocean, where there are very specific conditions for vine cultivation. In this context, there is scarce knowledge related to grape ripening under these conditions. Thus, the aim
[...] Read more.
Pico Island is one of the islands of the Azores archipelago located in the North Atlantic Ocean, where there are very specific conditions for vine cultivation. In this context, there is scarce knowledge related to grape ripening under these conditions. Thus, the aim of this study was to evaluate several physicochemical parameters, the phenolic composition, antioxidant capacity, and varietal aromatic potential, of the “Merlot”, Syrah”, and “Saborinho” grape varieties cultivated on Pico Island over three vintages. The outcomes obtained demonstrated that “Merlot” grapes showed a tendency for significantly higher values of estimated alcohol degree, total phenols, flavonoid and non-flavonoid phenols, total anthocyanins, color intensity, and antioxidant capacity over the three vintages. In addition, for individual anthocyanins, “Merlot” and “Syrah” grapes showed a predominance of acetyl-anthocyanins in relation to p-coumaroylated forms, while for “Saborinho” grapes, an oppositive tendency was observed. For varietal aromatic potential, only in the 2021 vintage was it possible to detect significantly different values between the three grape varieties studied. In this case, “Merlot” and “Syrah” grapes showed the significantly highest values. Considering all parameters analyzed, the results obtained for the “Merlot” grape variety seem to show a better adaptation of this variety to the conditions of Pico Island than the remaining two varieties studied.
Full article
(This article belongs to the Section Plant Biochemistry and Genetics)
►▼
Show Figures
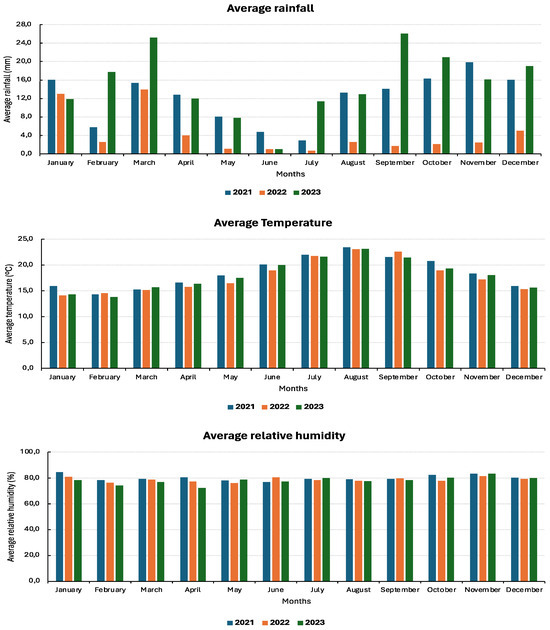
Figure 1
Figure 1
<p>Evolution of monthly mean climatic conditions (rainfall, temperature, and relative humidity) during the 2021, 2022, and 2023 vintages in the vineyard located on Pico Island (Azores archipelago).</p> Full article ">Figure 2
<p>Antioxidant capacity of “Merlot”, “Syrah”, and “Saborinho” grape varieties at harvest (between 45 and 50 days after veraison) over three vintages (2021 to 2023) in Pico Island (Azores archipelago). * Different letters for the same vintage indicate the existence of statistical differences (Tukey test, <span class="html-italic">p</span> < 0.05); all data express the average of four replicates ± standard deviation.</p> Full article ">Figure 3
<p>Varietal aroma potential index (IPAV) of “Merlot”, “Syrah”, and “Saborinho” grape varieties at harvest (between 45 and 50 days after veraison) over three vintages (2021 to 2023) on Pico Island (Azores archipelago). * Different letters for the same vintage indicate the existence of statistical differences (Tukey test, <span class="html-italic">p</span> < 0.05); all data express the average of four replicates ± standard deviation.</p> Full article ">Figure 4
<p>Principal component analysis (PCA; PC1 and PC2) for the different variables and grape varieties at harvest over three vintages. (<b>A</b>) Projection of variables; (<b>B</b>) projection of grape variety samples. (<b>A</b>) Projection of variables: <span class="html-italic">physicochemical parameters</span> (Alch—estimated alcohol degree; pH; Tit_Ac—titratable acidity); <span class="html-italic">global phenolic parameters</span> (T_Phe—total phenols; Flav—flavonoid phenols; Non_Flav—non-flavonoid phenols; T_Anth—total anthocyanins; Col_Int—color intensity); <span class="html-italic">individual anthocyanins</span> (Delf_gluc—delphinidin-3-glucoside; Cyan_gluc—cyanidin-3-glucoside; Petun_gluc—petunidin-3-glucoside; Peon_gluc—peonidin-3-glucoside; Malv_gluc—malvidin-3-glucoside; Delf_acet_gluc—delphinidin-3-acetylglucoside; Pet_acet_gluc—petunidin-3-acetylglucoside; Peon_acet_gluc—peonidin-3-acetylglucoside; Malv_acet_gluc—malvidin-3-acetylglucoside; Pet_coum_gluc—petunidin-3- <span class="html-italic">p</span>-coumaroyl glucoside; Peon_coum_gluc—peonidin-3-<span class="html-italic">p</span>-coumaroyl glucoside; Malv_coum_gluc—malvidin-3-<span class="html-italic">p</span>-coumaroyl glucoside); <span class="html-italic">anthocyanin</span> ratios (Anth_Rat_1—∑Malv)/∑Peon; Anth_Rat_2—∑Coum/∑Acet; Anth_Rat_3—∑Delf/∑Peon; Anth_Rat_4—∑Petun/∑Peon); <span class="html-italic">antioxidant capacity</span> (ABTS—ABTS method results; DPPH—DPPH method results; <span class="html-italic">varietal aroma potential</span> index (IPAV results). (<b>B</b>) Projection grape variety samples: <span class="html-italic">grape varieties</span> (Me—Merlot; Sy—Syrah; Sb—Saborinho); vintages (2021; 2022; 2023).</p> Full article ">
Open AccessBrief Report
Low Mortality Rates Among Tropical Ferns
by
Laura Salazar, Jürgen Kluge, Jürgen Homeier and Michael Kessler
Int. J. Plant Biol. 2024, 15(4), 1360-1368; https://doi.org/10.3390/ijpb15040094 - 18 Dec 2024
Abstract
Tropical ferns are underrepresented in demographic studies, despite their ecological importance in forest ecosystems. This study investigates the mortality rates of terrestrial ferns along an elevational gradient (500–4000 m a.s.l.) in Ecuador, focusing on relationships with environmental variables, community characteristics, and plant size.
[...] Read more.
Tropical ferns are underrepresented in demographic studies, despite their ecological importance in forest ecosystems. This study investigates the mortality rates of terrestrial ferns along an elevational gradient (500–4000 m a.s.l.) in Ecuador, focusing on relationships with environmental variables, community characteristics, and plant size. Over two years (2009–2011), 3213 individuals representing 88 species were monitored in 22 permanent plots across eight elevations. Mortality rates, calculated as the percentage of individuals lost annually, averaged 0.87%, with a hump-shaped trend along the gradient and a significant negative relationship with temperature. Mortality rates were positively correlated with species richness and fern density, suggesting competition may influence community structure. Larger individuals exhibited higher mortality rates, likely due to greater resource demands and exposure to environmental stressors. These findings emphasize the interplay of abiotic factors, such as elevation and temperature, and biotic interactions, including competition and herbivory, in shaping fern population dynamics. The low mortality rates observed reflect population stability, potentially linked to unique life history traits, such as extended generation times. This study provides critical insights into the demographic strategies of tropical ferns and underscores the need for long-term research to better understand their responses to environmental and biotic pressures.
Full article
(This article belongs to the Section Plant Ecology and Biodiversity)
►▼
Show Figures
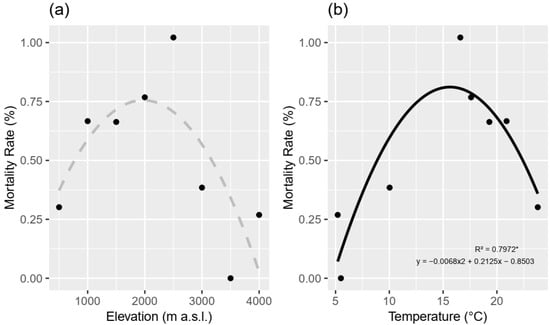
Figure 1
Figure 1
<p>Relationship between mortality rate (%) of ferns and (<b>a</b>) elevation (m a.s.l.) and (<b>b</b>) temperature (°C), both modeled using second-degree polynomial regression. In both panels, the dots represent the percentage of mortality observed at different elevations. The dashed line in panel (<b>a</b>) indicates a non-significant trend, while the black line in panel (<b>b</b>) shows a significant relationship, with the equation and R<sup>2</sup> value displayed. The asterisks next to the R<sup>2</sup> value denote the level of statistical significance: * moderately significant (<span class="html-italic">p</span> ≤ 0.05).</p> Full article ">Figure 2
<p>Relationships between (<b>a</b>) mortality rate (%) and species richness of ferns, (<b>b</b>) mortality rate (%) and number of individuals of ferns, and (<b>c</b>) species richness and number of individuals of ferns. The respective equations and R<sup>2</sup> values are displayed within each panel. In panels (<b>a</b>,<b>b</b>), the dots represent the percentage of mortality at specific numbers of species (<b>a</b>) or individuals (<b>b</b>). In panel (<b>c</b>), the dots represent the mean species richness and number of individuals per elevation. Only seven data points are visible in panel (<b>b</b>) due to overlapping values at different elevations. The asterisks next to the R<sup>2</sup> value denote the level of statistical significance: ** significant (<span class="html-italic">p</span> ≤ 0.01), * moderately significant (<span class="html-italic">p</span> ≤ 0.05).</p> Full article ">Figure 3
<p>Mortality rate (%) of ferns by size class (cm) for 2009–2010 (darker bars) and 2010–2011 (lighter bars), categorized by leaf length: 10–30 cm, 30–50 cm, 50–70 cm, 70–100 cm, and >100 cm.</p> Full article ">
Open AccessCommunication
Barley Seed Germination and Seedling Growth Responses to Polyethylene Glycol (PEG)-Induced Drought Stress
by
Matthew Davidson-Willis, Guoqi Wen, Bahram Samanfar and Raja Khanal
Int. J. Plant Biol. 2024, 15(4), 1353-1359; https://doi.org/10.3390/ijpb15040093 - 13 Dec 2024
Abstract
Drought is becoming more prevalent and negatively affects the growth and development of barley. To explore the genetic variation in barley under drought stress, ten breeding genotypes were tested using polyethylene glycol-6000 to simulate drought conditions. We observed that drought stress significantly affected
[...] Read more.
Drought is becoming more prevalent and negatively affects the growth and development of barley. To explore the genetic variation in barley under drought stress, ten breeding genotypes were tested using polyethylene glycol-6000 to simulate drought conditions. We observed that drought stress significantly affected germination-related traits, depending on the specific genotypes. Some parameters, such as root length, reduced by up to 85% under drought conditions compared to the control. Overall, considering the barley growth performance, the drought tolerance index was an ideal criterion for selecting drought-tolerant genotypes, as it well characterized the gradient responses of barley genotypes to drought stress. Based on this indicator, genotype OB1878-ON-50 is recommended as a significant germplasm resource for low-precipitation regions.
Full article
(This article belongs to the Section Plant Reproduction)
►▼
Show Figures
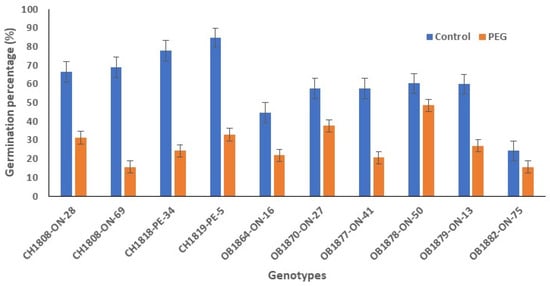
Figure 1
Figure 1
<p>Mean and standard error of germination percent (%) in no stress and PEG-induced drought stress condition.</p> Full article ">Figure 2
<p>Mean and standard error of root length (mm) in no stress and PEG-induced drought stress condition.</p> Full article ">Figure 3
<p>Mean and standard error of shoot length (mm) in no stress and PEG-induced drought stress condition.</p> Full article ">Figure 4
<p>Mean and standard error of number of roots in no stress and PEG-induced drought stress condition.</p> Full article ">
Open AccessArticle
Biologically Active Compounds in Tomato Fruits Under the Application of Water–Ethanol Spirulina, Dunaliella and Chlorella Microalgae Extracts on Plants’ Leaves
by
Ingrīda Augšpole, Irina Sivicka, Kaspars Kampuss, Pāvels Semjonovs and Imants Missa
Int. J. Plant Biol. 2024, 15(4), 1338-1352; https://doi.org/10.3390/ijpb15040092 - 13 Dec 2024
Abstract
This study aimed to detect an impact of water–ethanol extracts of different microalgae species—Spirulina platensis, Dunaliella salina and Chlorella vulgaris—on the accumulation of bioactive compounds in tomatoes. A treatment with the corresponding ethanol solution and pure drinking water was used
[...] Read more.
This study aimed to detect an impact of water–ethanol extracts of different microalgae species—Spirulina platensis, Dunaliella salina and Chlorella vulgaris—on the accumulation of bioactive compounds in tomatoes. A treatment with the corresponding ethanol solution and pure drinking water was used as a control. Tomato cultivar ‘Belle’ F1 (Enza Zaden) was grown in a polycarbonate greenhouse, in 25 L pots filled with a peat substrate (pH KCl 5.5). The plants were sprayed weekly from germination until the start of harvesting, in total nine times. Fruits were analysed at the stage of full ripeness. Bioactive compounds’ contents such as vitamin C, titratable acidity, pH value, β-carotene, lycopene, anthocyanin, total phenols as well as total soluble solids and dry matter were analysed, and the connection between fruit mass and the taste index was determined. The influence of the tested extracts on the bioactive compounds and quality parameters of tomatoes was different, but no significant differences for most of the analysed active compounds were found, with the exception of total phenols (from 137.59 ± 1.34 to 166.93 ± 2.01 mg 100 g−1) and total soluble solids (from 3.93 ± 0.12 to 4.4 ± 0.18 °Brix). In the next research, a more detailed study about the influence of the ethanol concentration on changes in biologically active compounds should be provided.
Full article
(This article belongs to the Section Plant Biochemistry and Genetics)
►▼
Show Figures
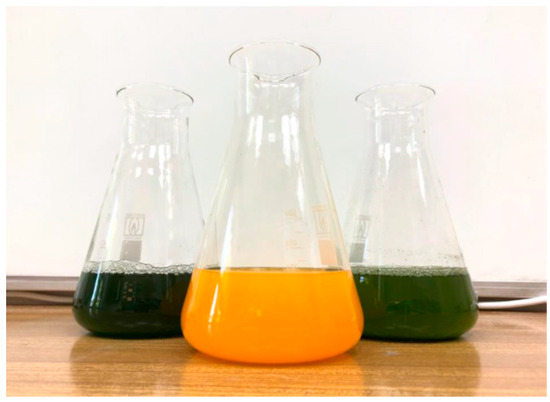
Figure 1
Figure 1
<p>Water–ethanol microalgae-based extracts prepared for the trial: <span class="html-italic">Spirulina platensis</span> (on the <b>left</b>), <span class="html-italic">Dunaliella salina</span> (in the <b>centre</b>) and <span class="html-italic">Chlorella vulgaris</span> (on the <b>right</b>).</p> Full article ">Figure 2
<p>Maturity stages of tomato: from mature green (<b>right</b>) to fully ripe (<b>left</b>), trial photo.</p> Full article ">Figure 3
<p>General scheme of study.</p> Full article ">
Open AccessArticle
Environmental Suitability Predictions for the Distribution and Potential Cultivation of Artemisia afra in South Africa
by
Motiki M. Mofokeng, Harold L. Weepener, Hintsa T. Araya, Stephen O. Amoo, Nadia A. Araya, Samkelisiwe Hlophe-Ginindza and Christian P. du Plooy
Int. J. Plant Biol. 2024, 15(4), 1321-1337; https://doi.org/10.3390/ijpb15040091 - 12 Dec 2024
Abstract
Cultivation is advocated as a solution for the sustainable exploitation of medicinal plants. Understanding environmental factors influencing plant species distribution will eliminate the indiscriminate introduction of medicinal plants to inappropriate cultivation regions. This study investigated environmental conditions for the distribution of Artemisia afra
[...] Read more.
Cultivation is advocated as a solution for the sustainable exploitation of medicinal plants. Understanding environmental factors influencing plant species distribution will eliminate the indiscriminate introduction of medicinal plants to inappropriate cultivation regions. This study investigated environmental conditions for the distribution of Artemisia afra and mapped out potential areas for its cultivation in South Africa. Soil samples were collected for analysis in the Free State Province in South Africa. To identify suitable environmental conditions for the natural distribution of A. afra, the South African National Botanical Institute database and physically collected Global Positioning System points were used in a maximum entropy model. Monthly long-term average interpolated weather surfaces were used to estimate the effect of climate change on future climate suitability for A. afra distribution. Sixty-one percent of soil samples from different A. afra populations were clay loam soils with a slightly acidic to neutral pH. The carbon source utilization, Shannon Weaver Index, and species richness were positively correlated with one group of fourteen soil samples, and species evenness was positively correlated with the second group, consisting of four samples. Climate change will only affect the distribution of A. afra in the very long term. The current study provides critical information for identifying suitable cultivation areas for A. afra while supporting conservation efforts from an ecological point of view.
Full article
(This article belongs to the Section Plant Ecology and Biodiversity)
►▼
Show Figures
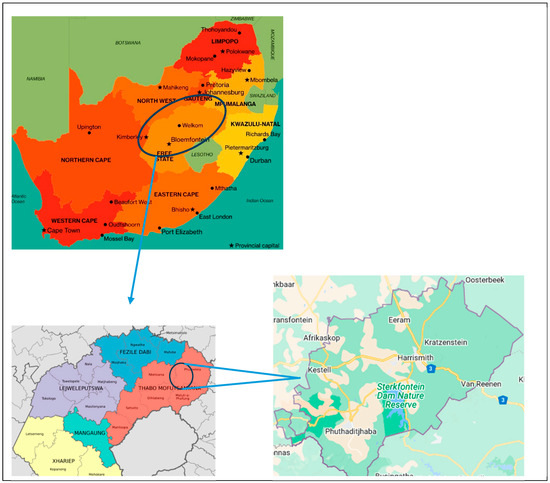
Figure 1
Figure 1
<p>Map of South Africa, Free State Province, and Maluti-A-Phofung municipality where soil samples for different <span class="html-italic">Artemisia afra</span> populations were collected.</p> Full article ">Figure 2
<p>The principal component analysis (<b>A</b>) and the dendogram (<b>B</b>) explaining the contributing factors to the variation between soil samples collected from different <span class="html-italic">Artemisia afra</span> populations. The different colors in A indicate major groupings of the soil samples as analyzed using principal component analysis and the dendogram. Green grouping: S3S2SUB (Pp3 SP2 subpopulation 3, sample 2 subsoil), S3S2TOP (Pp3 SP2 top—population 3, sample 2 topsoil), S2S2TOP (Pp2 SP2 top—population 2, sample 2 topsoil), S3S1TOP (Pp3 SP1 top—population 3, sample 1 topsoil); Amber grouping: S1S2SUB (Pp1 SP2 sub—population 1, sample 2 subsoil), S1S2TOP (Pp1 SP2 top—population 1, sample 2 topsoil), S1S1SUB (Pp1 SP1 sub—population 1, sample 1 subsoil), S3S3SUB (Pp3 SP3 top—population 3), S1S3SUB (Pp1 SP3 sub—population 1, sample 3 subsoil), S2S1TOP (Pp2 SP1 top—population 2, sample 1 topsoil), S2S3TOP (Pp2 SP3 top—population 2, sample 3 topsoil), S2S3SUB (Pp2 SP3 sub—population 2, sample 3 subsoil), S2S2SUB (Pp2 SP2 sub—population 2, sample 2 subsoil), S3S3TOP (Pp3 SP3 top—population 3, sample 3 topsoil), S3S1SUB (Pp3 SP1 sub—population 3, sample 1 subsoil), S1S1TOP (Pp1 SP1 top—population 1, sample 1 topsoil), S1S3TOP (Pp1 SP3 top—population 1, sample 3 topsoil), S2S1SUB (Pp2 SP1 sub—population 2, sample 1 subsoil). In red letters: carbohydrates, carboxylic acids, amines, amino acids, polymers, average well color development, E (evenness), H (Shannon weaver index), S (richness).</p> Full article ">Figure 3
<p>A map of South Africa showing the natural distribution of <span class="html-italic">Artemisia afra</span> as per the SANBI records (green circles), the physically collected coordinates (red circles) and the environmental suitability predictions for the growth of <span class="html-italic">A. afra</span> (<b>A</b>), and the prediction of the future distribution of <span class="html-italic">A. afra</span> from 2021 to 2050 (<b>B</b>) and from 2051 to 2080 (<b>C</b>).</p> Full article ">Figure 4
<p>The performance of the MaxEnt model using the computed receiver operating characteristics with a specific focus on the area under the curve (AUC).</p> Full article ">
Open AccessArticle
Sterol Profile in Leaves of Spring Oats (Avena sativa L.) Under Conditions of the Cryolithozone
by
Vasiliy V. Nokhsorov, Valentina E. Sofronova, Igor V. Sleptsov, Svetlana V. Senik, Lidia V. Petrova and Klim A. Petrov
Int. J. Plant Biol. 2024, 15(4), 1304-1320; https://doi.org/10.3390/ijpb15040090 - 12 Dec 2024
Abstract
Plant sterols (STs) are essential for the regulation of fluidity and permeability of cell membranes, which have a wide structural diversity. The dynamics of changes in sterol molecular species in leaves of a valuable cereal crop, spring oat (Avena sativa L.), as
[...] Read more.
Plant sterols (STs) are essential for the regulation of fluidity and permeability of cell membranes, which have a wide structural diversity. The dynamics of changes in sterol molecular species in leaves of a valuable cereal crop, spring oat (Avena sativa L.), as a function of different sowing dates were studied. In particular, 11 molecular species of sterols (STs) and triterpenoids in A. sativa leaves were identified by GC-MS. Triterpenoids Ψ-taraxasterol, cyclolaudenol, and betulin were identified in A. sativa leaves for the first time, which may be related to adaptation to extreme climatic conditions of the cryolithozone. The dynamics of STs and triterpenoids changes were revealed during growth and development of the standard term and late summer sowing term during A. sativa hardening to low ambient temperatures. The ratio of β-sitosterol to campesterol was found to increase in response to low positive air temperatures, while the ratio of stigmasterol to β-sitosterol remained constant from mid-September to the end of October. Overall, leaves of standard-seeded A. sativa plants maintained higher levels of absolute STs and triterpenoids by 1.9-fold than leaves of late-seeded A. sativa plants. It is suggested that the ability of A. sativa plants to synthesize β-sitosterol and stigmasterol may be part of an evolutionary adaptation process to cope with wide temperature fluctuations and to maintain important membrane-bound metabolic processes.
Full article
(This article belongs to the Section Plant Physiology)
►▼
Show Figures
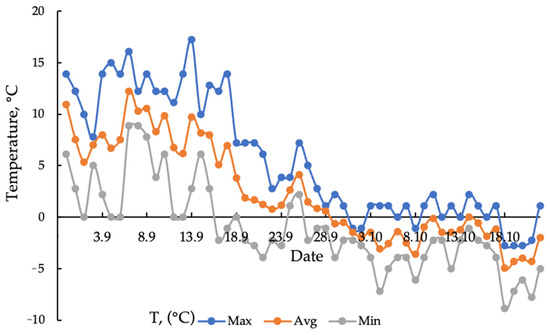
Figure 1
Figure 1
<p>The air temperature course during the period of experiments.</p> Full article ">Figure 2
<p><span class="html-italic">A. sativa</span> cultivar Vilensky, (<b>A</b>) standard sowing date (photo taken on 5 July) and (<b>B</b>) late sowing date (photo taken on 18 October).</p> Full article ">Figure 3
<p>Representative GC-MS chromatogram of silylated free sterols and triterpens from <span class="html-italic">A. sativa</span> (4 July, leaves of the first sowing). Peaks: cholesterol (1), campesterol (2), campestanol (3), stigmasterol (4), β-sitosterol (5), sitostanol (6), Δ<sup>5</sup>-avenasterol (7), Δ<sup>7</sup>-avenasterol (8), Ψ-taraxasterol (9), cyclolaudenol (10), betulin (11).</p> Full article ">Figure 4
<p>Mass spectra and structural formulas of the first identified triterpenoid compounds (betulin-TMS ether (<b>a</b>), cyclolaudenol-TMS ether (<b>b</b>), Ψ-taraxasterol-TMS ether (<b>c</b>)) in spring oat (<span class="html-italic">A. sativa</span>) leaves.</p> Full article ">Figure 5
<p>Hierarchical clustering heatmap of STs and triterpenoids in the leaves of <span class="html-italic">A. sativa</span> (I sowing date, 3 June) performed on the normalized data (using the Euclidean distance matrix with Ward’s method). Colors represent different concentrations indicated by the color bar.</p> Full article ">Figure 6
<p>Hierarchical clustering heatmap of STs and triterpenoids in leaves of <span class="html-italic">A. sativa</span> (II sowing date, 27 July) performed on the normalized data (using the Euclidean distance matrix with Ward’s method). Colors represent different concentrations indicated by the color bar.</p> Full article ">Figure 7
<p>Dynamics of sterol C22-desaturase enzymes (<b>a</b>) and sterol molecular species ratio and activity of sterol methyltransferase (SMT) (<b>b</b>) in leaves of <span class="html-italic">A. sativa</span>. Means ± SDs. The experiments were performed with at least three biological replicates (<span class="html-italic">n</span> = 3); the different letters indicate significant differences (<span class="html-italic">p</span> ≤ 0.05).</p> Full article ">Figure 8
<p>The graph of estimations of PCA obtained on the basis of the analysis of the main components of the sterol profile of <span class="html-italic">A. sativa</span> leaves of I (blue arrow) and II crops (green arrow) in different phenological phases.</p> Full article ">
Highly Accessed Articles
Latest Books
E-Mail Alert
News
Topics
Topic in
Biology, Diversity, IJPB, Plants, Taxonomy, Ecologies, Sustainability
Diversity and Conservation of Flora in Africa
Topic Editors: Shengwei Wang, Veronicah Mutele Ngumbau, Yadong Zhou, Desalegn Chala, Guangwan HuDeadline: 31 March 2025
Topic in
Agronomy, Diversity, Forests, IJPB, Plants
Plant Invasion
Topic Editors: Bruce Osborne, Panayiotis G. DimitrakopoulosDeadline: 31 July 2025
Topic in
Diversity, Forests, Genes, IJPB, Plants
Plant Chloroplast Genome and Evolution
Topic Editors: Chao Shi, Lassaâd Belbahri, Shuo WangDeadline: 31 August 2025
Topic in
Agriculture, Agronomy, Crops, Microorganisms, Plants, IJPB, Soil Systems
Microbe-Induced Abiotic Stress Alleviation in Plants
Topic Editors: Ying Ma, Christopher RensingDeadline: 31 October 2025
Conferences
Special Issues
Special Issue in
IJPB
The Role of Plant Growth-Promoting Bacteria in Enhancing Plant Health and Growth
Guest Editors: Glacy da Silva, Pedro Henrique Riboldi MonteiroDeadline: 28 February 2025
Special Issue in
IJPB
Ecophysiological Responses of Tropical Plants to Climate Change
Guest Editor: Geraldo Rogério Faustini CuzzuolDeadline: 31 March 2025
Special Issue in
IJPB
Plant Resistance to Insects
Guest Editor: Horacio Salomón Ballina-GómezDeadline: 6 June 2025
Special Issue in
IJPB
Movement Patterns in Climbing Plants
Guest Editors: Silvia Guerra, Bianca Bonato, Sara Avesani, Laura RavazzoloDeadline: 1 September 2025