The Icinga Stack
It takes just a few steps to be successful in all the different areas of monitoring.
Why Monitoring?
Monitoring is important to build a strong and global evidence base for targeted actions. You establish it through systematic and routine collection and analysis of the data of your systems. Timely error identification and smart error prevention increase your IT availability and stability.
Icinga Stack Explained
Across your entire infrastructure, Icinga gives you the power to watch any host and any application. It’s for detailed analysis as well as for quick actions. It’s for drawing conclusions and gaining confidence.
The 6-in-1 Stack
The Icinga stack spans six areas to cover all aspects of monitoring your entire infrastructure.
Your Infrastructure
Your infrastructure produces a constant stream of data about its health and performance. Your task is to work with that data to know the state of everything at all times and keeping your systems up and running.
Connect and Observe
Connect your whole landscape with the Icinga Stack and get full visibility. Monitor your data center as well as your private, public, or hybrid clouds – all in one monitoring system.
Visualize and Understand
Collect, store and visualize metrics on the way. Create business processes and reports for different aspects to discover relations and patterns. Filter servers/VMs to get dedicated insights and build your own customized dashboards.
Get Notified
Notifications guarantee a timely recognition of critical operating states. Icinga notifies you through any channel you want. Email, Slack, PagerDuty or else: Alerts pave the way to a wholesome incident management and recovery process.
Automate
The larger the number of objects to be checked the more effort is required. Icinga is built to monitor thousands of servers and services, and masters ways to automate all areas of it.


Integrations
Icinga collects and sends data from and to many of your existing DevOps tools, enabling you to create a tailored monitoring solution that fits your needs.
Icinga for Enterprises
The Icinga Stack is an enterprise-ready monitoring solution that integrates easily. Combine high availability clusters with a distributed setup for massive amounts of data and boundless freedom.
Single Icinga
One single Icinga instance can already deal with a large amount of servers. Icinga comes with a built-in cluster mechanism that spreads the workload of your monitoring checks across multiple servers.
High Availability
Connect two Icinga nodes into one zone to increase reliability. With this high available Icinga setup you are well prepared for failures.
Workload Distribution
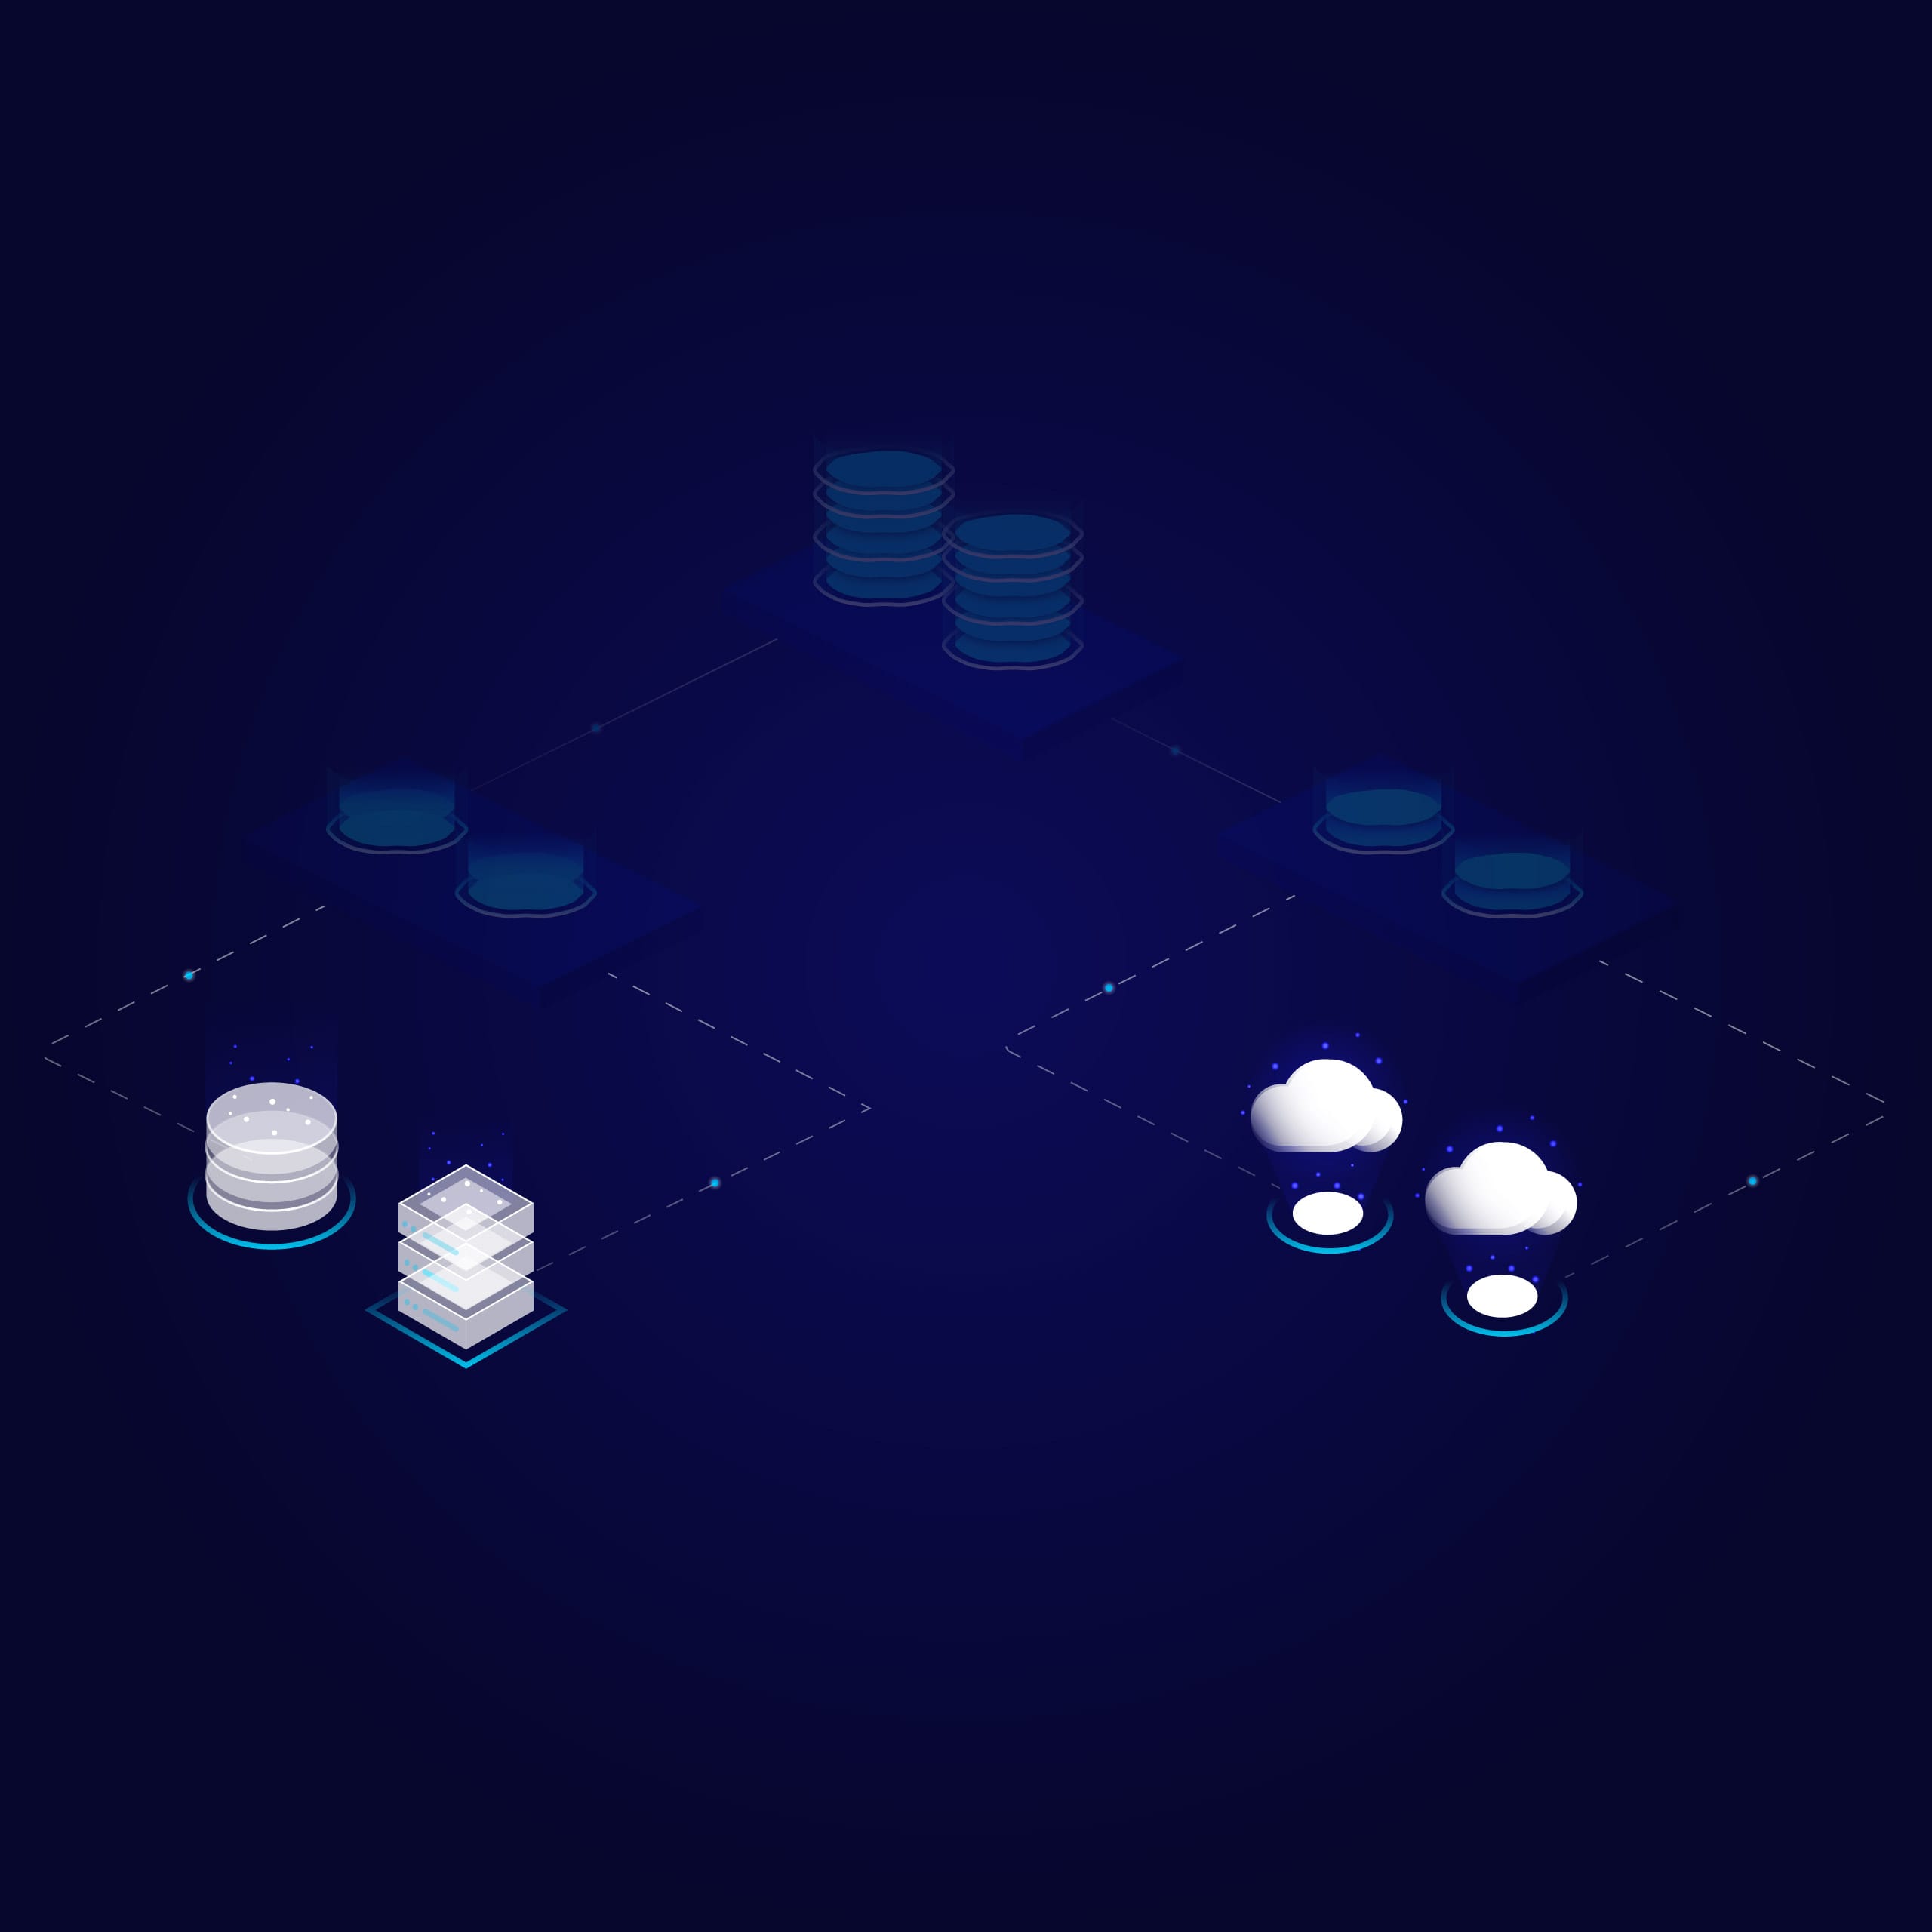
Manage massive amounts of monitoring objects by connecting additional nodes to distribute the load. We call them Satellites.
Large Infrastructure
Monitor thousands of machines of your large, heterogeneous and distributed environment. Collect data from specific network segments and classify your monitoring.
Icinga Agents
Use Icinga as an Agent on your machines to monitor local resources. The Icinga Agent goes easy on resources and reports results automatically.







These Brands Trust Us
We are proud to have gained the trust of many customers and users around the globe. Over the last years, they have made Icinga part of their infrastructure.
Do more with Icinga
Bring the speed, scale, and relevance of Icinga to all areas of your business.


Icinga Stack Explained


Infrastructure Monitoring
Learn more


Monitoring Automation
Monitor massive amounts of data.
Learn more


Cloud Monitoring
Learn more


Metrics & Logs
Get the context and recognize trends.
Learn more


Analytics
Learn more


Notifications
Learn more


Subscribe to our Newsletter
A monthly digest of the latest Icinga news, releases, articles and community topics.


