My name is Alexander. I am a Data Scientist based out of Berkeley, CA. My industry experience includes Wine.com, NASA Ames Research Center, teaching Data Science at General Assembly, and consulting. What excites me most about Data Science is leveraging machine learning and big data tech to build deployable, data-driven products that bring tangible value to people's lives.
Below are some personal projects that I've worked on in the past. More to come soon!
NOTE: These projects are in chronological order, so newer projects appear first and older projects appear towards the bottom.
- Runs Classification and Regression data through an ETL pipeline
- Parallelizable model building tool trains, scores agaisnt several metrics, and stores results
- Model's metrics socres are displayed on learning curves.
- The interactive dashboard allows the user to select among several different models for both Classiciation and Regression.
This pipeline was tested on a 8 core laptop. The chart shows that speed increases are achieved as the number of cores increases. The limiting factor for the performance boost being, of course, the run time of a single model's trian time and the number of cores.
- The front end was built using a Python library called Dash
- The Scalable model building tool was built by me and can be found here
- The machine learning models are taken from Scikit-Learn
- The pipeline is being deployed on AWS EC2
Check out the Live Dashboard Here
Check out the Dash Script
This is a prototype analytical dashboard for solar energy consumers.
This is our scenario: imagine that one of Google's locations (there are many in the USA) has 4 buildings, each with solar panel installations. They want to keep track of 3 very importannt trends:
- Energy Consumption by each building
- Energy Production by each building
- Energy cost/profit by each building
The numbers will be tracked monthly. The cost is the energy bill for each building, so that means that the building has consumed more energy than its solar panels produced. The profit is the money made by selling excess energy back to the energy grid. In the end, we will have one years worth of data for each building.
Check out the LIVE DASHBOARD HERE
Check out the DASH SCRIPT
Check out the JUPYTER NOTEBOOK where the models were built.
In this notebook, I create a content based recommender for New York Times articles. This recommender is an example of a very simple data product. I follow the same proceedure outlined in this Medium article.
However, we will not be recommending tags. Instead we'll be recommending new articles that a user should read based on the article that they are currently reading.
Check out the Jupyter Notebook
The focus of this tool is to make the machine learning model building and validation workflow very fast and easy.
This is done by abstracting away all the cross validation and plotting functionality with a reusable class.
This class also allows us to train and score these models in parallel.
It also has built in learning curve plotting functionality to assess model performance.
As a case study, we use a Cellular Service Provider data set where we are tasked with building a model that can identify users who are predicted to churn. Naturally in subscription based services, these data sets are unbalanced since most users don't cancel their subscription on any given month.
Let's see how this tool can help us achieve our goal!
Check out the Jupyter Notebook
# create model
rfc = RandomForestClassifier(n_estimators=100,
                             criterion='entropy',
                             n_jobs=-1)
# initialize ml tool
cv_rfc = cross_validation(rfc,
                      X_churn,
                      Y_churn,
                      average='binary',
                      init_chunk_size=100,
                      chunk_spacings=100,
                      n_splits=3)

# call method for model training
cv_rfc.train_for_learning_curve()

# call method for ploting model results
cv_rfc.plot_learning_curve(image_name="Learning_Curve_Plot_RF", save_image=True)
Based on the research of the authors of this whitepaper, I trained a Convolutional Neural Network to classify the physical activities of users wearing wrist devices that contain sensors like an accelerometer and gyroscope. In order words, the CNN was trained on time-series data and not images and performed quite well.
Check out the code in this Jupyter Notebook.

I engineered a data product that allows the user to search for unassuming relationships bewteen entities in New York Times articles. The articles were scraped from the NYT api. I used Sklearn's implementation of Latent Dirichlet Allocation for Topic Modeling and the NLTK library for Entity Recognition. This data product is an excellent example of how Machine Learning and Natural Language Processing can be used to build an application to serve the needs of an end user.
I wrote three object oriented classes for this project:
topic_model_distributions has methods to fit Latent Dirichlet Allocation (LDA) for topic modeling and methods to get certain distributions that are necessary to visualize the LDA results using the pyLDAvis data viz tool
named_entity_extraction has methods to identify and extract named entities, the like that we observed in the police shooting article. It also has methods that count the number of entity appearances in each topic and the number of entity apperances in each article.
entity_topic_occurances has methods to identify co-occurances of entities within the same topic and within the same document.
Check out the code in this Jupyter Notebook.

I designed and coded deep learning networks using the Theano neural-network library in Python. I've used deep learning to build image classifiers, predict the appearnce of sunspots 6 months into the future, and to better understand how convex and non-convex optimization algorithms work, including gradient descent and particle swarm.
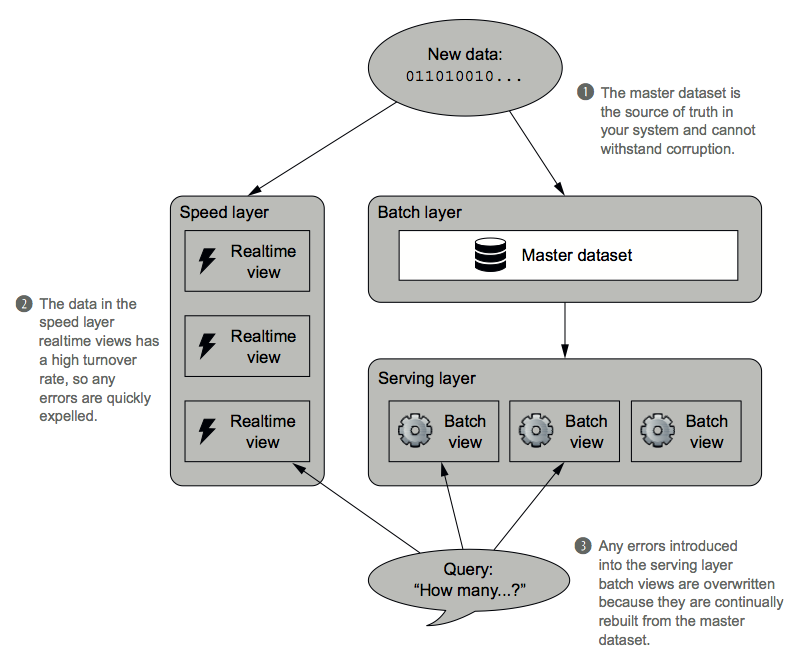
I've used Spark, SparkSQL, SparkStreaming, Kafka, HBase, and Lambda Architecture to engineer an ETL pipeline. This pipeline accepts unstructured data, then Kafka feeds identical copies of the data into a batch and speed layer. This ensure that the user can have real-time, up-to-the second data for their SQL queries. This project brought together so many different big data technologies and gave me a valuable understanding of how to design a robust data infrastructure.

The goal of this notebook is to train a classifier to predict which activities users are engaging in based on sensor data collected from devices attached to all four limbs and the torso. This will be accomplished by feature engineering the sensor data and training machine learning classifiers, SVM and a Deep Learning Network.

Using Sklearn's machine learning library and NLTK's NLP library, I trained several models to classify and predict user sentiment on IMDB movie reviews. After exploring models and text vectorizations, I created a machine learning ensemble using Logistic Regression, SVM, and Naive Bayes, and vectorized the text into a bag-of-words representation. I then experimented on how to improve on this work by using Word2Vec neural network.
For this project, I build a web scraper for Twitter data and scrape all the tweets that Galvanize has ever sent out to its followers. The unstructured data is stored in a local MongoDB database. The data is then inspected, cleaned, and structured for analysis.
I explore the metrics of accuracy, precision, and recall in rich detail in order to understand how unbalanced classes affect machine learning prediction of customer churn. I explore 3 ways of balancing classes, discussing the pros and cons of each appraoch. I then use the best performing model's predictive probabilities to identify customers that are most at risk for churn. Finally, I design an experiment that maximizes profits and minimizes cost for a marketing campiagn of reducing churn.
Please feel free to contact me about my work or any exciting opportunities. My email is alexanderbarriga03@gmail.com