在分布式场景下,日志的收集和检索变得额外困难。本文将利用go的协程实现高吞吐量的分布式日志收集,结合etcd做到配置热更新、利用kafka异步发送日志内容到elasticSearch中。实现日志内容的类实时刷新,方便分布式系统的查看和检索日志内容。
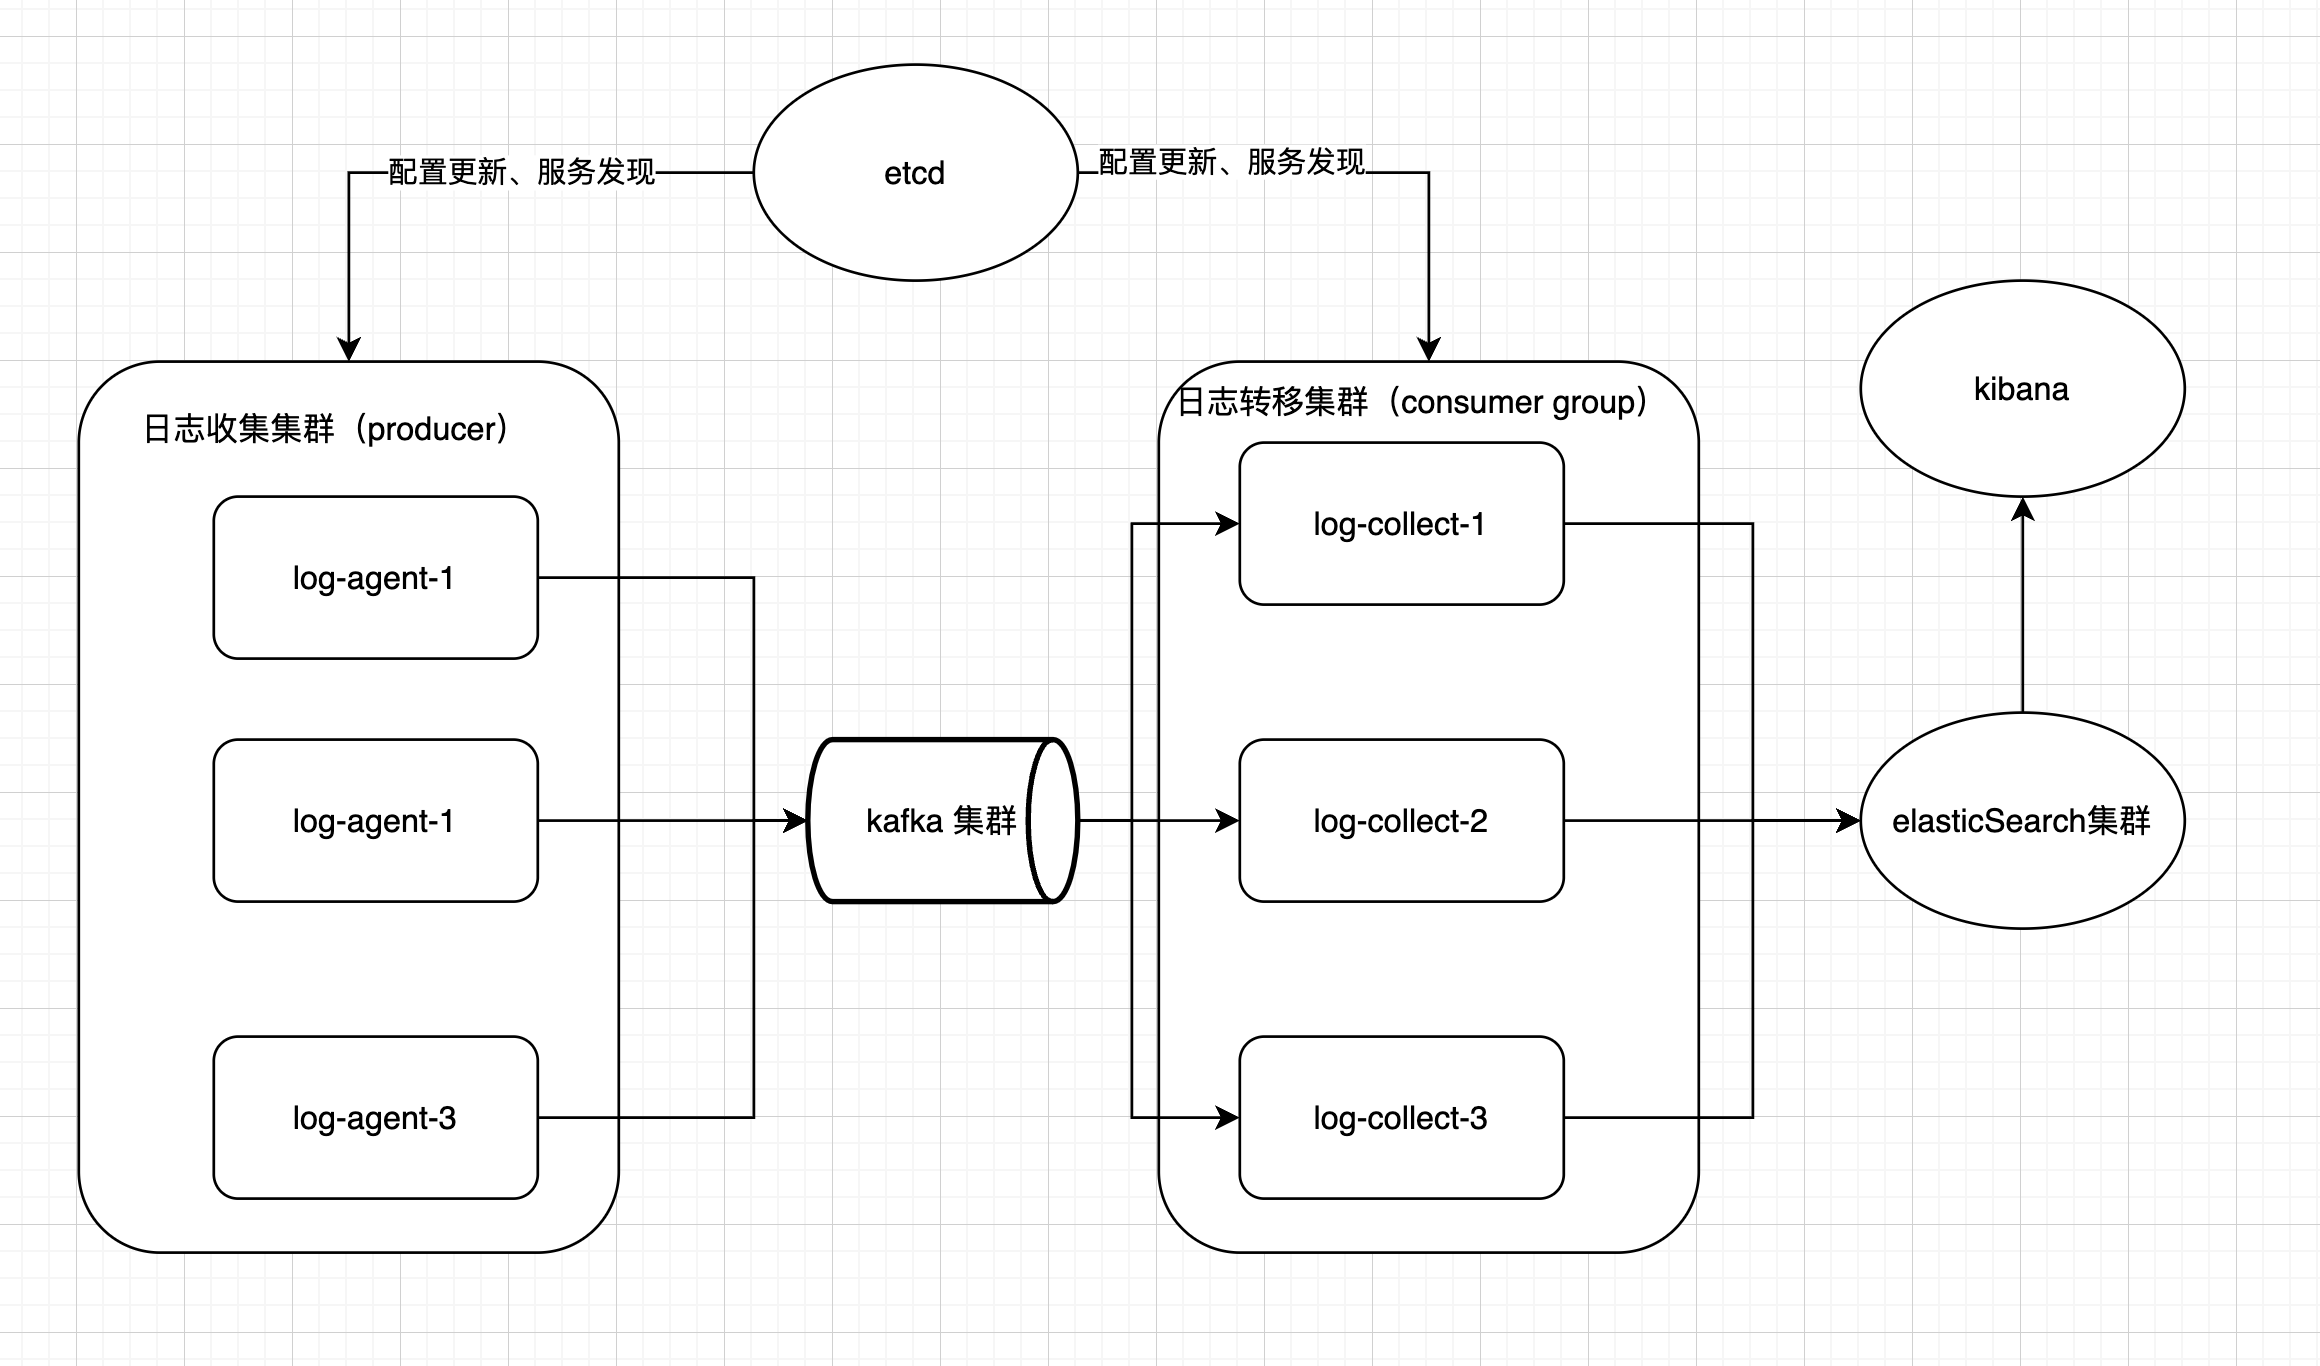
本系统搭建涉及两个独立程序。log-collect和logtransfer,以kafka作为两者之间的消息队列。其中log-collect作为输入端用于多机日志收集。logtransfer作为输出端,将kafka中的内容输出到elasticSearch。涉及第三方组件如列表所示:
- etcd:用于配置更新
- kafka:log-collect和logtranser之间进行异步通信
- elasticSearch:用于日志存储
- kibana:提供数据展示和搜索的前台页面
系统整体框架图如下图所示:
本系统搭建所需依赖:docker、etcd、kafka、elasticsearch、kibana。 首先,如果你的机器上没有docker环境,需要先安装docker。 docker官网
在配置完docker环境后,可以采用docker compose up命令执行yml文件,进行一键拉取并运行相关容器。
services:
  kafka:
    image: bitnami/kafka:latest
    container_name: kafka
    restart: always
    ports:
      - "9092:9092"
      - "9093:9093"  # KRaft 选举端口
    environment:
      - ALLOW_PLAINTEXT_LISTENER=yes
      - KAFKA_CFG_NODE_ID=1
      - KAFKA_CFG_PROCESS_ROLES=broker,controller
      - KAFKA_CFG_CONTROLLER_QUORUM_VOTERS=1@localhost:9093
      - KAFKA_CFG_LISTENERS=PLAINTEXT://:9092,CONTROLLER://:9093
      - KAFKA_CFG_ADVERTISED_LISTENERS=PLAINTEXT://localhost:9092
      - KAFKA_CFG_LISTENER_SECURITY_PROTOCOL_MAP=PLAINTEXT:PLAINTEXT,CONTROLLER:PLAINTEXT
      - KAFKA_CFG_INTER_BROKER_LISTENER_NAME=PLAINTEXT
      - KAFKA_CFG_CONTROLLER_LISTENER_NAMES=CONTROLLER
  etcd:
    image: bitnami/etcd:3
    container_name: etcd
    restart: unless-stopped
    ports:
      - "2379:2379"
      - "2380:2380"
    environment:
      - ALLOW_NONE_AUTHENTICATION=yes
      - ETCD_ADVERTISE_CLIENT_URLS=http://0.0.0.0:2379
      - ETCD_LISTEN_CLIENT_URLS=http://0.0.0.0:2379
      - ETCD_LISTEN_PEER_URLS=http://0.0.0.0:2380
      - ETCD_INITIAL_ADVERTISE_PEER_URLS=http://0.0.0.0:2380
      - ETCD_INITIAL_CLUSTER=default=http://0.0.0.0:2380
      - ETCD_INITIAL_CLUSTER_TOKEN=etcd-cluster
      - ETCD_INITIAL_CLUSTER_STATE=new
    volumes:
      - etcd-data:/etcd-data
  elasticsearch:
    image: docker.elastic.co/elasticsearch/elasticsearch:8.6.2
    container_name: elasticsearch
    environment:
      - xpack.security.enabled=false
      - discovery.type=single-node
      - ES_JAVA_OPTS=-Xms512m -Xmx512m
    ulimits:
      memlock:
        soft: -1
        hard: -1
    volumes:
      - es_data:/usr/share/elasticsearch/data
    networks:
      - esnet
    ports:
      - 9200:9200
      - 9300:9300
    restart: always

  kibana:
    image: docker.elastic.co/kibana/kibana:8.6.2
    container_name: kibana
    environment:
      - ELASTICSEARCH_URL=http://elasticsearch:9200
    ports:
      - 5601:5601
    networks:
      - esnet
    restart: always
volumes:
  etcd-data:
  es_data:
    driver: local
  kafka_data:
    driver: local
networks:
  esnet:
    driver: bridge
如果一切正常,即可在docker destop中看到

- etcd:
输入:
etcdctl --endpoints=http://127.0.0.1:2379 endpoint health如果正常,你将看到:127.0.0.1:2379 is healthy: successfully committed proposal - kafka:
进入kafka容器:
docker exec -it kafka /bin/bash进入bin目录:/opt/bitnami/kafka/bin执行producer:kafka-console-producer.sh --bootstraprver 127.0.0.1:9092 --topic test_topic如果正常,你将进入到控制台内,可输入生产者消息。 - elasticsearch:
输入:
curl -X GET "http://localhost:9200/"如果正常,你将看到:
{
  "name" : "f92a87d6387e",
  "cluster_name" : "docker-cluster",
  "cluster_uuid" : "e-cjW93ERSqlJJ0qFLWclA",
  "version" : {
    "number" : "8.6.2",
    "build_flavor" : "default",
    "build_type" : "docker",
    "build_hash" : "2d58d0f136141f03239816a4e360a8d17b6d8f29",
    "build_date" : "2023-02-13T09:35:20.314882762Z",
    "build_snapshot" : false,
    "lucene_version" : "9.4.2",
    "minimum_wire_compatibility_version" : "7.17.0",
    "minimum_index_compatibility_version" : "7.0.0"
  },
  "tagline" : "You Know, for Search"
}
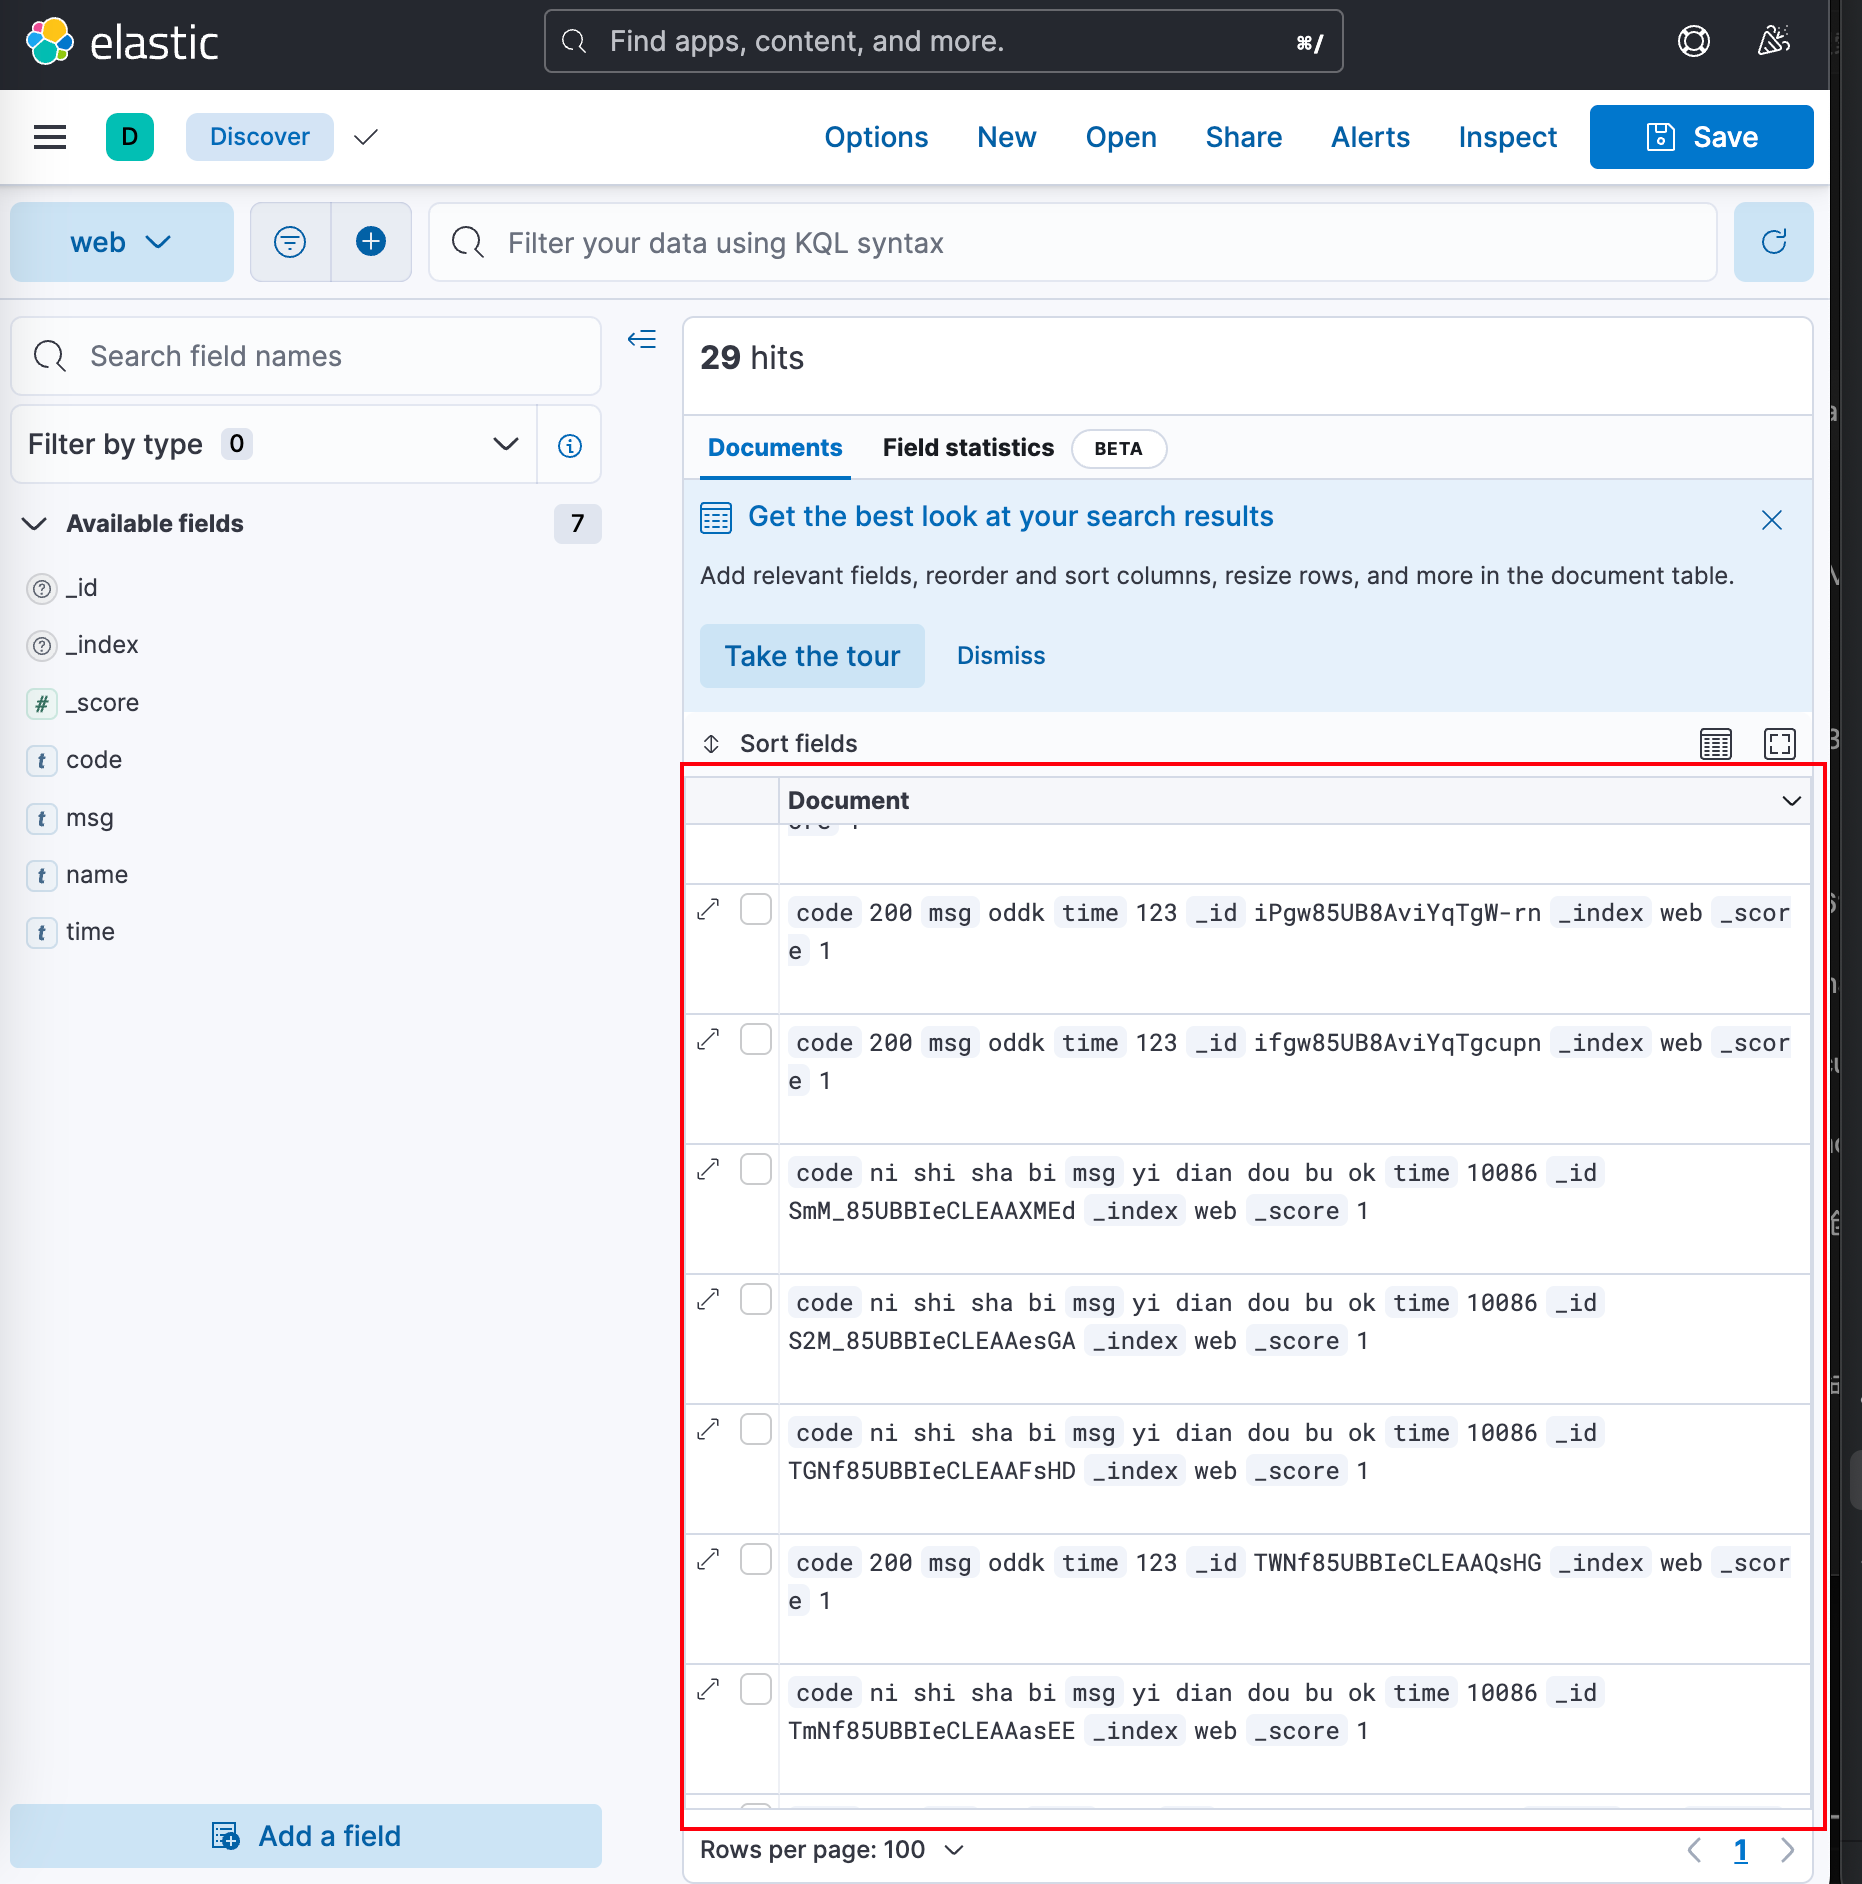
- kibana: 浏览器上访问kibana页面 如果正常,你将进入到kibana的页面
在搭建log-agent之前,我们首先来画个图来分析下log-agent服务是怎么工作的,然后我们针对图中的核心要点逐一分析。
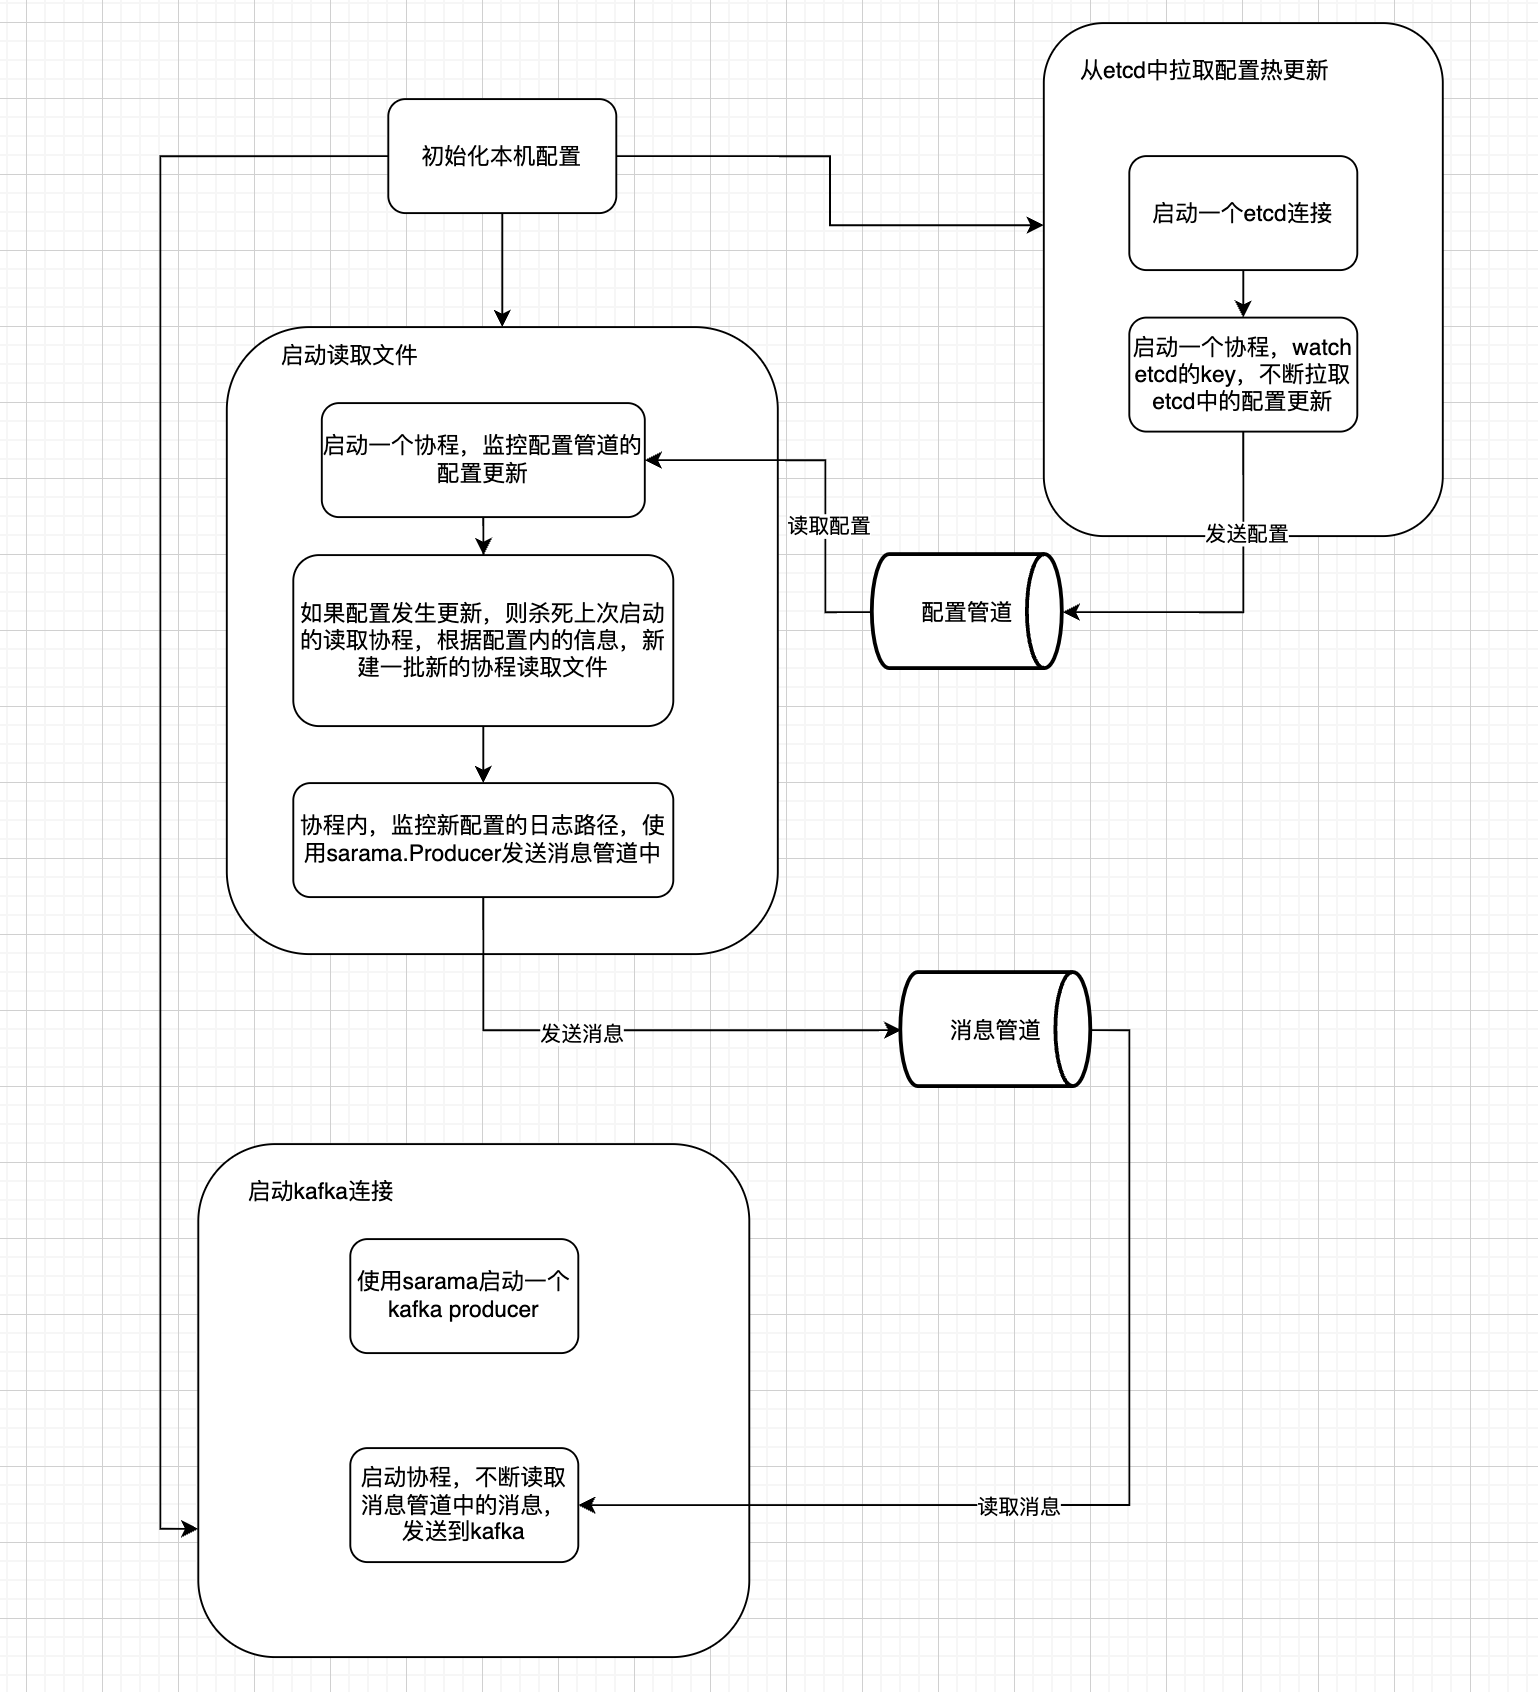
在这一步中,主要任务是利用sarama工具包,去启动一个kafka producer去建立和kafka的连接,启动一个go的协程(当然可以启多个,这步可拓展)去不断监听msgChan的消息管道,如果有消息,则读取并发送到kafka消息队列中。
// init kafka client
func Init(addresses []string, chanSize int64) error {
	fmt.Println("Kafka Client")
	saramaConfig := sarama.NewConfig()
	saramaConfig.Producer.RequiredAcks = sarama.WaitForAll          // wait for all partition
	saramaConfig.Producer.Partitioner = sarama.NewRandomPartitioner // random partition
	saramaConfig.Producer.Return.Successes = true

	// new producer for send message to kafka
	client, err := sarama.NewSyncProducer(addresses, saramaConfig)
	if err != nil {
		logrus.Error("init kafka failed.", err.Error())
		return err
	}

	//init msg chan
	msgChan = make(chan *sarama.ProducerMessage, chanSize)

	Client = client

	// read message from chan (tail)
	go SendMsg2Kfk()

	return nil
}

// send message to channel(kafka)
func SendMsg2Kfk() error {
	for {
		select {
		case msg := <-msgChan:
			partition, offset, err := Client.SendMessage(msg)
			if err != nil {
				logrus.Error("send message failed.", err.Error())
				return err
			}
			logrus.Infof("send message to partition %d, offset %d", partition, offset)
		}
	}
	return nil
}在这一步中,我们主要做的任务有:
- 启动一个etcd的连接,watch 一个etcd 中的一个key,返回一个配置管道watchChan
- 如果watchChan中有配置消息的更新,则发送到配置管道中,供读取文件任务使用
// init etcd client
func Init(address []string) error {
	//ctx, cancel := context.WithTimeout(context.Background(), time.Second*5)
	cli, err := clientv3.New(clientv3.Config{
		Endpoints:   address,
		DialTimeout: 5 * time.Second,
	})
	if err != nil {
		fmt.Println("cannot connect to etcd", err)
		return err
	}
	//defer cli.Close()
	client = cli
	return nil
}

func GetConf(conf string, newConfigChan chan *[]common.CollectEntry) (err error) {
	//ctx, cancel := context.WithTimeout(context.Background(), 10*time.Second)
	//defer cancel()
	firstTime := atomic.Bool{}
	firstTime.Store(true)
	go func() {
		ctx := context.Background()
		watchChan := client.Watch(ctx, "/"+conf)
		defer client.Close()
		for {
			// if first time in this loop, get config from etcd
			if firstTime.Load() {
				newConfigChan = getConfigFromEtcd(ctx, conf, newConfigChan)
			}

			select {
			case resp := <-watchChan:
				firstTime.Store(false)
				for _, ev := range resp.Events {
					logrus.WithFields(logrus.Fields{
						"key":     string(ev.Kv.Key),
						"value":   string(ev.Kv.Value),
						"version": ev.Kv.Version,
						"type":    ev.Type,
					}).Info("watch event")
					configs := new([]common.CollectEntry)
					json.Unmarshal(ev.Kv.Value, configs)
					newConfigChan <- configs
				}

			case <-ctx.Done():
			}
		}
	}()

	return nil

}

func getConfigFromEtcd(ctx context.Context, conf string, newConfigChan chan *[]common.CollectEntry) chan *[]common.CollectEntry {
	response, err2 := client.Get(ctx, "/"+conf)
	if err2 != nil {
		logrus.Error("first time get confs err", err2)
	}
	for index, value := range response.Kvs {
		logrus.WithFields(logrus.Fields{
			"index": index,
			"key":   string(value.Key),
			"value": string(value.Value),
		}).Info("first time get from etcd,")
		configs := new([]common.CollectEntry)
		json.Unmarshal(value.Value, configs)
		newConfigChan <- configs
	}
	return newConfigChan
}在这一步中,我们需要做的有:
- 启动一个协程,不断监听配置管道中的配置更新
- 如果有配置的更新,先停止上一批次负责读取文件的协程,然后根据配置里面的条数,新建这一批读取文件的协程,不断读取日志,然后发送到消息管道中,供kafka producer任务去发送到kafka中。
📅 这一步的难点主要在于我们先要使用一个协程监听配置的更新,然后在这个协程中又按照配置的变更去启动一批子协程。在这里,先是使用了context的机制去缓存上一批协程启动时的cancel(), 在配置的更新时,调用cancel(),通知上一批协程去注销。
func (t *tailTask) readLines(ctx context.Context) {
defer t.instance.Stop()
// read new contents from file
for {
select {
case msg, ok := <-t.instance.Lines:
if !ok {
logrus.Error("EOF")
continue
}
// exclude the space and /n
msg.Text = strings.TrimSpace(msg.Text)
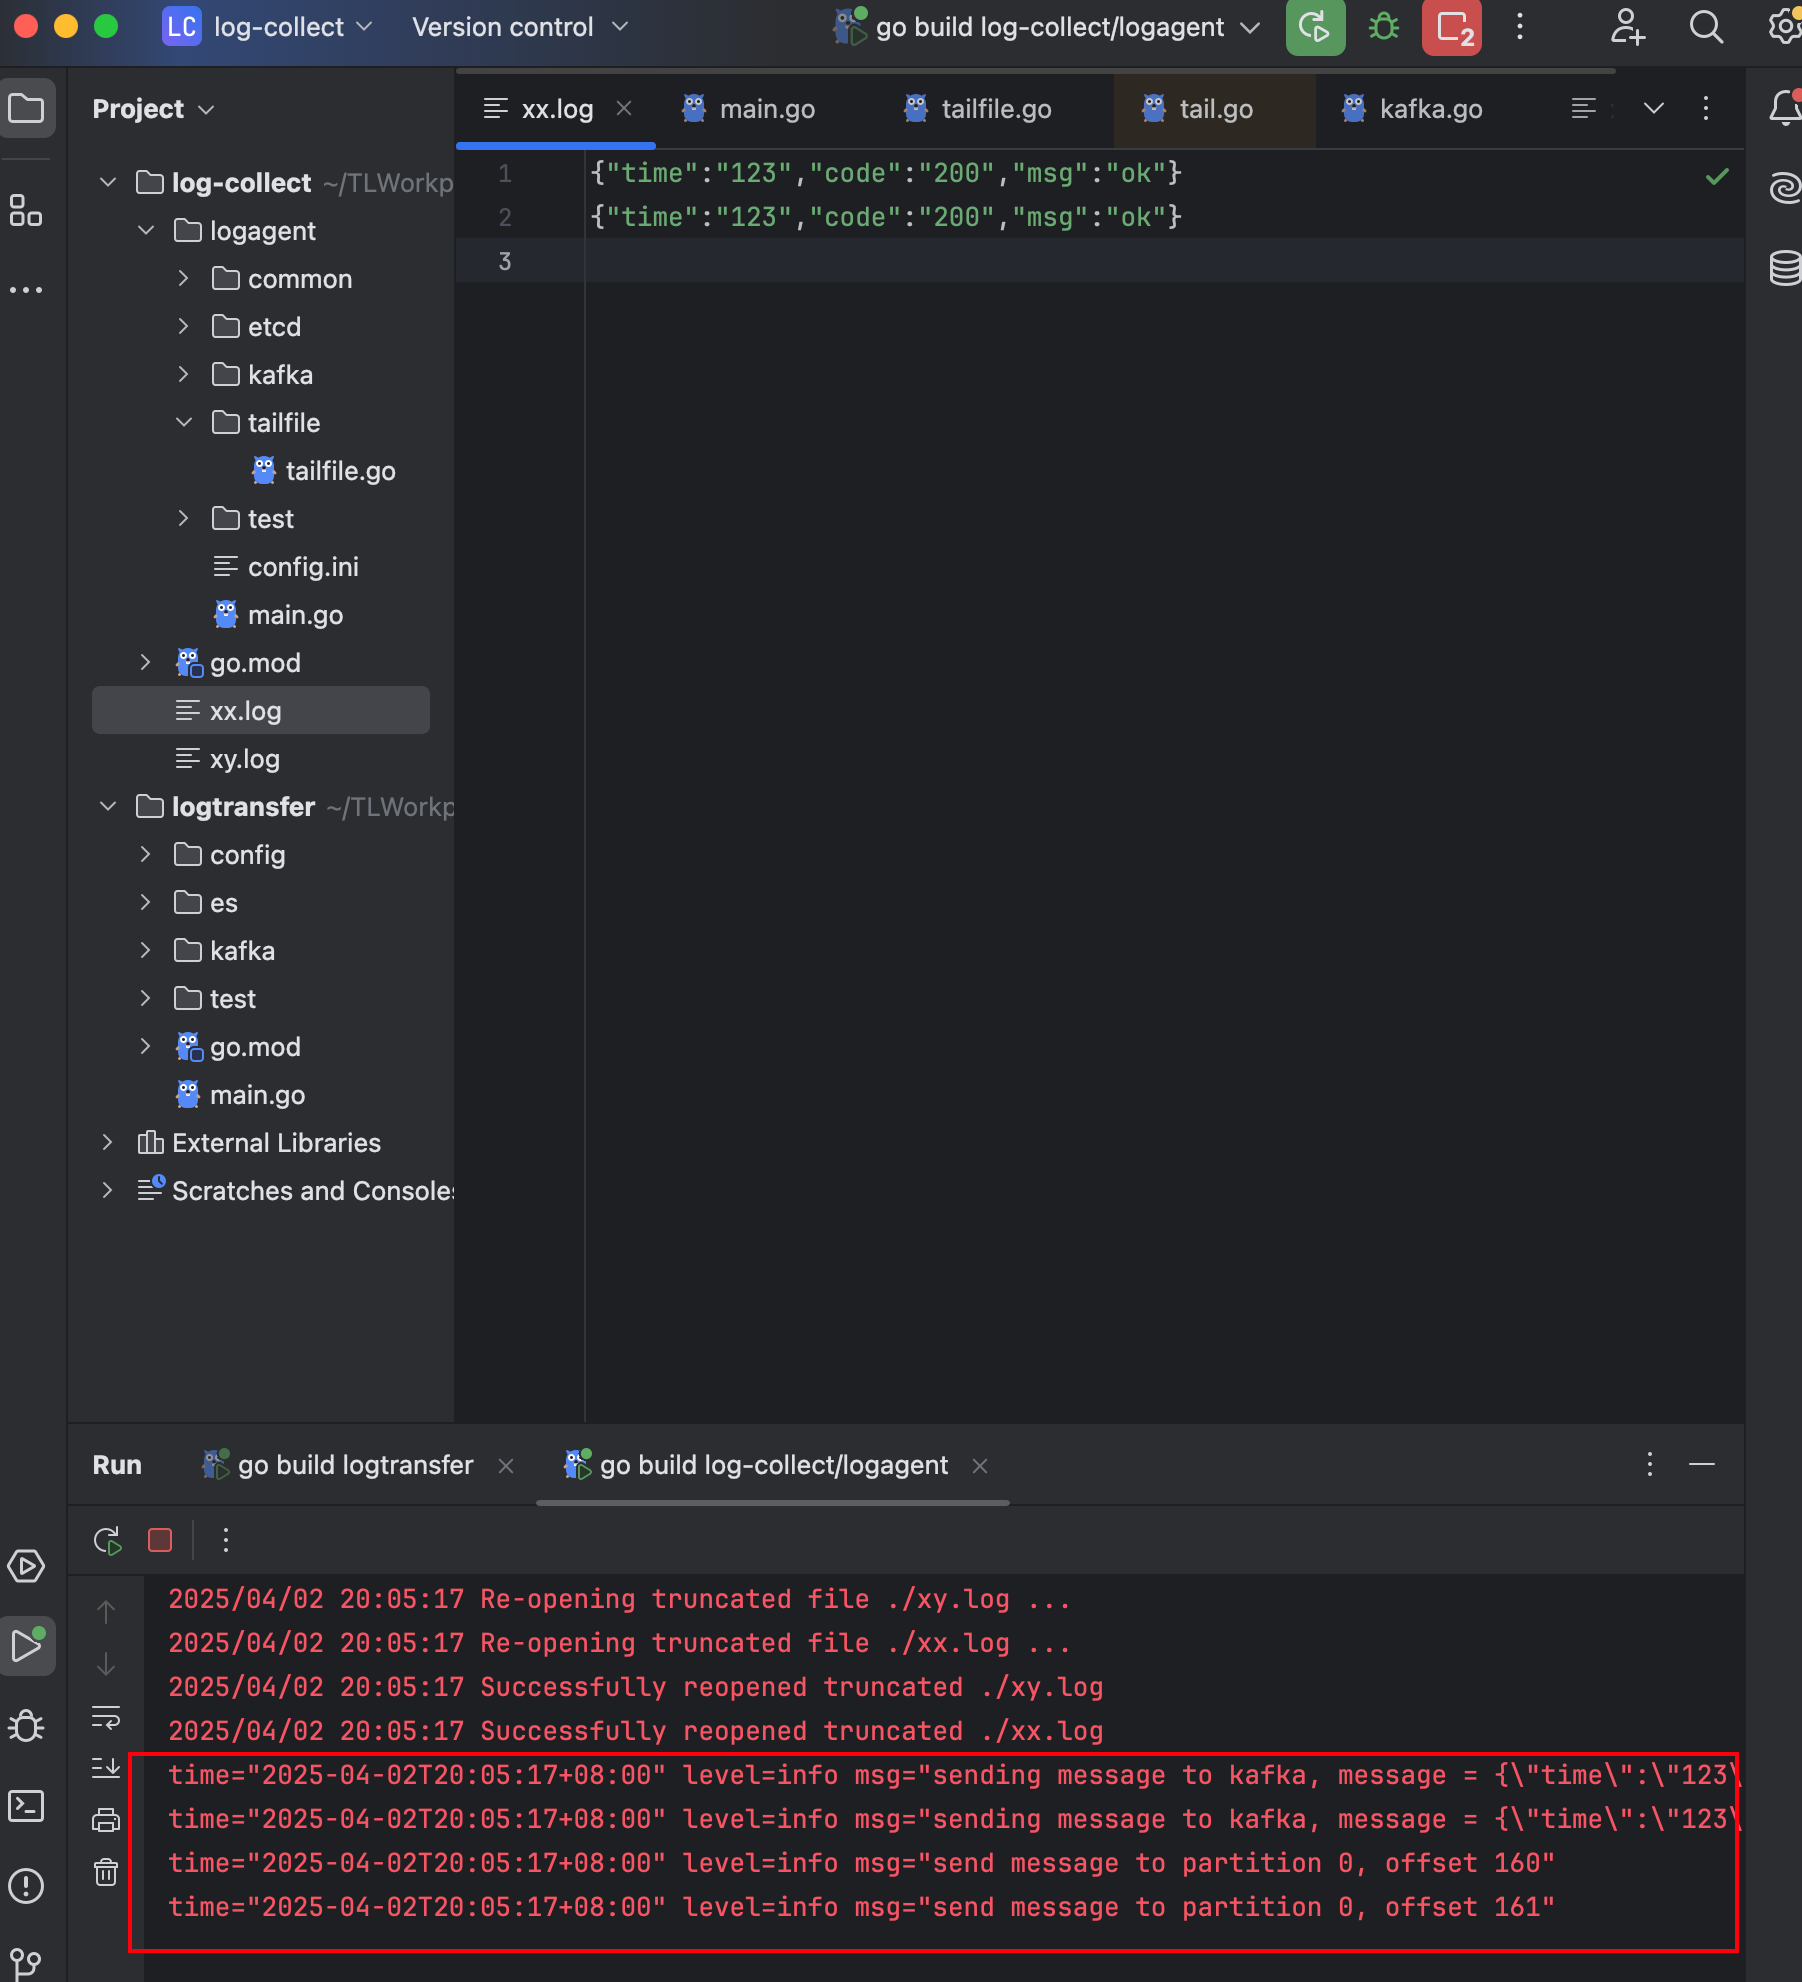
logrus.Info("sending message to kafka, message = ", msg.Text)
// async send message to kafka using chan
producerMessage := &sarama.ProducerMessage{}
producerMessage.Topic = t.topic
producerMessage.Value = sarama.StringEncoder(msg.Text)
kafka.SendToMsgChan(producerMessage)
case <-ctx.Done():
logrus.Info("kill goroutine,ctx Done.")
return
}
}
}
func NewTailTask(path, topic string) *tailTask {
// config Tail
config := tail.Config{
ReOpen: true,
Follow: true,
Location: &tail.SeekInfo{Offset: 0, Whence: 2},
MustExist: false,
Poll: true,
}
tailFile, err := tail.TailFile(path, config)
if err != nil {
log.Fatalf("Error opening file: %v", err)
}
tt := &tailTask{
path: path,
topic: topic,
instance: tailFile,
}
return tt
}
func Init(newConfigChan chan *[]common.CollectEntry) error {
go func() {
// cache the cancel() func
var cancelLastTime context.CancelFunc
for {
select {
// dead loop
case confs := <-newConfigChan:
// stop all goroutines before new batch=
if cancelLastTime != nil {
cancelLastTime()
}
ctx, cancel := context.WithCancel(context.Background())
// cache
cancelLastTime = cancel
// execute goroutine to read from file,
// and sent to msgChan
for _, conf := range *confs {
tt := NewTailTask(conf.Path, conf.Topic)
go tt.readLines(ctx)
}
}
}
}()
return nil
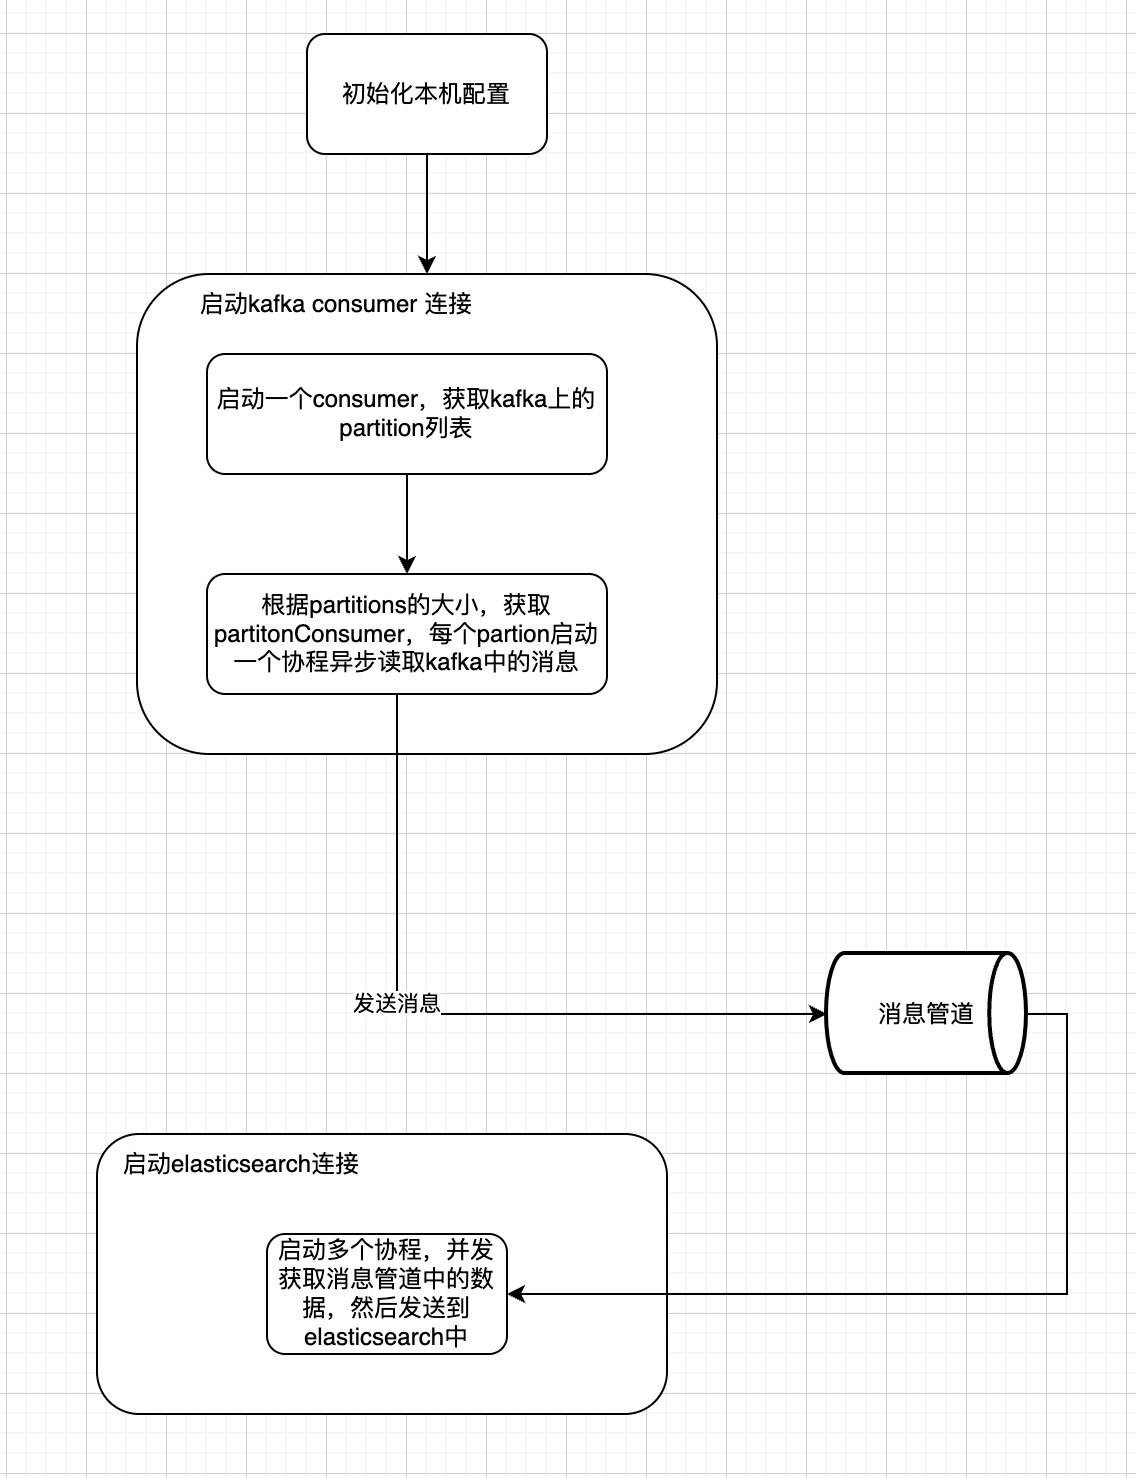
}在搭建log-collect之前,我们首先来画个图来分析下log-collect服务是怎么工作的,然后我们针对图中的核心要点逐一分析。
在这一步中,我们需要新建一个kafka 的consumer, 通过这个consumer去获取topic的partition,然后根据partition的个数,去创建多个协程并发获取kafka中的消息。
// transfer messages from kafka to msgChan
func (k *KFKClient) AsyncReadMessageToChan(topic string, msgChan chan<- *sarama.ConsumerMessage) error {
// get patition list of this topic
partitionList, err := k.Consumer.Partitions(topic)
if err != nil {
logrus.Errorf("Error getting list of partitions: %v", err)
panic(err)
}
logrus.WithFields(logrus.Fields{
"count": len(partitionList),
"value": partitionList,
}).Info("get list of partitions")
ctx, cancel := context.WithCancel(context.Background())
for _, partition := range partitionList {
partitionConsumer, err := k.Consumer.ConsumePartition("web_log", partition, sarama.OffsetNewest)
if err != nil {
logrus.WithFields(logrus.Fields{
"partition": partition,
"error": err,
}).Error("Failed to consume partition")
continue
}
// for a single partition,
// execute goroutine to transfer message to msgChan
go func(pc sarama.PartitionConsumer, p int32) {
defer pc.AsyncClose()
for {
select {
case msg := <-pc.Messages():
logrus.WithFields(logrus.Fields{
"partition": p,
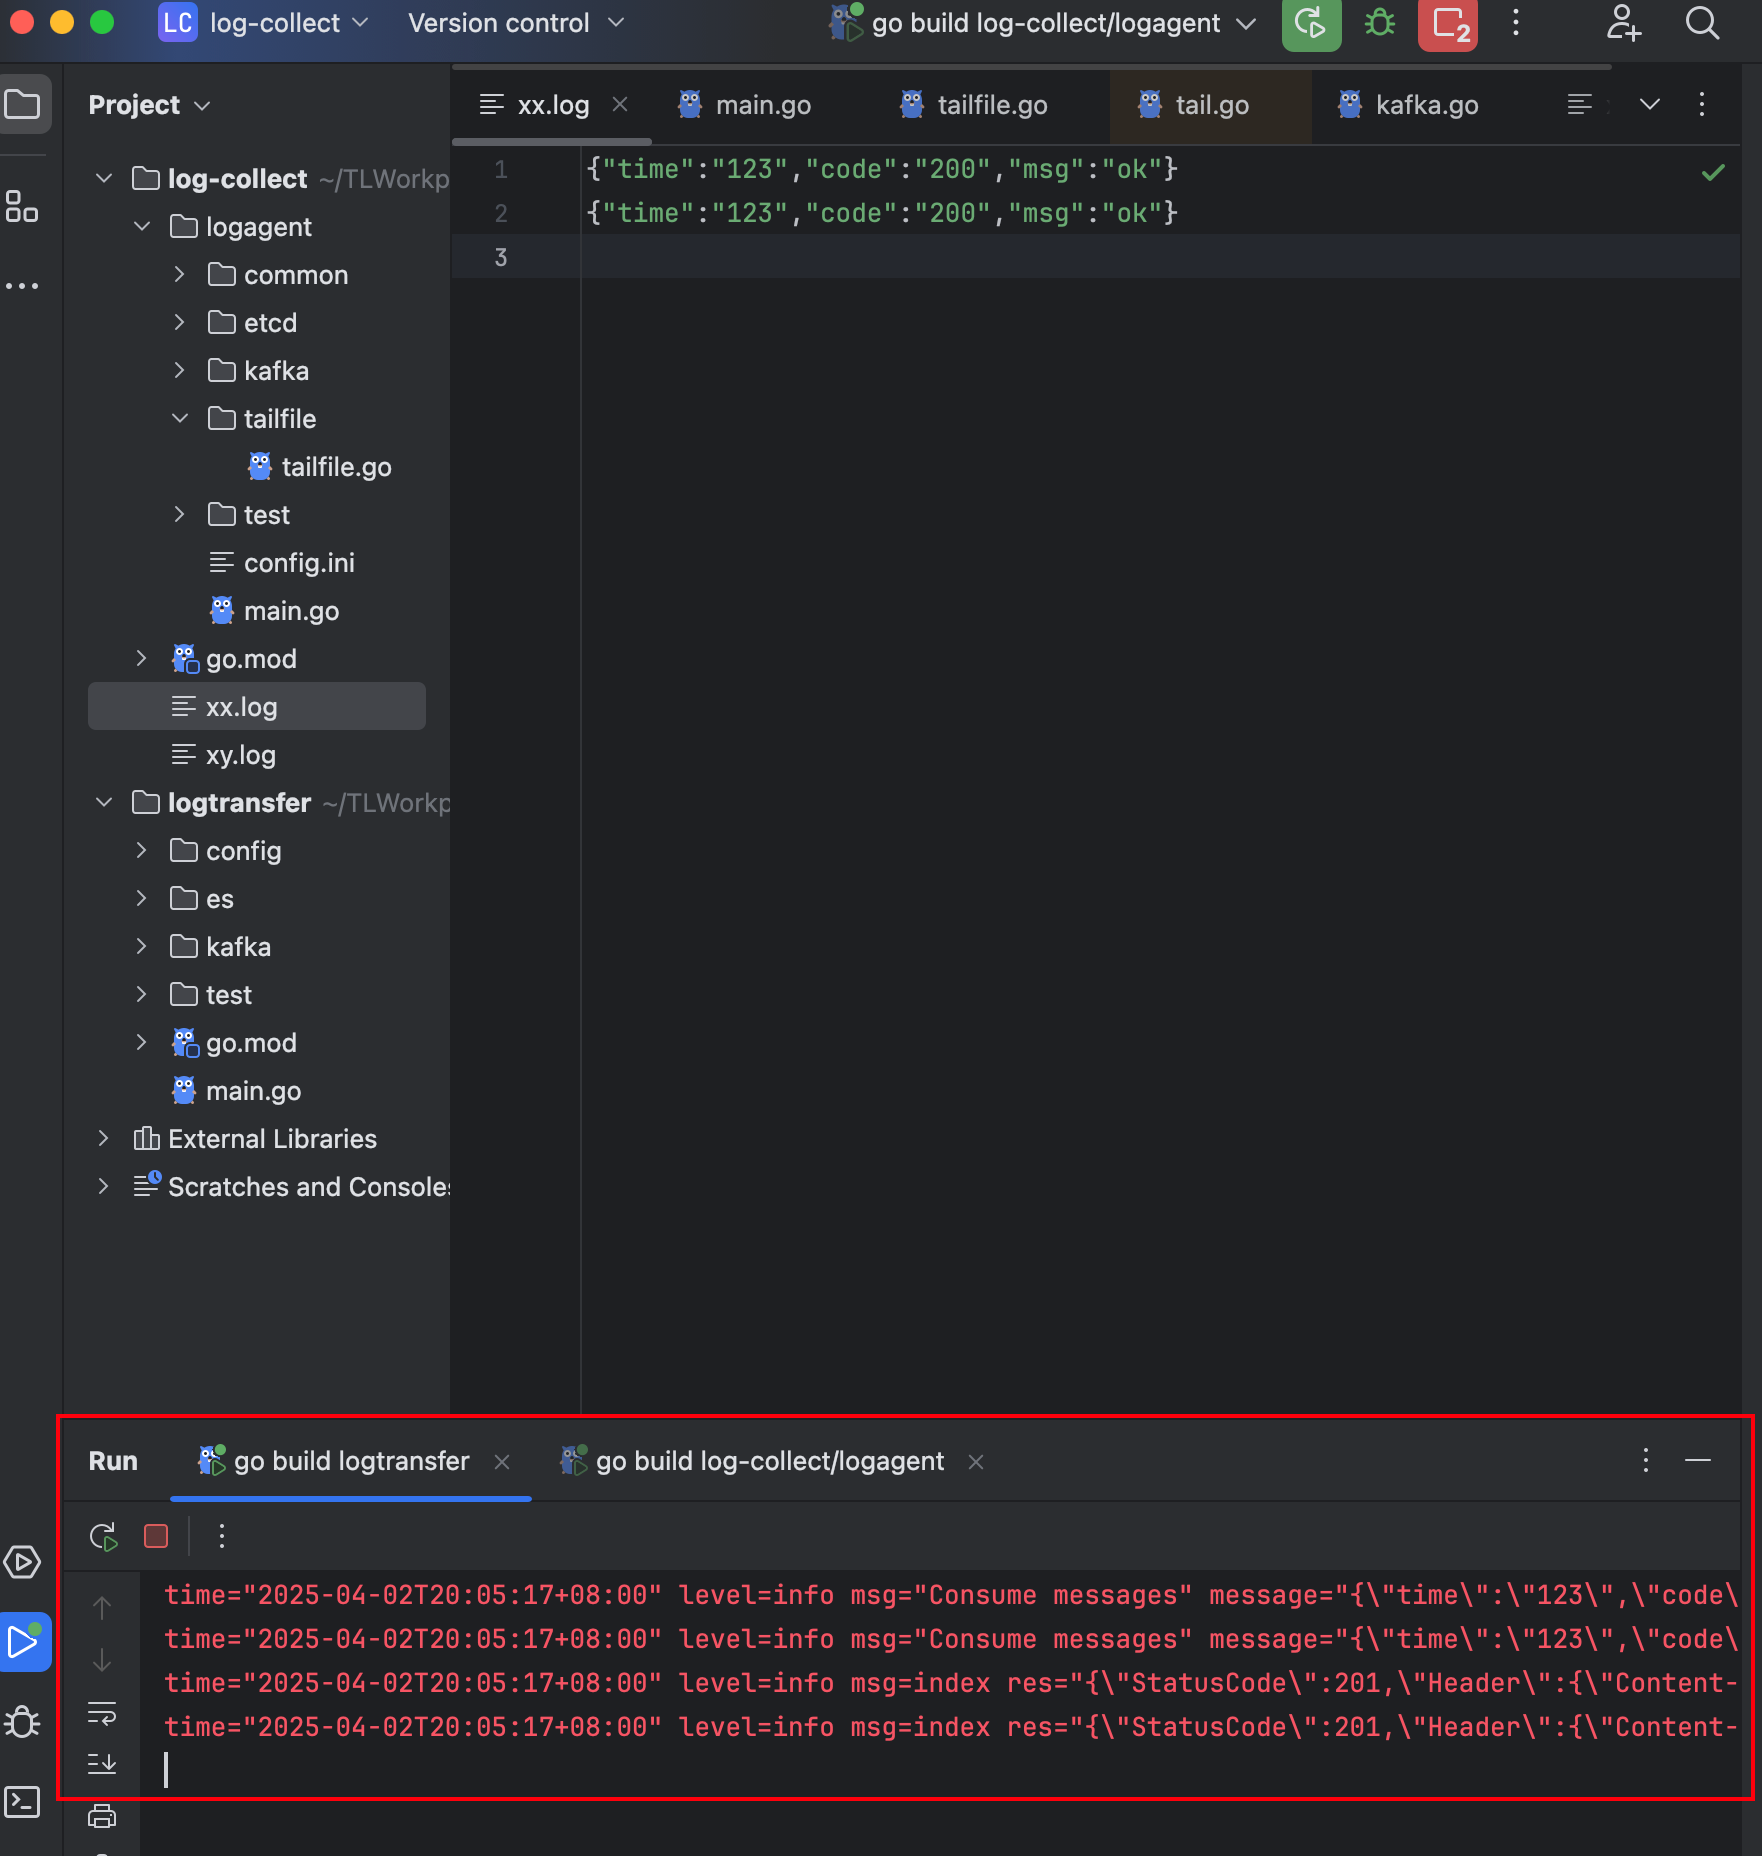
"message": string(msg.Value),
}).Info("Consume messages")
msgChan <- msg
case err := <-pc.Errors():
logrus.Error(err)
cancel()
return
case <-ctx.Done():
logrus.Errorf("Got ctx.Done signal, shutting down")
return
}
}
}(partitionConsumer, partition)
}
return nil
}在这一步中,我们所要做的事比较简单,我们根据配置里的信息,创建了100个协程,并发地将管道中的消息发送到elasticsearch中。
// transfer messages form msgChan to elasticsearch
func (c *ESClient) SendMsg2ESBatch(esConfig config.ESConfig, msgChan chan *sarama.ConsumerMessage) {
	ctx, cancel := context.WithCancel(context.Background())
	// execute 100 goroutines to send request to elasticsearch
	for i := 0; i < esConfig.GoroutineSize; i++ {
		go func(goroutineSize int) {
			for {
				select {
				case msg := <-msgChan:
					// send to es
					ret, err := c.ESProducer.Index(
						esConfig.Index,
						bytes.NewReader(msg.Value),
					)
					if err != nil {
						logrus.Errorf("send msg to es fail")
					}
					retBytes, _ := json.Marshal(ret)
					logrus.WithFields(logrus.Fields{
						"res": string(retBytes),
					}).Info("index")
					defer r
6598
et.Body.Close()
				case <-ctx.Done():
					cancel()
					logrus.Error("context cancel, ES client exit")
					return
				}
			}
		}(i)

	}

}
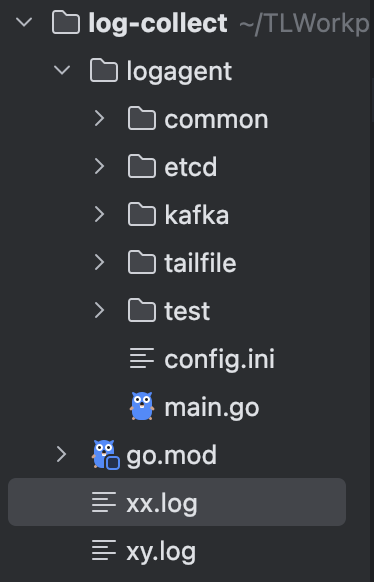
- 写入配置到etcd
在docker容器里执行命令:
etcdctl put /collect_log_conf '[{"path":"./xx.log","topic":"web_log"},{"path":"./xy.log","topic":"web_log"}]' - 创建xx.log和xy.log 在log-agent根目录下新建xx.log与xy.log,如下图所示
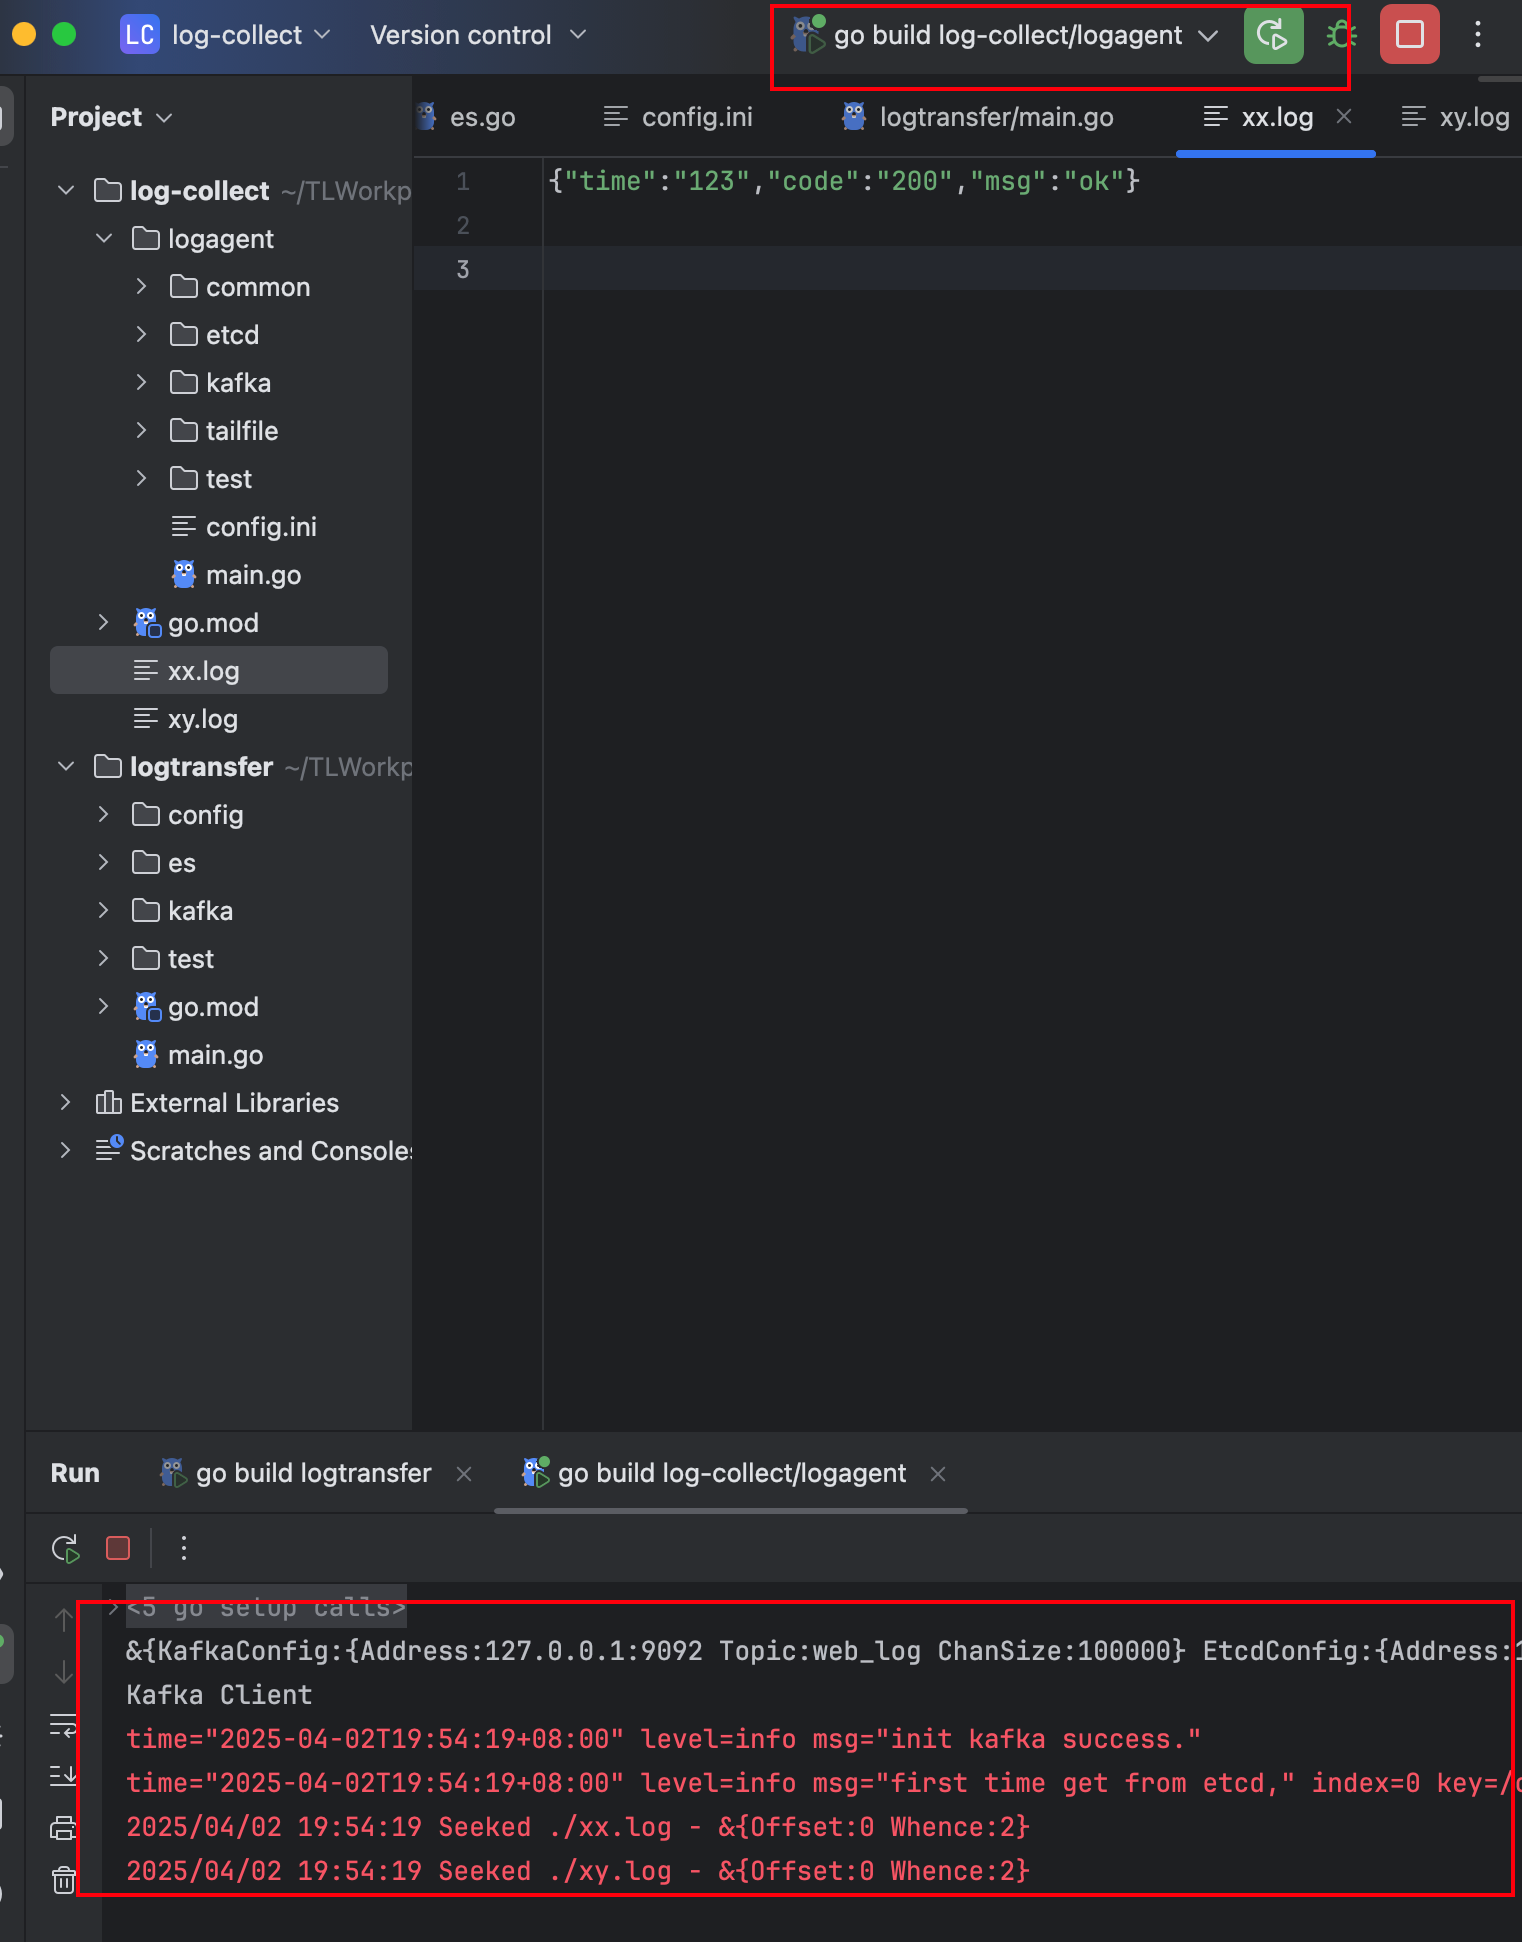
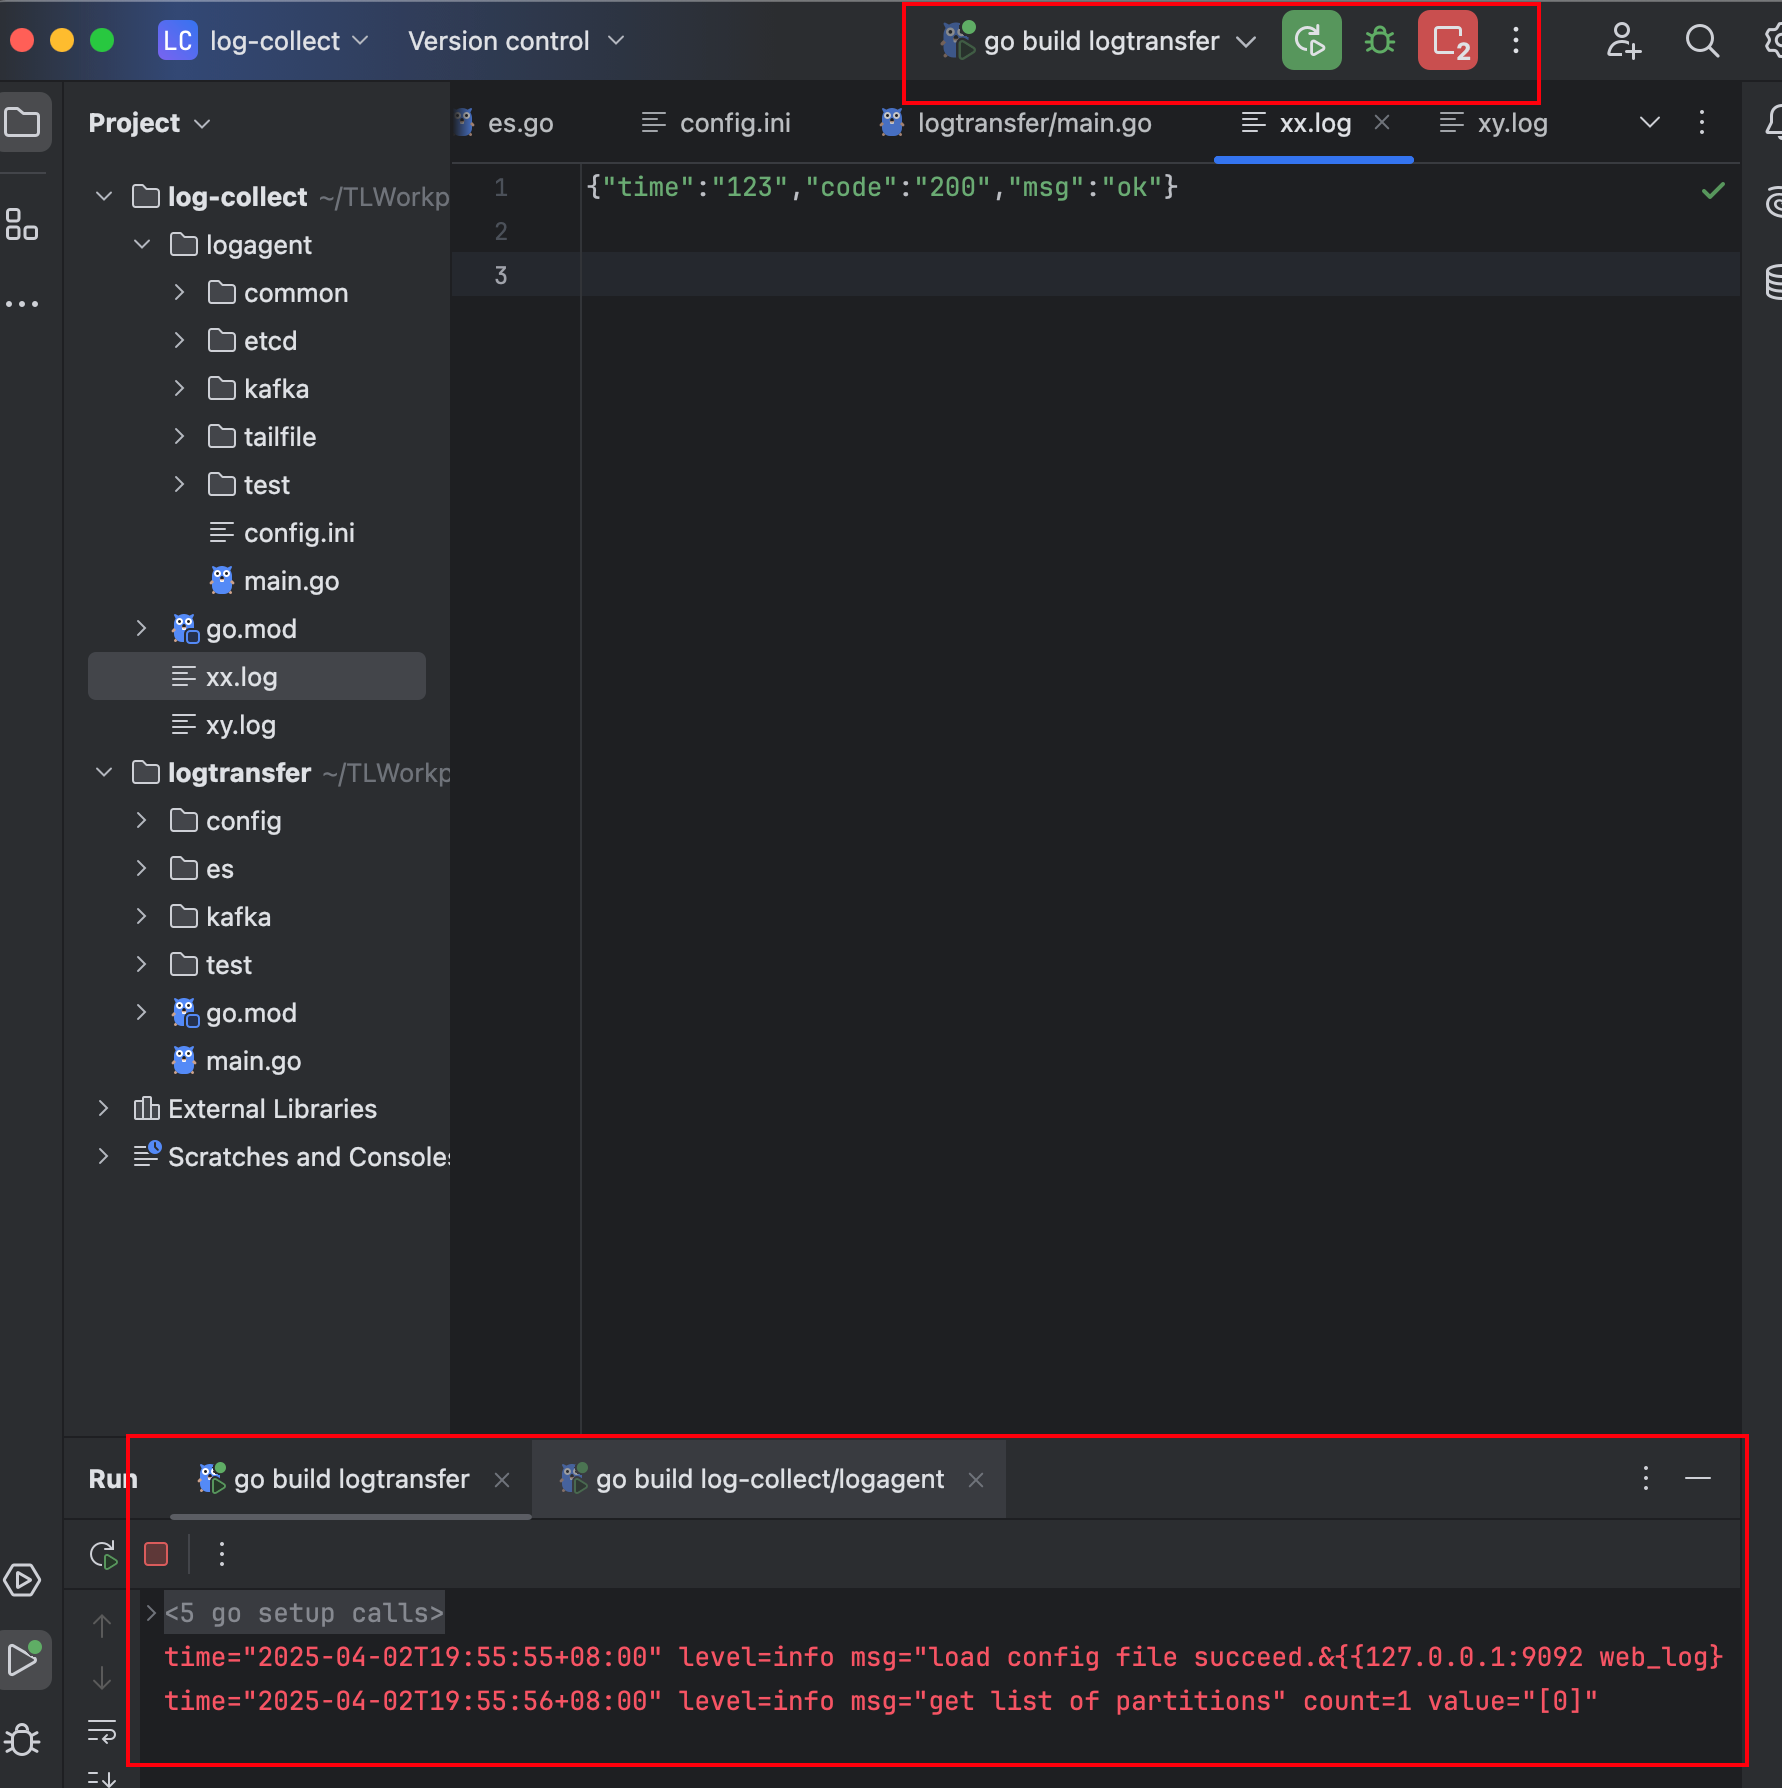
{"time":"123","code":"200","msg":"ok"}
{"time":"321","code":"500","msg":"not ok"}
11. 观察log-agent日志