Renewable energy (also called green energy) is energy made from renewable natural resources that are replenished on a human timescale. The most widely used renewable energy types are solar energy, wind power, and hydropower. Bioenergy and geothermal power are also significant in some countries. Some also consider nuclear power a renewable power source, although this is controversial, as nuclear energy requires mining uranium, a nonrenewable resource. Renewable energy installations can be large or small and are suited for both urban and rural areas. Renewable energy is often deployed together with further electrification. This has several benefits: electricity can move heat and vehicles efficiently and is clean at the point of consumption. Variable renewable energy sources are those that have a fluctuating nature, such as wind power and solar power. In contrast, controllable renewable energy sources include dammed hydroelectricity, bioenergy, or geothermal power.
Renewable energy systems have rapidly become more efficient and cheaper over the past 30 years. A large majority of worldwide newly installed electricity capacity is now renewable. Renewable energy sources, such as solar and wind power, have seen significant cost reductions over the past decade, making them more competitive with traditional fossil fuels. In most countries, photovoltaic solar or onshore wind are the cheapest new-build electricity. From 2011 to 2021, renewable energy grew from 20% to 28% of global electricity supply. Power from the sun and wind accounted for most of this increase, growing from a combined 2% to 10%. Use of fossil energy shrank from 68% to 62%. In 2022, renewables accounted for 30% of global electricity generation and are projected to reach over 42% by 2028. Many countries already have renewables contributing more than 20% of their total energy supply, with some generating over half or even all their electricity from renewable sources.
The main motivation to replace fossil fuels with renewable energy sources is to slow and eventually stop climate change, which is widely agreed to be caused mostly by greenhouse gas emissions. In general, renewable energy sources cause much lower emissions than fossil fuels. The International Energy Agency estimates that to achieve net zero emissions by 2050, 90% of global electricity generation will need to be produced from renewable sources. Renewables also cause much less air pollution than fossil fuels, improving public health, and are less noisy.
The deployment of renewable energy still faces obstacles, especially fossil fuel subsidies, lobbying by incumbent power providers, and local opposition to the use of land for renewable installations. Like all mining, the extraction of minerals required for many renewable energy technologies also results in environmental damage. In addition, although most renewable energy sources are sustainable, some are not. (Full article...)
Solar Power Plant Telangana II in state of Telangana, India.
India is the world's 3rd largest consumer of electricity and the world's 3rd largest renewable energy producer with 46.3% of energy capacity installed as of October 2024 (203.18 GW of 452.69 GW) coming from renewable sources. Ernst & Young's (EY) 2021 Renewable Energy Country Attractiveness Index (RECAI) ranked India 3rd behind USA and China. In FY2023-24, India is planning to issue 50 GW tenders for wind, solar and hybrid projects. India has committed for a goal of 500 GW renewable energy capacity by 2030.
As of October 2024, 92.12 GW solar energy is already operational, projects of 48.21 GW are at various stages of implementation and projects of 25.64 GW capacity are under various stages of bidding. In 2020, 3 of the world's top 5 largest solar parks were in India including world's largest 2255 MW Bhadla Solar Park in Rajasthan and world's second-largest solar park of 2000 MW Pavgada Solar Park Tumkur in Karnataka and 1000 MW Kurnool in Andhra Pradesh. Wind power in India has a strong manufacturing base with 20 manufactures of 53 different wind turbine models of international quality up to 3 MW in size with exports to Europe, United States and other countries. (Full article...)
"People do not want electricity or oil ... but rather comfortable rooms, light, vehicular motion, food, tables, and other real things."
"There exists today a body of energy technologies that have certain specific features in common and that offer great technical, economic, and political attractions ... 'soft' energy technologies [which are] flexible, resilient, sustainable, and benign. They rely on renewable energy flows that are always there whether we use them of not, such as sun and wind and vegetation."
"Soft technologies' matching of energy quality to end-use needs virtually eliminates the costs and losses of secondary energy conversion, [and] the appropriate scale of soft technologies can virtually eliminate the costs and losses of energy distribution."
– Amory Lovins, Soft Energy Paths, 1977, pp. 38–40.
Denis Allen Hayes (born August 29, 1944) is an environmental advocate and an advocate for solar power. He rose to prominence in 1970 as the coordinator for the first Earth Day.
... that the Cragsidecountry house in Northumberland, England was the first house in the world to be lit using hydroelectric power? In 1870, water from one of the estate's lakes was used to drive a Siemensdynamo in what was the world's first hydroelectric power station. The resultant electricity was used to power an arc lamp installed in the Gallery in 1878.
Image 3Seasonal cycle of capacity factors for wind and photovoltaics in Europe under idealized assumptions. The figure illustrates the balancing effects of wind and solar energy at the seasonal scale (Kaspar et al., 2019). (from Wind power)
Image 10Installed geothermal energy capacity, 2022 (from Geothermal energy)
Image 11Yearly hydro generation by continent (from Hydroelectricity)
Image 12Wind turbines such as these, in Cumbria, England, have been opposed for a number of reasons, including aesthetics, by some sectors of the population. (from Wind power)
Image 13Cost development of solar PV modules per watt (from Solar energy)
Image 14Merowe Dam in Sudan. Hydroelectric power stations that use dams submerge large areas of land due to the requirement of a reservoir. These changes to land color or albedo, alongside certain projects that concurrently submerge rainforests, can in these specific cases result in the global warming impact, or equivalent life-cycle greenhouse gases of hydroelectricity projects, to potentially exceed that of coal power stations. (from Hydroelectricity)
Image 15Museum Hydroelectric power plant "Under the Town" in Užice, Serbia, built in 1900 (from Hydroelectricity)
Image 16Share of electricity production from hydropower, 2023 (from Hydroelectricity)
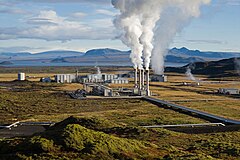
Image 17Geothermal power station in the Philippines (from Geothermal energy)
Image 18Greenhouses like these in the Westland municipality of the Netherlands grow vegetables, fruits and flowers. (from Solar energy)
Image 19The Warwick Castle water-powered generator house, used for the generation of electricity for the castle from 1894 until 1940 (from Hydroelectricity)
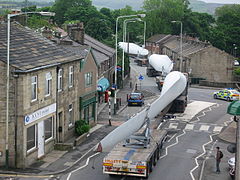
Image 26A turbine blade convoy passing through Edenfield in the U.K. (2008). Even longer 2-piece blades are now manufactured, and then assembled on-site to reduce difficulties in transportation. (from Wind power)
Image 27Global map of wind speed at 100 meters on land and around coasts. (from Wind power)
Image 33Energy from wind, sunlight or other renewable energy is converted to potential energy for storage in devices such as electric batteries or higher-elevation water reservoirs. The stored potential energy is later converted to electricity that is added to the power grid, even when the original energy source is not available. (from Wind power)
Image 35Acceptance of wind and solar facilities in one's community is stronger among U.S. Democrats (blue), while acceptance of nuclear power plants is stronger among U.S. Republicans (red). (from Wind power)
Image 36Distribution of wind speed (red) and energy (blue) for all of 2002 at the Lee Ranch facility in Colorado. The histogram shows measured data, while the curve is the Rayleigh model distribution for the same average wind speed. (from Wind power)
Image 37Concentrated solar panels are getting a power boost. Pacific Northwest National Laboratory (PNNL) will be testing a new concentrated solar power system – one that can help natural gas power plants reduce their fuel usage by up to 20 percent.[needs update] (from Solar energy)
Image 38Electricity generation at Wairakei, New Zealand (from Geothermal energy)
Image 39Hydro generation by country, 2021 (from Hydroelectricity)
Image 46Electricity production by source (from Wind power)
Image 47Electricity generation at Ohaaki, New Zealand (from Geothermal energy)
Image 48Share of electricity production from wind, 2023 (from Wind power)
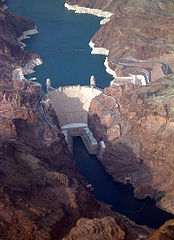
Image 49The Hoover Dam in the United States is a large conventional dammed-hydro facility, with an installed capacity of 2,080 MW. (from Hydroelectricity)
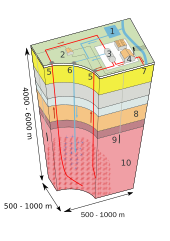
Image 59Enhanced geothermal system 1:Reservoir 2:Pump house 3:Heat exchanger 4:Turbine hall 5:Production well 6:Injection well 7:Hot water to district heating 8:Porous sediments 9:Observation well 10:Crystalline bedrock (from Geothermal energy)


![Image 37Concentrated solar panels are getting a power boost. Pacific Northwest National Laboratory (PNNL) will be testing a new concentrated solar power system – one that can help natural gas power plants reduce their fuel usage by up to 20 percent.[needs update] (from Solar energy)](http://upload.wikimedia.org/wikipedia/commons/thumb/8/82/Photo_of_the_Week-_Boosting_Solar_Technology_%288722948189%29.jpg/240px-Photo_of_the_Week-_Boosting_Solar_Technology_%288722948189%29.jpg)