Journal Description
Vision
Vision
is an international, peer-reviewed, open access journal on vision published quarterly online by MDPI.
- Open Access— free for readers, with article processing charges (APC) paid by authors or their institutions.
- High Visibility: indexed within ESCI (Web of Science), Scopus, PubMed, PMC, and other databases.
- Rapid Publication: manuscripts are peer-reviewed and a first decision is provided to authors approximately 24.9 days after submission; acceptance to publication is undertaken in 4.6 days (median values for papers published in this journal in the first half of 2024).
- Recognition of Reviewers: reviewers who provide timely, thorough peer-review reports receive vouchers entitling them to a discount on the APC of their next publication in any MDPI journal, in appreciation of the work done.
Latest Articles
New Horizons in Myopia Management: Bridging Epidemiology and Clinical Innovation
Vision 2024, 8(4), 68; https://doi.org/10.3390/vision8040068 - 1 Dec 2024
Abstract
In 1975, Brit J [...]
Full article
(This article belongs to the Special Issue New Horizons in Myopia Management: Bridging Epidemiology and Clinical Innovation)
►
Show Figures
Open AccessReview
Digital Applications for Videoterminal-Associated Dry Eye Disease
by
Maria Angela Romeo, Giulia Coco, Andrea Taloni, Giovanna Carnovale-Scalzo, Vincenzo Scorcia and Giuseppe Giannaccare
Vision 2024, 8(4), 67; https://doi.org/10.3390/vision8040067 - 28 Nov 2024
Abstract
Dry eye disease (DED) has become increasingly prevalent in the digital era, largely due to prolonged screen exposure. The excessive use of digital devices contributes to inappropriate blink frequency and dynamics, leading to ocular surface dryness and discomfort. Additionally, digital screen use has
[...] Read more.
Dry eye disease (DED) has become increasingly prevalent in the digital era, largely due to prolonged screen exposure. The excessive use of digital devices contributes to inappropriate blink frequency and dynamics, leading to ocular surface dryness and discomfort. Additionally, digital screen use has broader implications for systemic health, including visual strain, headaches, and disrupted circadian rhythms caused by blue light exposure. Previous studies have shown that prolonged screen time correlates with altered blink frequency and increased symptom severity in DED patients, exacerbating the imbalance in tear film production and evaporation. Blinking dynamics, particularly blink rate and completeness, are crucial in maintaining ocular surface moisture. Incomplete blinking impairs meibomian gland function, reducing lipid secretion, which is essential for preventing tear evaporation. Raising patient awareness through educational material, ergonomic adjustments, and blinking exercises has been shown to mitigate these effects. Digital tools that provide targeted educational interventions can be particularly effective in improving blink dynamics and overall ocular comfort. This study evaluates the efficacy of digital applications in optimizing blinking dynamics and enhancing tear film stability. The findings suggest that these innovations improve patient outcomes by encouraging healthier eye care practices. However, further research is needed to assess their long-term impact across diverse populations.
Full article
Open AccessArticle
Optical Bench Evaluation of a Novel, Hydrophobic, Acrylic, One-Piece, Polyfocal Intraocular Lens with a “Zig-Zag” L-Loop Haptic Design
by
Andreas F. Borkenstein, Eva-Maria Borkenstein, Pooria Omidi and Achim Langenbucher
Vision 2024, 8(4), 66; https://doi.org/10.3390/vision8040066 - 14 Nov 2024
Abstract
►▼
Show Figures
Purpose: The number of presbyopia-correcting (premium) intraocular lenses (IOLs) is growing steadily as the desire for spectacle independence after cataract surgery increases. The aim of this laboratory study was to evaluate a newly launched hydrophobic, acrylic, polyfocal, refractive intraocular lens with a new
[...] Read more.
Purpose: The number of presbyopia-correcting (premium) intraocular lenses (IOLs) is growing steadily as the desire for spectacle independence after cataract surgery increases. The aim of this laboratory study was to evaluate a newly launched hydrophobic, acrylic, polyfocal, refractive intraocular lens with a new optical design and geometry. This polyfocal IOL has three different zones (within the optic) with radially asymmetric design. Methods: We performed optical bench tests to calculate the optical characteristics of the sample. The optical performance and quality of IOLs based on ISO 11979-2 and 11979-9 requirements were analyzed with the NIMO TR0815 (Lambda-X). In addition, optical quality metrics were evaluated with the IOLA MFD device (Rotlex). Sphere, Add, modulation transfer function (MTF), the energy distribution between the modes and the MTF along the whole range from far to near were analyzed. Results: The power histogram showed that the tested IOL has the characteristics of a polyfocal IOL with a wide range of optical power between 20.5 and 24.5 diopters. Two distinct peaks were observed, indicating bifocal functionality. In the radial and axial power surface map, all three zones, stated by the company, could be detected. Larger apertures lead to a significant increase in MTF at the far peak, indicating better visual acuity for distant objects under low-light conditions. It was observed that in small aperture sizes, intermediate vision seems to be dominant. The energy distribution remained almost constant with increasing aperture size. Conclusions: This laboratory study was able to confirm the properties of the polyfocal lens stated by the company. Three optical zones could be identified. However, further optical bench tests should be performed to evaluate the new lens under tilted and decentered conditions. Clinical studies have to confirm that the presbyopia-correcting, polyfocal lens can achieve good clinical results with high patient satisfaction without disturbing side effects.
Full article

Figure 1
Figure 1
<p>Schematic drawing of the newly launched hydrophobic, acrylic, polyfocal presbyopia-correcting intraocular lens (AutofocusPro, ModelNo VVB10SCA) showing the three optical zones and the “zig-zag L-loop” haptic design.</p> Full article ">Figure 2
<p>Multi-aperture MTF and power analysis for near and far focus. This figure presents the modulation transfer function (MTF) and optical power for both near and far focal points as a function of aperture size. The far power is represented by the green curve, while the near power is shown in orange. The red and blue lines correspond to the MTF at far and near focal points, respectively. The trends indicate how the optical performance and power vary with changes in aperture, highlighting the differences between near and far focus through various aperture sizes.</p> Full article ">Figure 3
<p>Relative intensity distribution for far and near vision across aperture sizes. This figure shows the relative intensity distribution (RNI) between far (red) and near (green) focal points as a function of aperture size. As aperture size increases, the near intensity decreases while the far intensity increases, crossing at approximately 3.4 mm. The results indicate a shift in energy distribution favoring distance vision at larger apertures.</p> Full article ">Figure 4
<p>Through-focus modulation transfer function of a multifocal lens. This figure illustrates the through-focus modulation transfer function (MTF) for a bifocal multifocal lens along two perpendicular meridians, at 0° (dark red line) and 90° (light red line). Peaks in the MTF curves correspond to the near and far focal points. The optical power ranges between 16.26 D to 28.2 D, with higher MTF values indicating better resolution at those specific focal points.</p> Full article ">Figure 5
<p>Power and Energy Distribution for Near and Far Focus with Aperture Size. This figure shows the distribution of optical energy between the near (green) and far (red) focal points as aperture size changes. The near energy distribution de-creases with increasing aperture, while far energy increases, demonstrating how optical performance for both distances is affected by aperture size.</p> Full article ">
Open AccessSystematic Review
Optimal Timing for Intraocular Pressure Measurement Following Phacoemulsification Cataract Surgery: A Systematic Review and a Meta-Analysis
by
William J. Herspiegel, Brian E. Yu, Hamzah S. Algodi, Monali S. Malvankar-Mehta and Cindy M. L. Hutnik
Vision 2024, 8(4), 65; https://doi.org/10.3390/vision8040065 - 8 Nov 2024
Abstract
►▼
Show Figures
Post-operative increases in intraocular pressure (IOP) are a frequent complication following phacoemulsification cataract surgery. Assessment of IOP is an essential element in post-operative checks. Despite this, guidance regarding the optimal timing remains vague. The purpose of this meta-analysis was to determine the current
[...] Read more.
Post-operative increases in intraocular pressure (IOP) are a frequent complication following phacoemulsification cataract surgery. Assessment of IOP is an essential element in post-operative checks. Despite this, guidance regarding the optimal timing remains vague. The purpose of this meta-analysis was to determine the current status of evidence that may help guide best practice regarding the optimal time following phacoemulsification cataract surgery to measure IOP. A comprehensive literature search was performed on MEDLINE and EMBASE. In two stages, independent reviewers screened articles that reported IOP measurements following uncomplicated cataract surgery. Risk of Bias Assessment was conducted following data extraction. The meta-analysis incorporated 57 randomized clinical studies involving a total of 6318 participants and 7089 eyes. Post-operative hour one had a significant decrease in IOP from baseline, while hour two had a non-significant increase. Post-operative hours four, six, and eight were the only timepoints to have a significant increase in IOP. Finally, post-operative day one had no significant change in IOP, while day two had a non-significant decrease. These results suggest that the optimal time to measure IOP is within the first 4–8 h following phacoemulsification cataract extraction. Taking measurements too soon or too late could result in missed IOP spikes.
Full article
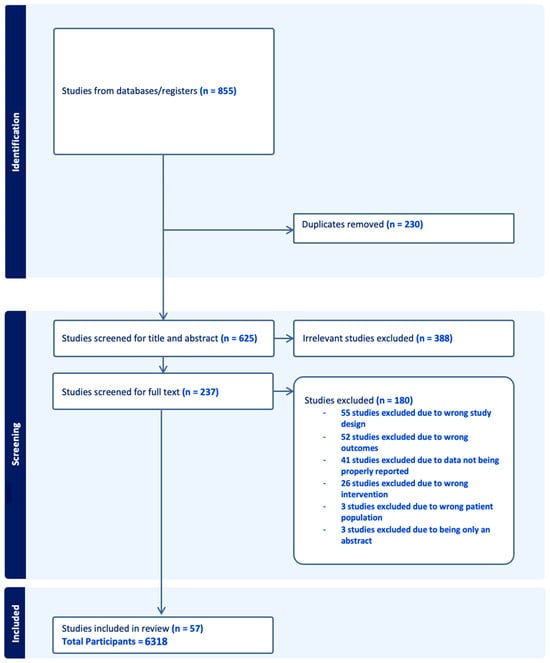
Figure 1
Figure 1
<p>PRISMA flow diagram for optimal timing for intraocular pressure measurement following phacoemulsification cataract surgery.</p> Full article ">Figure 2
<p>(<b>a</b>) Funnel plot for included meta-analysis studies that provided data on the change in IOP from baseline at 1 h following phacoemulsification; (<b>b</b>) funnel plot for included meta-analysis studies that provided data on the change in IOP from baseline at 2 h following phacoemulsification; (<b>c</b>) funnel plot for included meta-analysis studies that provided data on the change in IOP from baseline at 4 h following phacoemulsification; (<b>d</b>) funnel plot for included meta-analysis studies that provided data on the change in IOP from baseline at 6 h following phacoemulsification; (<b>e</b>) funnel plot for included meta-analysis studies that provided data on the change in IOP from baseline at 8 h following phacoemulsification; (<b>f</b>) funnel plot for included meta-analysis studies that provided data on the change in IOP from baseline at 1-day following phacoemulsification.</p> Full article ">Figure 3
<p>(<b>a</b>) Funnel plot for included meta-analysis studies that provided data on the change in IOP from baseline at 2-days following phacoemulsification; (<b>b</b>) funnel plot for included meta-analysis studies that provided data on the change in IOP from baseline at 3-days following phacoemulsification; (<b>c</b>) funnel plot for included meta-analysis studies that provided data on the change in IOP from baseline at 7-days following phacoemulsification; (<b>d</b>) funnel plot for included meta-analysis studies that provided data on the change in IOP from baseline at 30-days following phacoemulsification.</p> Full article ">Figure 4
<p>(<b>a</b>) Egger’s regression test for included meta-analysis studies that provided data on the change in IOP from baseline at 1 h following phacoemulsification; (<b>b</b>) Egger’s regression test for included meta-analysis studies that provided data on the change in IOP from baseline at 4 h following phacoemulsification; (<b>c</b>) Egger’s regression test for included meta-analysis studies that provided data on the change in IOP from baseline at 8 h following phacoemulsification.</p> Full article ">Figure 5
<p>(<b>a</b>) Non-parametric Trim and Fill method for included meta-analysis studies that provided data on the change in IOP from baseline at 1 h following phacoemulsification; (<b>b</b>) non-parametric Trim and Fill method for included meta-analysis studies that provided data on the change in IOP from baseline at 4 h following phacoemulsification; (<b>c</b>) non-parametric Trim and Fill method for included meta-analysis studies that provided data on the change in IOP from baseline at 8 h following phacoemulsification.</p> Full article ">Figure 6
<p>(<b>a</b>) Forest plot for included meta-analysis studies that provided data on the change in IOP from baseline at 1 h following phacoemulsification [<a href="#B62-vision-08-00065" class="html-bibr">62</a>,<a href="#B63-vision-08-00065" class="html-bibr">63</a>]; (<b>b</b>) Forest plot for included meta-analysis studies that provided data on the change in IOP from baseline at 2 h following phacoemulsification [<a href="#B62-vision-08-00065" class="html-bibr">62</a>,<a href="#B63-vision-08-00065" class="html-bibr">63</a>,<a href="#B64-vision-08-00065" class="html-bibr">64</a>]; (<b>c</b>) Forest plot for included meta-analysis studies that provided data on the change in IOP from baseline at 4 h following phacoemulsification [<a href="#B40-vision-08-00065" class="html-bibr">40</a>,<a href="#B57-vision-08-00065" class="html-bibr">57</a>,<a href="#B62-vision-08-00065" class="html-bibr">62</a>,<a href="#B63-vision-08-00065" class="html-bibr">63</a>]; (<b>d</b>) Forest plot for included meta-analysis studies that provided data on the change in IOP from baseline at 6 h following phacoemulsification [<a href="#B17-vision-08-00065" class="html-bibr">17</a>,<a href="#B19-vision-08-00065" class="html-bibr">19</a>,<a href="#B20-vision-08-00065" class="html-bibr">20</a>,<a href="#B21-vision-08-00065" class="html-bibr">21</a>,<a href="#B32-vision-08-00065" class="html-bibr">32</a>,<a href="#B36-vision-08-00065" class="html-bibr">36</a>,<a href="#B38-vision-08-00065" class="html-bibr">38</a>,<a href="#B44-vision-08-00065" class="html-bibr">44</a>,<a href="#B50-vision-08-00065" class="html-bibr">50</a>,<a href="#B51-vision-08-00065" class="html-bibr">51</a>,<a href="#B54-vision-08-00065" class="html-bibr">54</a>,<a href="#B58-vision-08-00065" class="html-bibr">58</a>,<a href="#B61-vision-08-00065" class="html-bibr">61</a>,<a href="#B62-vision-08-00065" class="html-bibr">62</a>,<a href="#B63-vision-08-00065" class="html-bibr">63</a>,<a href="#B66-vision-08-00065" class="html-bibr">66</a>,<a href="#B67-vision-08-00065" class="html-bibr">67</a>]; (<b>e</b>) Forest plot for included meta-analysis studies that provided data on the change in IOP from baseline at 8 h following phacoemulsification [<a href="#B23-vision-08-00065" class="html-bibr">23</a>,<a href="#B40-vision-08-00065" class="html-bibr">40</a>,<a href="#B57-vision-08-00065" class="html-bibr">57</a>,<a href="#B62-vision-08-00065" class="html-bibr">62</a>,<a href="#B63-vision-08-00065" class="html-bibr">63</a>].</p> Full article ">Figure 7
<p>Forest plot for included meta-analysis studies that provided data on the change in IOP from baseline at 1-day following phacoemulsification [<a href="#B15-vision-08-00065" class="html-bibr">15</a>,<a href="#B16-vision-08-00065" class="html-bibr">16</a>,<a href="#B17-vision-08-00065" class="html-bibr">17</a>,<a href="#B18-vision-08-00065" class="html-bibr">18</a>,<a href="#B19-vision-08-00065" class="html-bibr">19</a>,<a href="#B20-vision-08-00065" class="html-bibr">20</a>,<a href="#B21-vision-08-00065" class="html-bibr">21</a>,<a href="#B22-vision-08-00065" class="html-bibr">22</a>,<a href="#B23-vision-08-00065" class="html-bibr">23</a>,<a href="#B27-vision-08-00065" class="html-bibr">27</a>,<a href="#B28-vision-08-00065" class="html-bibr">28</a>,<a href="#B29-vision-08-00065" class="html-bibr">29</a>,<a href="#B31-vision-08-00065" class="html-bibr">31</a>,<a href="#B32-vision-08-00065" class="html-bibr">32</a>,<a href="#B33-vision-08-00065" class="html-bibr">33</a>,<a href="#B34-vision-08-00065" class="html-bibr">34</a>,<a href="#B35-vision-08-00065" class="html-bibr">35</a>,<a href="#B37-vision-08-00065" class="html-bibr">37</a>,<a href="#B38-vision-08-00065" class="html-bibr">38</a>,<a href="#B39-vision-08-00065" class="html-bibr">39</a>,<a href="#B40-vision-08-00065" class="html-bibr">40</a>,<a href="#B41-vision-08-00065" class="html-bibr">41</a>,<a href="#B42-vision-08-00065" class="html-bibr">42</a>,<a href="#B43-vision-08-00065" class="html-bibr">43</a>,<a href="#B44-vision-08-00065" class="html-bibr">44</a>,<a href="#B47-vision-08-00065" class="html-bibr">47</a>,<a href="#B48-vision-08-00065" class="html-bibr">48</a>,<a href="#B50-vision-08-00065" class="html-bibr">50</a>,<a href="#B51-vision-08-00065" class="html-bibr">51</a>,<a href="#B54-vision-08-00065" class="html-bibr">54</a>,<a href="#B55-vision-08-00065" class="html-bibr">55</a>,<a href="#B56-vision-08-00065" class="html-bibr">56</a>,<a href="#B57-vision-08-00065" class="html-bibr">57</a>,<a href="#B58-vision-08-00065" class="html-bibr">58</a>,<a href="#B59-vision-08-00065" class="html-bibr">59</a>,<a href="#B60-vision-08-00065" class="html-bibr">60</a>,<a href="#B61-vision-08-00065" class="html-bibr">61</a>,<a href="#B62-vision-08-00065" class="html-bibr">62</a>,<a href="#B63-vision-08-00065" class="html-bibr">63</a>,<a href="#B64-vision-08-00065" class="html-bibr">64</a>,<a href="#B65-vision-08-00065" class="html-bibr">65</a>,<a href="#B67-vision-08-00065" class="html-bibr">67</a>,<a href="#B68-vision-08-00065" class="html-bibr">68</a>,<a href="#B69-vision-08-00065" class="html-bibr">69</a>,<a href="#B71-vision-08-00065" class="html-bibr">71</a>].</p> Full article ">Figure 8
<p>(<b>a</b>) Funnel plot for included meta-analysis studies that provided data on the change in IOP from baseline at 2-days following phacoemulsification [<a href="#B38-vision-08-00065" class="html-bibr">38</a>,<a href="#B57-vision-08-00065" class="html-bibr">57</a>,<a href="#B58-vision-08-00065" class="html-bibr">58</a>]; (<b>b</b>) Funnel plot for included meta-analysis studies that provided data on the change in IOP from baseline at 3-days following phacoemulsification [<a href="#B15-vision-08-00065" class="html-bibr">15</a>,<a href="#B18-vision-08-00065" class="html-bibr">18</a>,<a href="#B20-vision-08-00065" class="html-bibr">20</a>,<a href="#B22-vision-08-00065" class="html-bibr">22</a>,<a href="#B33-vision-08-00065" class="html-bibr">33</a>,<a href="#B34-vision-08-00065" class="html-bibr">34</a>,<a href="#B37-vision-08-00065" class="html-bibr">37</a>,<a href="#B55-vision-08-00065" class="html-bibr">55</a>,<a href="#B56-vision-08-00065" class="html-bibr">56</a>,<a href="#B57-vision-08-00065" class="html-bibr">57</a>,<a href="#B58-vision-08-00065" class="html-bibr">58</a>,<a href="#B69-vision-08-00065" class="html-bibr">69</a>]; (<b>c</b>) Funnel plot for included meta-analysis studies that provided data on the change in IOP from baseline at 7-days following phacoemulsification [<a href="#B16-vision-08-00065" class="html-bibr">16</a>,<a href="#B17-vision-08-00065" class="html-bibr">17</a>,<a href="#B19-vision-08-00065" class="html-bibr">19</a>,<a href="#B21-vision-08-00065" class="html-bibr">21</a>,<a href="#B23-vision-08-00065" class="html-bibr">23</a>,<a href="#B28-vision-08-00065" class="html-bibr">28</a>,<a href="#B32-vision-08-00065" class="html-bibr">32</a>,<a href="#B35-vision-08-00065" class="html-bibr">35</a>,<a href="#B36-vision-08-00065" class="html-bibr">36</a>,<a href="#B39-vision-08-00065" class="html-bibr">39</a>,<a href="#B40-vision-08-00065" class="html-bibr">40</a>,<a href="#B41-vision-08-00065" class="html-bibr">41</a>,<a href="#B42-vision-08-00065" class="html-bibr">42</a>,<a href="#B43-vision-08-00065" class="html-bibr">43</a>,<a href="#B44-vision-08-00065" class="html-bibr">44</a>,<a href="#B47-vision-08-00065" class="html-bibr">47</a>,<a href="#B50-vision-08-00065" class="html-bibr">50</a>,<a href="#B51-vision-08-00065" class="html-bibr">51</a>,<a href="#B54-vision-08-00065" class="html-bibr">54</a>,<a href="#B59-vision-08-00065" class="html-bibr">59</a>,<a href="#B60-vision-08-00065" class="html-bibr">60</a>,<a href="#B61-vision-08-00065" class="html-bibr">61</a>,<a href="#B63-vision-08-00065" class="html-bibr">63</a>,<a href="#B65-vision-08-00065" class="html-bibr">65</a>,<a href="#B66-vision-08-00065" class="html-bibr">66</a>,<a href="#B67-vision-08-00065" class="html-bibr">67</a>,<a href="#B68-vision-08-00065" class="html-bibr">68</a>,<a href="#B71-vision-08-00065" class="html-bibr">71</a>]; (<b>d</b>) Funnel plot for included meta-analysis studies that provided data on the change in IOP from baseline at 30-days following phacoemulsification [<a href="#B26-vision-08-00065" class="html-bibr">26</a>,<a href="#B27-vision-08-00065" class="html-bibr">27</a>,<a href="#B31-vision-08-00065" class="html-bibr">31</a>,<a href="#B38-vision-08-00065" class="html-bibr">38</a>,<a href="#B48-vision-08-00065" class="html-bibr">48</a>,<a href="#B64-vision-08-00065" class="html-bibr">64</a>].</p> Full article ">Figure 9
<p>Comparative effect size for the change in IOP from baseline at various timepoints following phacoemulsification.</p> Full article ">
Open AccessArticle
Corneal Endothelial Microscopy: Does a Manual Recognition of the Endothelial Cells Help the Morphometric Analysis Compared to a Fully Automatic Approach?
by
Giulia Carlotta Rizzo, Rosa Di Grassi, Erika Ponzini, Silvia Tavazzi and Fabrizio Zeri
Vision 2024, 8(4), 64; https://doi.org/10.3390/vision8040064 - 30 Oct 2024
Abstract
►▼
Show Figures
This study investigated whether manual integration in the recognition of the endothelial cells produces different outcomes of morphometric parameters compared to a fully automatic approach. Eight hundred and ninety endothelial images, originally acquired by the Perseus Specular Microscope (CSO, Florence, Italy), from seven
[...] Read more.
This study investigated whether manual integration in the recognition of the endothelial cells produces different outcomes of morphometric parameters compared to a fully automatic approach. Eight hundred and ninety endothelial images, originally acquired by the Perseus Specular Microscope (CSO, Florence, Italy), from seven positions of right and left corneas were selected from the database of the Research Centre in Optics and Optometry at the University of Milano-Bicocca. For each image selected, two procedures of cell identification were performed by the Perseus: an automatic identification and a manual-integrated procedure to add potential additional cells with the available editing tool. At the end of both procedures, the endothelial cell density (ECD), coefficient of variation (CV), and hexagonality (HEX) of the mosaic were calculated. The HEX in the two procedures was significantly different for all comparisons (p < 0.001), but clinically negligible. No significant differences were found for the CV and ECD in the images of both eyes irrespective of the corneal position of acquisition (except for ECD in three corneal portions, p < 0.05). To conclude, it is possible to recognise a significantly higher number of cells using the manual-integrated procedure than it is using the fully automatic one, but this does not change the morphological parameters achieved.
Full article
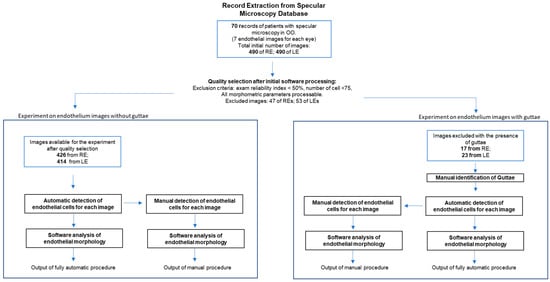
Figure 1
Figure 1
<p>Flow diagram of the study design. OO: both eyes. RE: right eye. LE: left eye.</p> Full article ">Figure 2
<p>Example of the manual editing of the image provided by the instrument.</p> Full article ">Figure 3
<p>Example of the manual guttae detection and automatic image processing, with (below) and without manual editing of the image provided by the instrument.</p> Full article ">Figure 4
<p>Bland–Altman plots of the differences between HEX (%) achieved by the fully automatic and manual procedures plotted against the mean HEX (%) between the fully automatic and manual procedures. The seven plots refer to the seven different corneal positions captured with specular microscope in the right eyes. (<b>a</b>): central (C); (<b>b</b>): inferior nasal (IN); (<b>c</b>): inferior central (I); (<b>d</b>): inferior temporal (IT); (<b>e</b>): superior temporal (ST); (<b>f</b>): superior central (SC); (<b>g</b>): superior nasal (SN). Limits of Agreement (LoA) are calculated as mean difference ± 1.96 SD of differences, Confidence interval (CI) at 95%.</p> Full article ">Figure 5
<p>Bland–Altman plots of the differences between HEX (%) achieved by the fully automatic and manual procedures plotted against the mean HEX (%) between the fully automatic and manual procedures. The seven plots refer to the seven different corneal positions captured with specular microscope in the left eyes. (<b>a</b>): central (C); (<b>b</b>): inferior nasal (IN); (<b>c</b>): inferior central (I); (<b>d</b>): inferior temporal (IT); (<b>e</b>): superior temporal (ST); (<b>f</b>): superior central (SC); (<b>g</b>): superior nasal (SN). Limits of Agreement (LoA) are calculated as mean difference ± 1.96 SD of differences, Confidence interval (CI) at 95%.</p> Full article ">Figure 6
<p>Bland–Altman plot of the differences between HEX (%) achieved by the fully automatic and manual procedures plotted against the mean HEX (%) between the fully automatic and manual procedures on images with the presence of guttae. Limits of Agreement (LoA) are calculated as mean difference ± 1.96 SD of differences, Confidence interval (CI) at 95%.</p> Full article ">
Open AccessCase Report
Combined Epiretinal Proliferation and Internal Limiting Membrane Inverted Flap for the Treatment of Large Macular Holes
by
Nikolaos Dervenis, Iordanis Vagiakis, Elena P. Papadopoulou, Panagiotis Dervenis and Teresa Sandinha
Vision 2024, 8(4), 63; https://doi.org/10.3390/vision8040063 - 19 Oct 2024
Abstract
We are presenting a new method for the treatment of large macular holes (MHs) with the use of an inverted flap consisting of both internal limiting membrane (ILM) and epiretinal proliferation (EP). A prospective interventional case series was conducted from September 2021 to
[...] Read more.
We are presenting a new method for the treatment of large macular holes (MHs) with the use of an inverted flap consisting of both internal limiting membrane (ILM) and epiretinal proliferation (EP). A prospective interventional case series was conducted from September 2021 to January 2023. MH patients with coexistent EP visualized preoperatively in macula optical coherence tomography and with a MHs minimum linear diameter larger than 400 microns underwent standard pars plana vitrectomy with the creation of an inverted petaloid flap (consisting of both ILM and EP) and gas tamponade. Sixteen eyes were included in our case series. MHs closure was successful in all the eyes with a single procedure. The preoperative minimum linear diameter was 707.63 (±164.02 μm), and the preoperative best corrected visual acuity was 1.11 ± 0.52. The postoperative BCVA was 0.51 ± 0.20 (p = 0.01) at 6 weeks postoperatively, and the final BCVA was 0.45 ± 0.20 (p = 0.008). EP can be safely combined with ILM for the creation of an inverted, petaloid flap to cover and facilitate the closure of large MHs.
Full article
(This article belongs to the Section Retinal Function and Disease)
►▼
Show Figures

Figure 1
Open AccessArticle
Comparison of Four Methods for Measuring Heterophoria and Accommodative Convergence over Accommodation Ratio
by
Noelia Nores-Palmas, Veronica Noya-Padin, Eva Yebra-Pimentel, Maria Jesus Giraldez and Hugo Pena-Verdeal
Vision 2024, 8(4), 62; https://doi.org/10.3390/vision8040062 - 18 Oct 2024
Abstract
The study aimed to assess the agreement between OptoTab SERIES, alternating Cover Test, Modified Thorington test, and Von Graefe method in measuring heterophoria and accommodative convergence over accommodation (AC/A) ratio. In an initial step, heterophoria was assessed at both distance and near in
[...] Read more.
The study aimed to assess the agreement between OptoTab SERIES, alternating Cover Test, Modified Thorington test, and Von Graefe method in measuring heterophoria and accommodative convergence over accommodation (AC/A) ratio. In an initial step, heterophoria was assessed at both distance and near in a cohort of 76 healthy young volunteers using the previously described tests. Subsequently, to determine the AC/A ratio, near-vision measurements were repeated with +1.00 D and −1.00 D lenses. All tests were performed in a randomized order across participants under consistent conditions. Significant differences were found between the Modified Thorington test and all other tests at distance (Wilcoxon test, all p ≤ 0.001) and between Von Graefe and all other tests at near (Wilcoxon test, all p ≤ 0.005). Regarding the AC/A ratio, significant differences were observed between all methods in +1.00 D AC/A ratio, except for the Modified Thorington test vs. the alternating Cover Test (Wilcoxon test, p = 0.024). In the −1.00 D AC/A ratio, differences were observed between OptoTab POCKET and all the other tests (Wilcoxon test, all p ≤ 0.001). The results indicate that all methods are interchangeable except the Modified Thorington test at distance and Von Graefe at near. For the AC/A ratio, only the Modified Thorington test is interchangeable with the alternating Cover Test using +1.00 D lenses and all are interchangeable using −1.00 D lenses except OptoTab POCKET.
Full article
(This article belongs to the Special Issue Effects of Optical and Behavioral Factors on the Ocular Accommodation Response)
►▼
Show Figures
Figure 1
Open AccessCase Report
Terson’s Syndrome with Roth Spot-Resembling Features and Third Nerve Palsy without Radiologically Diagnosed Subarachnoid Haemorrhage
by
Olga E. Makri, Iasonas K. Tsekouras, Stylianos N. Mastronikolis, Vasileios E. Panagiotopoulos, Constantine Constantoyannis and Constantinos D. Georgakopoulos
Vision 2024, 8(4), 61; https://doi.org/10.3390/vision8040061 - 7 Oct 2024
Abstract
►▼
Show Figures
We report an unusual case of pupil-involving third nerve palsy associated with Terson’s syndrome that resulted in the diagnosis of a right posterior communicating artery aneurysm. Interestingly, Terson’s syndrome presented with Roth spot-resembling features, accompanied by third nerve palsy in a patient without
[...] Read more.
We report an unusual case of pupil-involving third nerve palsy associated with Terson’s syndrome that resulted in the diagnosis of a right posterior communicating artery aneurysm. Interestingly, Terson’s syndrome presented with Roth spot-resembling features, accompanied by third nerve palsy in a patient without any disturbance of consciousness. To our knowledge, the association of Terson’s syndrome with third nerve palsy has not been described before in the absence of radiologically diagnosed subarachnoid haemorrhage. We present the case of a 48-year-old woman who presented in the Department of Emergencies of the University Hospital of Patras with right-sided complete-pupil-involving third nerve palsy combined with bilateral Terson’s syndrome. More precisely, fundoscopy revealed multiple scattered intra- and pre-retinal haemorrhages in both eyes, while some retinal haemorrhages had a white-centred pattern resembling Roth spots. Neurological examination revealed no nuchal rigidity or any other neurological signs. The Glasgow coma scale score was 15/15. A cerebral computed tomography angiography revealed a 5 mm aneurysm of the right posterior communicating artery and the patient underwent a microvascular clipping operation after craniotomy. The significant contribution of the ophthalmological consultation to the appropriate and timely diagnosis and management of a life-threatening condition is highlighted.
Full article
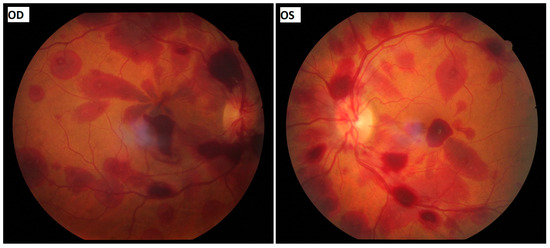
Figure 1
Open AccessArticle
Measuring the Pupillary Light Reflex Using Portable Instruments in Applied Settings
by
Nicola S. Gray, Menna Price, Jennifer Pink, Chris O’Connor, Ana Antunes and Robert J. Snowden
Vision 2024, 8(4), 60; https://doi.org/10.3390/vision8040060 - 1 Oct 2024
Abstract
►▼
Show Figures
The early components of the pupillary light reflex (PLR) are governed by the parasympathetic nervous system. The use of cheap, portable pupillometry devices may allow for the testing of parasympathetic-system health in field settings. We examined the reliability of two portable instruments for
[...] Read more.
The early components of the pupillary light reflex (PLR) are governed by the parasympathetic nervous system. The use of cheap, portable pupillometry devices may allow for the testing of parasympathetic-system health in field settings. We examined the reliability of two portable instruments for measuring the PLR and their sensitivity to individual differences known to modulate the PLR. Parameters of the PLR were measured in a community sample (N = 108) in a variety of field settings. Measurements were taken using a commercial pupillometer (NeuroLight, IDMED) and an iPhone using the Reflex Pro PLR analyser (Brightlamp). The parameters of baseline pupil diameter, constriction latency, amplitude and relative amplitude of constriction, and constriction velocity were measured. Individual differences related to age, levels of anxiety, and post-traumatic stress disorder (PTSD) symptomology were assessed. Some measures could not be attained using the iPhone under these field conditions. The reliability of the measures was high, save for the measurement of contraction latency which was particularly unreliable for the iPhone system. The parameters of the PLR showed the same internal relationships as those established in laboratory-based measurements. Age was negatively correlated with all the reliable PLR parameters for both systems. Effects of anxiety and PTSD symptomology were also apparent. The study demonstrated that a hand-held portable infrared pupillometer can be used successfully to measure the PLR parameters under field settings and can be used to examine individual differences. This may allow these devices to be used in workplaces, sports fields, roadsides, etc., to examine parasympathetic activity where needed.
Full article
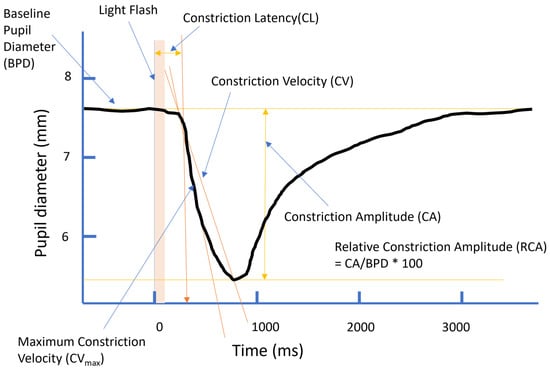
Figure 1
Open AccessArticle
Preferred Distance in Human–Drone Interaction
by
Elisabeth Maria Wögerbauer, Christoph von Castell, Robin Welsch and Heiko Hecht
Vision 2024, 8(4), 59; https://doi.org/10.3390/vision8040059 - 1 Oct 2024
Abstract
►▼
Show Figures
In two augmented-reality experiments, we transferred the paradigm of interpersonal distance regulation to human–drone interaction. In the first experiment, we used a simple spherical drone model and explored how both hovering height and approach angle affect the preferred distance. Drone height above the
[...] Read more.
In two augmented-reality experiments, we transferred the paradigm of interpersonal distance regulation to human–drone interaction. In the first experiment, we used a simple spherical drone model and explored how both hovering height and approach angle affect the preferred distance. Drone height above the ground had a strong effect. The preferred distance to the drone was larger than that typically found toward human actors, in particular, when the drone trajectory was very high. In the second experiment, we sought to gain a deeper understanding of the factors that may influence this effect. In addition to the simple spherical drone model used in the first experiment, we also varied its appearance and attachment to the ground. Surprisingly, anthropomorphic features increased preferred distances. We, therefore, discuss the extent to which social aspects and subjectively perceived danger influence the preferred distance for interaction with drones, which thus need to be considered in the design of human–drone interaction.
Full article
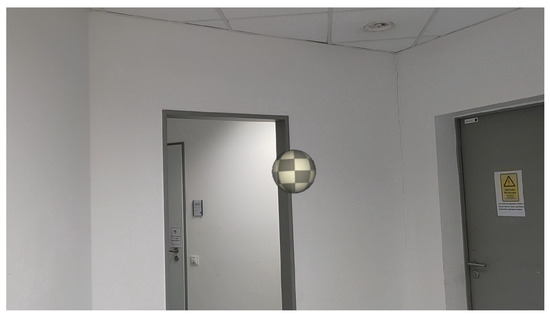
Figure 1
Figure 1
<p>Depiction of the projected drone in the room as seen through the HoloLens 2.</p> Full article ">Figure 2
<p>Experimental setup in Experiment 1. The subject stood at the marked point in the room, facing in the designated direction. The ceiling height was 3 m. The drone could be displaced along the respective marked trajectories and kept the same hovering height throughout a trial. The room was a common room/meeting area furnished with a small tea kitchen, tables, and chairs.</p> Full article ">Figure 3
<p>Procedure of the laboratory experiment.</p> Full article ">Figure 4
<p>Mean comfortable distance as a function of drone height. The grey dashed line represents the subjects’ eye level. Symbols differing in shape and color represent the approach angles. Error bars indicate ± 1 SE of the mean. The left panel (<b>a</b>) shows the averaged results of the three approach angles depicted in the right panel (<b>b</b>).</p> Full article ">Figure 5
<p>The projected drone models and the human male model in the room as seen through the HTC XR Elite: (<b>a</b>) Simple spherical form; (<b>b</b>) Variant with anthropomorphic features; (<b>c</b>) Variant with anthropomorphic features plus ground anchoring; (<b>d</b>) Human male model. All models are positioned with their anchor point at a height of 110% of eye level and at a distance of 2 m.</p> Full article ">Figure 6
<p>Experimental setup in Experiment 2. The subject stood at the marked location in the room, facing in the indicated direction. The room was a meeting room furnished with a table, chairs and writing surfaces.</p> Full article ">Figure 7
<p>Mean comfortable distance as a function of drone height. The grey dashed line represents the subjects’ eye level. Symbols differing in shape and color represent the different models. Error bars indicate ± 1 SE of the mean. The left panel (<b>a</b>) shows the averaged results of the three variants of the drone model depicted in the right panel (<b>b</b>).</p> Full article ">
Open AccessReview
The “What” and “How” of Pantomime Actions
by
Raymond R. MacNeil and James T. Enns
Vision 2024, 8(4), 58; https://doi.org/10.3390/vision8040058 - 26 Sep 2024
Abstract
►▼
Show Figures
Pantomimes are human actions that simulate ideas, objects, and events, commonly used in conversation, performance art, and gesture-based interfaces for computing and controlling robots. Yet, their underlying neurocognitive mechanisms are not well understood. In this review, we examine pantomimes through two parallel lines
[...] Read more.
Pantomimes are human actions that simulate ideas, objects, and events, commonly used in conversation, performance art, and gesture-based interfaces for computing and controlling robots. Yet, their underlying neurocognitive mechanisms are not well understood. In this review, we examine pantomimes through two parallel lines of research: (1) the two visual systems (TVS) framework for visually guided action, and (2) the neuropsychological literature on limb apraxia. Historically, the TVS framework has considered pantomime actions as expressions of conscious perceptual processing in the ventral stream, but an emerging view is that they are jointly influenced by ventral and dorsal stream processing. Within the apraxia literature, pantomimes were historically viewed as learned motor schemas, but there is growing recognition that they include creative and improvised actions. Both literatures now recognize that pantomimes are often created spontaneously, sometimes drawing on memory and always requiring online cognitive control. By highlighting this convergence of ideas, we aim to encourage greater collaboration across these two research areas, in an effort to better understand these uniquely human behaviors.
Full article
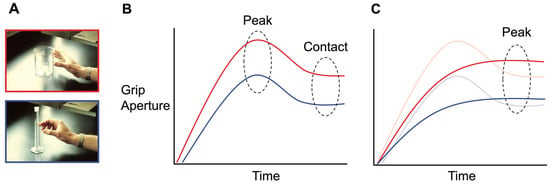
Figure 1
Figure 1
<p>Idealized representation of the kinematic differences in the aperture scaling profiles of real and pantomime grasps. (<b>A</b>) The top image (red border) depicts a power grasp on a standard-sized beaker, while the bottom image (blue border) depicts a precision grasp on a graduated cylinder beaker. (<b>B</b>) This graph represents how aperture size varies over time for real grasps. A pre-contact “grip overshoot” is reliably observed in the case of both power (red line) and precision (blue line) grasps. This functions to create a margin of safety for avoiding target collision and establishing a secure grip upon contact. Peak grip aperture is reached during this overshoot phase of grip aperture scaling. (<b>C</b>) The aperture scaling profile for pantomime grasps. The lines of the precision (blue) and power (red) grasps are overlaid with those of real grasps (transparent). In this example, we see that the grip overshoot is conspicuously absent for pantomimed grasps and that peak grip aperture is attained later in the reach trajectory.</p> Full article ">Figure 2
<p>Simplified schematic of the dual-route model of pantomime production proposed by Rothi et al. [<a href="#B146-vision-08-00058" class="html-bibr">146</a>,<a href="#B147-vision-08-00058" class="html-bibr">147</a>]. Different modalities can elicit the pantomime’s performance. The experimenter may make a verbal request—e.g., “show me how you hammer a nail”—or perform the pantomime themselves for imitation by the patient. Alternatively, the patient may have to pantomime an object’s use after it is presented in physical or pictorial form. In the case of the former, processing will usually proceed through the lexical route, allowing the retrieval of the appropriate motor schema. This may need to be mapped to knowledge about what the object is used for (i.e., action semantics). If the input is gestural, a direct route allows for “on the fly” imitation, without any semantic processing. The object recognition system allows structural knowledge to activate the appropriate motor schema in the absence of a patient being able to explicitly report on the object’s conventional function.</p> Full article ">Figure 3
<p>The Two Action Systems Plus (2AS+) model of real and pantomimed actions, based on [<a href="#B35-vision-08-00058" class="html-bibr">35</a>,<a href="#B114-vision-08-00058" class="html-bibr">114</a>,<a href="#B150-vision-08-00058" class="html-bibr">150</a>]. The dorso-dorsal channel supports grasp-to-move actions and novel tool use by providing online visual feedback of object affordances. It originates in the primary visual cortex (V1) and projects to the superior parietal lobe, where it continues to the dorsal premotor area. The ventro-dorsal channel (purple) supports real and pantomimed familiar tool use. With input originating in V1, it projects to areas in the inferior parietal lobe, including the supramarginal gyrus (SMG), and terminates in the ventral premotor area. The SMG serves as a critical hub for integrating ventral stream (red arrow) object representations and sematic knowledge with the sensorimotor processing of the ventro-dorsal and dorso-dorsal channels. The “plus” in the model refers to a circuit of reciprocal connections formed between the inferior frontal gyrus and SMG. This circuit is proposed to serve as an action selection module, resolving competing options for motor output corresponding to object transport (move, dorso-dorsal) versus function (use, ventro-dorsal).</p> Full article ">Figure 4
<p>Schematic of the working memory model of pantomime production proposed by Bartolo et al. [<a href="#B138-vision-08-00058" class="html-bibr">138</a>]. This model builds on the work of Rothi et al. [<a href="#B146-vision-08-00058" class="html-bibr">146</a>]. The authors view pantomimes as creative gestures that are formed de novo. Working memory, conceptualized as a workspace, is proposed to operate as an obligatory creative mechanism that combines sensory input (i.e., the visual or auditory action prompt), conceptual knowledge (action semantics), and procedural memory (action lexicon) to support pantomime production. The visuomotor conversion module facilitates “on-the-fly” imitation, which may or may not require working memory (reflected by dashed arrows). The model’s formulation was motivated by observations of a patient known by the initials VL. Tests of VL’s gestural ability revealed a near-selective deficit in pantomime production, while cognitive testing revealed a selective impairment in working memory. See text for additional details.</p> Full article ">Figure 5
<p>The technical reasoning (neurocognitive) model of pantomime. See text for additional details. Reproduced from Osiurak et al. [<a href="#B169-vision-08-00058" class="html-bibr">169</a>] (Creative Commons).</p> Full article ">
Open AccessArticle
Comparison between Different Visual Acuity Tests and Validation of a Digital Device
by
Blanca Montori, Teresa Pérez Roche, Maria Vilella, Estela López, Adrián Alejandre, Xian Pan, Marta Ortín, Marta Lacort and Victoria Pueyo
Vision 2024, 8(3), 57; https://doi.org/10.3390/vision8030057 - 23 Sep 2024
Abstract
►▼
Show Figures
Purpose: To compare different visual acuity (VA) tests (printed and digital, symbols and letters) and to validate a new device for VA testing called DIVE (Devices for an Integral Visual Examination). Methods: VA was tested in a wide spectrum of adult people with
[...] Read more.
Purpose: To compare different visual acuity (VA) tests (printed and digital, symbols and letters) and to validate a new device for VA testing called DIVE (Devices for an Integral Visual Examination). Methods: VA was tested in a wide spectrum of adult people with printed tests (ETDRS and LEA Symbols) and with two implemented tests in DIVE (HOTV and DIVE Symbols). We measured agreement between the different VA tests using the intraclass correlation coefficient and Bland–Altman method. In addition, we measured the repeatability of all tests. Results: Right eyes from 51 adult participants were included in the study. Correlation between tests was high (ICC from 0.95 to 0.97). Bland–Altman analysis showed good agreement among the different tests, with differences within reasonable clinical limits. However, slightly better VA values were obtained with DIVE HOTV and ETDRS, followed by LEA and DIVE Symbols. ETDRS had the best repeatability. Conclusion: The four evaluated VA tests provide comparable outcomes. In an adult sample, letter optotypes obtained better VA values than symbol optotypes. DIVE VA tests are reliable and well-correlated with printed VA tests.
Full article

Figure 1
Open AccessReview
A Systematic Review of Aphantasia: Concept, Measurement, Neural Basis, and Theory Development
by
Feiyang Jin, Shen-Mou Hsu and Yu Li
Vision 2024, 8(3), 56; https://doi.org/10.3390/vision8030056 - 22 Sep 2024
Abstract
People with aphantasia exhibit the inability to voluntarily generate or form mental imagery in their minds. Since the term “aphantasia” was proposed to describe this, it has gained increasing attention from psychiatrists, neuroscientists, and clinicians. Previous studies have mainly focused on the definition,
[...] Read more.
People with aphantasia exhibit the inability to voluntarily generate or form mental imagery in their minds. Since the term “aphantasia” was proposed to describe this, it has gained increasing attention from psychiatrists, neuroscientists, and clinicians. Previous studies have mainly focused on the definition, prevalence, and measurement of aphantasia, its impacts on individuals’ cognitive and emotional processing, and theoretical frameworks synthesizing existing findings, which have contributed greatly to our understanding of aphantasia. However, there are still some debates regarding the conclusions derived from existing research and the theories that were constructed from various sources of evidence. Building upon existing endeavors, this systematic review emphasizes that future research is much needed to refine the definition and diagnosis of aphantasia, strengthen empirical investigations at behavioral and neural levels, and, more importantly, develop or update theories. These multiple lines of efforts could lead to a deeper understanding of aphantasia and further guide researchers in future research directions.
Full article
(This article belongs to the Special Issue Visual Mental Imagery System: How We Image the World)
►▼
Show Figures
Figure 1
Open AccessArticle
Analysis of Deposition and Diffusion of Cholesterol in Silicone Hydrogel Contact Lenses Using Confocal Microscopy
by
Tomasz Suliński, Natalia Nowak, Jędrzej Szymański and Jacek Pniewski
Vision 2024, 8(3), 55; https://doi.org/10.3390/vision8030055 - 20 Sep 2024
Abstract
In this study, we investigated lipid deposition and diffusion in silicone hydrogel (Si-Hy) contact lenses using confocal microscopy. Different Si-Hy lenses were analyzed to understand the interaction patterns of cholesterol with various lens materials. The results highlight significant differences in the deposition and
[...] Read more.
In this study, we investigated lipid deposition and diffusion in silicone hydrogel (Si-Hy) contact lenses using confocal microscopy. Different Si-Hy lenses were analyzed to understand the interaction patterns of cholesterol with various lens materials. The results highlight significant differences in the deposition and diffusion of lipids through the lenses, revealing that some materials, such as comfilcon A, allow lipids to diffuse more freely compared to others, such as samfilcon A, which provides a greater barrier. The study also observed different morphology and movement of lipid agglomerates across the lenses and above it surfaces. These findings contribute to the understanding of lipid–lens interaction, which is important for the development of lenses with improved comfort and functionality. The research highlights the importance of considering lipid interactions in the design and selection of Si-Hy contact lenses to enhance wearer comfort and lens performance.
Full article
(This article belongs to the Special Issue Selected Papers from the 4th International Symposium on Visual Physiology, Environment, and Perception (VisPEP 2024))
►▼
Show Figures
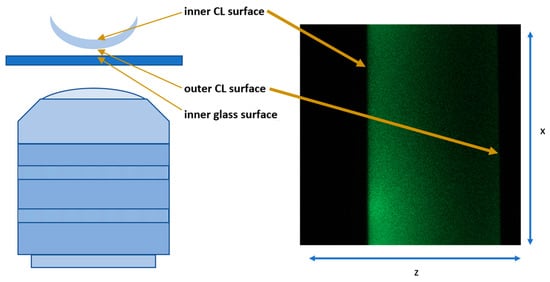
Figure 1
Figure 1
<p>(<b>left</b>) Schematic of the microscope and samples setup, (<b>right</b>) an example of the output image.</p> Full article ">Figure 2
<p>(<b>a</b>) xz and (<b>b</b>) xyz images of a CL made from senofilcon A.</p> Full article ">Figure 3
<p>(<b>a</b>) xz and (<b>b</b>) xyz images of a CL made from lotrafilcon B.</p> Full article ">Figure 4
<p>(<b>a</b>) xz and (<b>b</b>) xyz images of a CL made from comfilcon A.</p> Full article ">Figure 5
<p>(<b>a</b>) xz and (<b>b</b>) xyz images of a CL made from Samfilcon A.</p> Full article ">Figure 6
<p>Senofilcon A. Four frames from the senofilcon A lens video representing four xy scans at different positions (z) and after different times from the start of the measurement (t).</p> Full article ">
Open AccessSystematic Review
Intraocular Pressure (IOP) in Patients with Acromegaly versus Healthy Controls: A Systematic Review and Meta-Analysis
by
Anna M. Kober and Maria Sobol
Vision 2024, 8(3), 54; https://doi.org/10.3390/vision8030054 - 12 Sep 2024
Abstract
►▼
Show Figures
Purpose. Acromegaly is an uncommon condition but affects numerous organ systems. It has been found that patients with acromegaly can experience ocular changes, such as raised intraocular pressure (IOP). Numerous studies have since been carried out to determine whether there is a significant
[...] Read more.
Purpose. Acromegaly is an uncommon condition but affects numerous organ systems. It has been found that patients with acromegaly can experience ocular changes, such as raised intraocular pressure (IOP). Numerous studies have since been carried out to determine whether there is a significant difference between IOP in patients with acromegaly and healthy controls and there is much disagreement in the literature. This study aims to perform a systematic review and meta-analysis to establish whether there is a significant difference in IOP between the two groups in a larger population. Methods. A systematic literature search was performed using PubMed, Scopus, and Web of Science to access relevant databases and to locate outcome studies. Eligibility criteria included type of publication, participant characteristics, and report of outcomes. Data analysis was conducted with a fixed-effects model. Results. Three articles were included in the final analysis. The mean value of IOP corrected for central corneal thickness (IOPcc) for the group of 102 patients with acromegaly was 15.33 with confidence levels of 13.05–17.62 [mmHg]. The mean difference between the control and acromegaly group was 1.17 with confidence levels of 0.64 to 1.70 [mmHg], which was found to be statistically significant (p < 0.001). Conclusion. The results of the meta-analysis indicate that acromegaly is associated with increased IOP. As raised IOP is a risk factor for the development of glaucoma, detailed IOPcc evaluation should be an important procedure in the follow-up visits of patients with acromegaly.
Full article
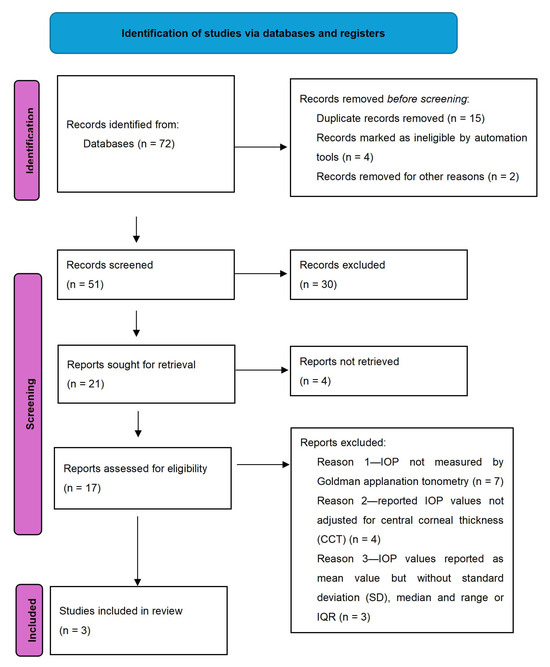
Figure 1
Figure 1
<p>Flow chart for inclusion of articles.</p> Full article ">Figure 2
<p>Forest plot of IOPcc for patients with acromegaly, <span class="html-italic">p</span> value indicating level of statistical significance. The size of the box represents the point estimate for each study in the forest plot and is proportional to that study’s weight-estimate contribution to the summary estimate. Horizontal lines represent 95% CI.</p> Full article ">Figure 3
<p>Forest plot of mean difference of IOPcc between acromegaly and control group, <span class="html-italic">p</span> value indicating level of statistical significance. The size of the box represents the point estimate for each study in the forest plot and is proportional to that study’s weight-estimate contribution to the summary estimate. Horizontal lines represent 95% CI.</p> Full article ">Figure 4
<p>Sensitivity analysis for the effect of individual studies on the pooled difference of IOP<sub>CCT</sub> with confidence intervals. The named study on the Y-axis is omitted from the analysis to assess the effect it has on the overall results.</p> Full article ">
Open AccessArticle
Colour Vision Changes across Lifespan: Insights from FM100 and CAD Tests
by
Renārs Trukša, Sergejs Fomins, Zane Jansone-Langina and Laura Tenisa
Vision 2024, 8(3), 53; https://doi.org/10.3390/vision8030053 - 6 Sep 2024
Abstract
(1) Background: in this research study, colour vision was evaluated in individuals aged 19 to 70 years with and without red–green colour vision disorders. (2) Methods: study participant colour vision was assessed with anomaloscope, HRR, FM100 hue, and CAD tests. (3) Results: No
[...] Read more.
(1) Background: in this research study, colour vision was evaluated in individuals aged 19 to 70 years with and without red–green colour vision disorders. (2) Methods: study participant colour vision was assessed with anomaloscope, HRR, FM100 hue, and CAD tests. (3) Results: No significant correlation was found between participant age and chromatic sensitivity of the red–green colour opponent channel. However, a decrease in blue–yellow colour opponent channel chromatic sensitivity was confirmed with the FM100 hue test and CAD test. Analysis of FM100 hue test error scores across age groups revealed a decline in chromatic sensitivity in the short-wave region of visible light with increasing age. Comparison of the colour-deficient individual results of the CAD and anomaloscope tests confirmed that CAD test sensitivity and specificity reaches 100%. However, some individuals with deutan-type deficits were misclassified as having protan-type deficits. This study confirmed the effectiveness of the FM100 test in identifying individuals with moderate to severe colour vision deficits, with sensitivity and specificity rates of 81.25% and 95.38%. (4) Conclusions: It was found that the FM100 hue test effectively identifies individuals with moderate and severe red–green colour vision deficiencies. On the other hand, individuals with mild colour vision deficiencies may go undetected with the FM100 hue test.
Full article
(This article belongs to the Special Issue Selected Papers from the 4th International Symposium on Visual Physiology, Environment, and Perception (VisPEP 2024))
►▼
Show Figures
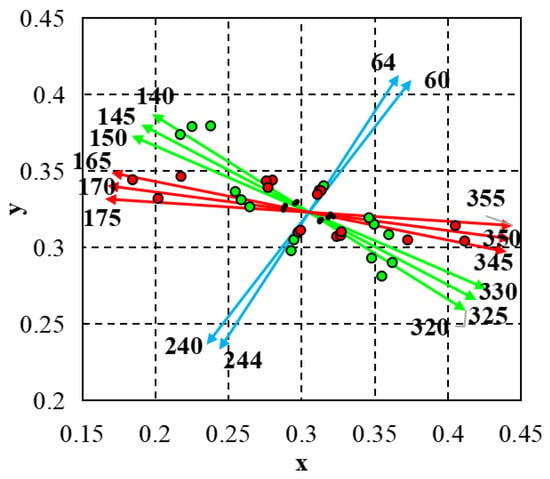
Figure 1
Figure 1
<p>CAD test colour directions. Average chromatic thresholds of normal trichromats (see black dots), moderate protan (see red dots), and deutan (see green dots) chromatic thresholds. Red, green, and blue arrows represent the directions in colour space where chromatic stimuli are primarily detected by L, M, and S cones, respectively.</p> Full article ">Figure 2
<p>In graphs (<b>a</b>,<b>b</b>) the relationships between study participants age and chromatic sensitivity thresholds RG and BY are presented.</p> Full article ">Figure 3
<p>(<b>a</b>)—study participant TES, RG, and BY scores. (<b>b</b>)—FM100 hue test colour cap coordinates and colour categories.</p> Full article ">Figure 4
<p>This study examined the partial error scores of research participants across 10 colour categories in the FM100 hue test. Analysis of the data revealed a notable trend wherein participants displayed an increase in errors within the short-wave spectrum of visible light as their age increased. This observation suggests a potential age-related decline in colour discrimination ability, particularly in the perception of colours within the blue and violet range.</p> Full article ">Figure 5
<p>(<b>a</b>)—displays the partial error scores of individuals with red–green colour vision deficiency, protan (represented by red bars) and deutan (represented by green bars). (<b>b</b>)—illustrates the ROC function of the FM100 hue test.</p> Full article ">
Open AccessArticle
Microcystic Macular Edema Caused by Non-Glaucomatous Optic Atrophy: A Single-Center, Retrospective, Cohort Study in France
by
Tibaut Coutureau, Jacqueline Butterworth, Damien Biotti, Pierre Fournié, Vincent Soler and Fanny Varenne
Vision 2024, 8(3), 52; https://doi.org/10.3390/vision8030052 - 6 Sep 2024
Abstract
Optic Atrophy (OA) can be associated with the development of microcystic macular edema (MME) in the perifoveal retinal inner nuclear layer (INL). We aimed here to retrospectively determine the prevalence of MME in patients with non-glaucomatous OA in our tertiary ophthalmology department between
[...] Read more.
Optic Atrophy (OA) can be associated with the development of microcystic macular edema (MME) in the perifoveal retinal inner nuclear layer (INL). We aimed here to retrospectively determine the prevalence of MME in patients with non-glaucomatous OA in our tertiary ophthalmology department between 2015 and 2020. We then examined how MME affected the thicknesses of the different retinal layers and the differences in demographic and clinical characteristics between those patients who developed MME and those who did not. A total of 643 eyes (429 patients) were included (mean age 45.9 ± 17.8 years, 52% female). MME developed in 95 (15%) eyes and across all etiologies of OA except for toxic/nutritional causes, but the prevalence of MME varied between the different etiologies. The development of MME was associated with thinning of the ganglion cell layer (11.0 vs. 9.6 μm; p = 0.001) and the retinal nerve fiber layer (10.1 vs. 9.15 μm; p = 0.024), with INL thickening in the 3- and 6-mm diameter areas of the central fovea. Patients developing MME had significantly worse distance best-corrected visual acuity than those not developing MME (0.62 vs. 0.38 logMAR; p = 0.002). Overall, the presence of MME in OA cannot be used to guide the diagnostic work-up of OA.
Full article
(This article belongs to the Section Retinal Function and Disease)
►▼
Show Figures
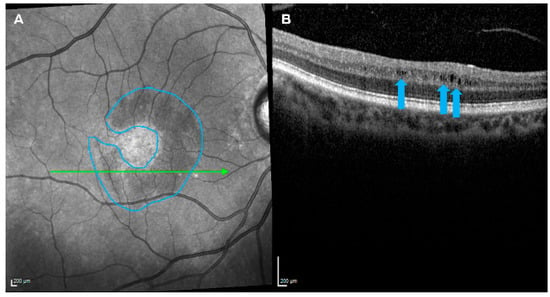
Figure 1
Figure 1
<p>The development of microcystic macular edema in a patient with optic atrophy. A hyporeflective, perifoveal, crescent-shaped lesion (blue outline) was detected by near-infrared reflectance imaging (<b>A</b>) and found composed of hyporeflective cystoid grooves within the retinal inner nuclear layer (blue arrows) by optical coherence tomography imaging (<b>B</b>).</p> Full article ">
<p>The development of microcystic macular edema in a patient with optic atrophy. A hyporeflective, perifoveal, crescent-shaped lesion (blue outline) was detected by near-infrared reflectance imaging (<b>A</b>) and found composed of hyporeflective cystoid grooves within the retinal inner nuclear layer (blue arrows) by optical coherence tomography imaging (<b>B</b>).</p> Full article ">
Open AccessArticle
Objective Refraction Status before and after Cycloplegia: From Childhood to Young Adulthood
by
Karola Panke and Megija Jorova
Vision 2024, 8(3), 51; https://doi.org/10.3390/vision8030051 - 30 Aug 2024
Abstract
This study aimed to evaluate the clinical information revealed after cycloplegia and assess how age and non-cycloplegic refractive status influence the classification of types of refractive error, as well as the relationship between age and cycloplegia-induced changes in the power of refractive errors.
[...] Read more.
This study aimed to evaluate the clinical information revealed after cycloplegia and assess how age and non-cycloplegic refractive status influence the classification of types of refractive error, as well as the relationship between age and cycloplegia-induced changes in the power of refractive errors. We analysed the records of 472 non-population-based ophthalmology practice patients aged 3–28 years (mean ± SD: 9.1 ± 4.6). Cycloplegia was induced with one drop of cyclopentolate 1% in each eye, and eye refraction was measured 30 ± 5 min later using an objective autorefractometer. Cycloplegia induced a clinically significant (≥0.50 D) hyperopic shift in the spherical equivalent of 60.2% of participants and a myopic shift in 1%, resulting in a 34.1% increase in the frequency of participants with hyperopia, while the frequency of those with myopia and emmetropia decreased by 5.5% and 23.3%, respectively. The average spherical equivalent difference (mean ± SD) induced by cycloplegia was 0.72 ± 0.73 D, with the highest difference observed in the 3–5 years age group (1.18 ± 0.85 D). The differences in astigmatism power (p = 0.84) and astigmatism axis (p = 0.97) between non-cycloplegic and cycloplegic conditions were not statistically significant.
Full article
(This article belongs to the Special Issue Selected Papers from the 4th International Symposium on Visual Physiology, Environment, and Perception (VisPEP 2024))
►▼
Show Figures
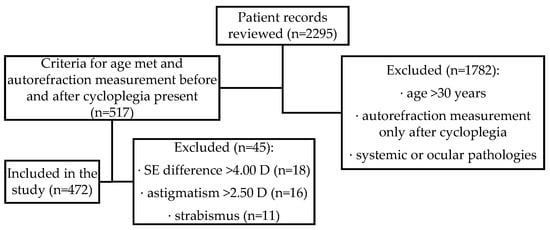
Figure 1
Figure 1
<p>Flowchart of the patient record review process representing participant selection.</p> Full article ">Figure 2
<p>Frequency of cycloplegic eye refractive status stratified by age.</p> Full article ">Figure 3
<p>Frequency of refractive errors in different age groups before (dotted line: non-cycloplegic) and after (solid line: cycloplegic) cycloplegia: (<b>a</b>) Frequency of hyperopia, (<b>b</b>) Frequency of myopia, (<b>c</b>) Frequency of emmetropia, and (<b>d</b>) Frequency of astigmatism.</p> Full article ">Figure 4
<p>Difference between non-cycloplegic and cycloplegic condition determined by spherical equivalent (SE) change stratified by age group. The mean SE difference after cycloplegia is shown as ×, and the median is represented as a line inside the box. The whiskers extend from the top of the box (Q3) to the largest data point ≤ 1.5 times the IQR and from the bottom of the box (Q1) to the smallest data point > 1.5 times the IQR.</p> Full article ">Figure 5
<p>The total occurrence of clinically significant astigmatism (>0.50 D) is represented by a dashed line (n = 128, 27%). The 100% stacked column chart displays the frequency of the clinically significant astigmatism axis in the cycloplegic condition stratified by age.</p> Full article ">
Open AccessArticle
Bridging a Gap in Coherence: The Coordination of Comprehension Processes When Viewing Visual Narratives
by
Maverick E. Smith, John P. Hutson, Mi’Kayla Newell, Dimitri Wing-Paul, Kathryn S. McCarthy, Lester C. Loschky and Joseph P. Magliano
Vision 2024, 8(3), 50; https://doi.org/10.3390/vision8030050 - 30 Aug 2024
Abstract
►▼
Show Figures
Scene Perception and Event Comprehension Theory (SPECT) posits that understanding picture stories depends upon a coordination of two processes: (1) integrating new information into the current event model that is coherent with it (i.e., mapping) and (2) segmenting experiences into distinct event models
[...] Read more.
Scene Perception and Event Comprehension Theory (SPECT) posits that understanding picture stories depends upon a coordination of two processes: (1) integrating new information into the current event model that is coherent with it (i.e., mapping) and (2) segmenting experiences into distinct event models (i.e., shifting). In two experiments, we investigated competing hypotheses regarding how viewers coordinate the mapping process of bridging inference generation and the shifting process of event segmentation by manipulating the presence/absence of Bridging Action pictures (i.e., creating coherence gaps) in wordless picture stories. The Computational Effort Hypothesis says that experiencing a coherence gap prompts event segmentation and the additional computational effort to generate bridging inferences. Thus, it predicted a positive relationship between event segmentation and explanations when Bridging Actions were absent. Alternatively, the Coherence Gap Resolution Hypothesis says that experiencing a coherence gap prompt generating a bridging inference to close the gap, which obviates segmentation. Thus, it predicted a negative relationship between event segmentation and the production of explanations. Replicating prior work, viewers were more likely to segment and generate explanations when Bridging Action pictures were absent than when they were present. Crucially, the relationship between explanations and segmentation was negative when Bridging Action pictures were absent, consistent with the Coherence Gap Resolution Hypothesis. Unexpectedly, the relationship was positive when Bridging Actions were present. The results are consistent with SPECT’s assumption that mapping and shifting processes are coordinated, but how they are coordinated depends upon the experience of a coherence gap.
Full article
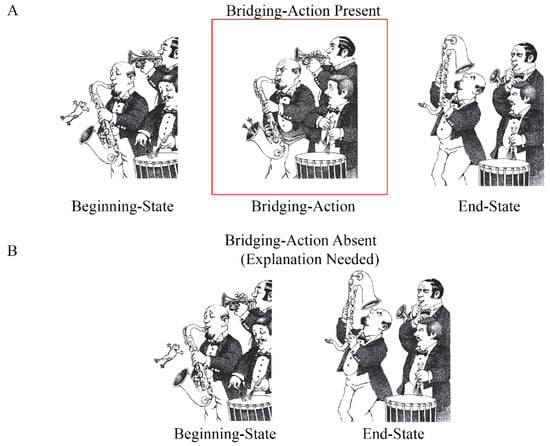
Figure 1
Figure 1
<p>Illustration of the experimental manipulation. This target episode came from <span class="html-italic">Frog goes to dinner</span> [<a href="#B6-vision-08-00050" class="html-bibr">6</a>], which was used in the present study. (<b>A</b>) shows the Bridging-Action present condition and (<b>B</b>) shows the Bridging-Action absent condition.</p> Full article ">Figure 2
<p>Probability of segmenting (<b>A</b>) and viewing times (<b>B</b>) on End State pictures. Bars show the means estimated from mixed-effects models. Error bars correspond to 1 ± standard error from the estimated means.</p> Full article ">Figure 3
<p>Probability of identifying the End State picture as an event boundary when the Bridging Action was absent or present as a function of the frequencies of (<b>A</b>) explanations and (<b>B</b>) picture paraphrasing. Dots represent the proportion of participants who identified each picture as the start of a new event. The black circles drawn around the two data points in each panel correspond to the target episodes shown in <a href="#vision-08-00050-f001" class="html-fig">Figure 1</a> and <a href="#vision-08-00050-f004" class="html-fig">Figure 4</a>. The lines are estimates from mixed-effects models. Error ribbons correspond to 1 ± standard error.</p> Full article ">Figure 4
<p>Example episode containing a Beginning State, a Bridging Action, and an End State picture. This target episode came from <span class="html-italic">One frog too many</span> [<a href="#B42-vision-08-00050" class="html-bibr">42</a>],which was used in the present study. (<b>A</b>) shows the Bridging-Action present condition and (<b>B</b>) shows the Bridging-Action absent condition.</p> Full article ">
Open AccessArticle
A Multi Comparison of 8 Different Intraocular Lens Biometry Formulae, Including a Machine Learning Thin Lens Formula (MM) and an Inbuilt Anterior Segment Optical Coherence Tomography Ray Tracing Formula
by
Richard N. McNeely, Katherine McGinnity, Stephen Stewart, Emmanuel Eric Pazo, Salissou Moutari and Jonathan E. Moore
Vision 2024, 8(3), 49; https://doi.org/10.3390/vision8030049 - 28 Aug 2024
Abstract
A comparison of the accuracy of intraocular lens (IOL) power calculation formulae, including SRK/T, HofferQ, Holladay 1, Haigis, MM, Barrett Universal II (BUII), Emmetropia Verifying Optical (EVO), and AS-OCT ray tracing, was performed. One hundred eyes implanted with either the Rayone EMV RAO200E
[...] Read more.
A comparison of the accuracy of intraocular lens (IOL) power calculation formulae, including SRK/T, HofferQ, Holladay 1, Haigis, MM, Barrett Universal II (BUII), Emmetropia Verifying Optical (EVO), and AS-OCT ray tracing, was performed. One hundred eyes implanted with either the Rayone EMV RAO200E (Rayner Intraocular Lenses Limited, Worthing, UK) or the Artis Symbiose (Cristalens Industrie, Lannion, France) IOL were included. Biometry was obtained using IOLMaster 700 (Carl Zeiss Meditec AG, Jena, Germany) and MS-39 AS-OCT (CSO, Firenze, Italy). Mean (MAE) and median (MedAE) absolute errors and percentage of eyes within ±0.25D, ±0.50D, ±0.75D, and ±1.00D of the target were compared, with ±0.75D considered a key metric. The highest percentage within ±0.75D was found with MM (96%) followed by the Haigis (94%) for the enhanced monofocal IOL. SRK/T (94%) had the highest percentage within ±0.75D, followed by Holladay 1, MM, BUII, and ray tracing (all 90%) for the multifocal IOL. No statistically significant difference in MAE was found with both IOLs. EVO showed the lowest MAE for the enhanced monofocal and ray tracing for the multifocal IOL. EVO and ray tracing showed the lowest MedAE for the two respective IOLs. A similar performance with high accuracy across formulae was found. MM and ray tracing appear to have similar accuracy to the well-established formulae and displayed a high percentage of eyes within ±0.75D.
Full article
Highly Accessed Articles
Latest Books
E-Mail Alert
News
Topics
Conferences
Special Issues
Special Issue in
Vision
Eye and Head Movements in Visuomotor Tasks
Guest Editor: Nicklaus FogtDeadline: 31 December 2024
Special Issue in
Vision
Effects of Optical and Behavioral Factors on the Ocular Accommodation Response
Guest Editors: Beatriz Redondo Cabrera, Niall HynesDeadline: 31 January 2025
Special Issue in
Vision
Visual Mental Imagery System: How We Image the World
Guest Editor: David F. MarksDeadline: 28 February 2025
