[go: up one dir, main page]
More Web Proxy on the site http://driver.im/
data visualization solutions Chart Design

Discover our no-coding tools to design beautiful, pixel-perfect charts and graphs.

Discover our no-coding tools to design beautiful, pixel-perfect charts and graphs.
Design without limitations - Make an impact with data. Datylon gives you chart design tools with powerful styling properties equal to none. Every relevant property of a data point can be changed individually, allowing you to highlight the gems in your data and engage in data storytelling.

Design without limitations

Make an impact with data. Datylon for Illustrator is a chart design tool with powerful styling properties equal to none. Every relevant property of a data point can be changed individually, allowing you to highlight the gems in your data and engage in data storytelling.

Make charts beautiful again - Stand out from the crowd! Boost your dataviz power with a set of unrivaled chart design features. Use Datylon to supercharge your data visualization projects and truly impress your audience.

Make charts beautiful again

Stand out from the crowd! Boost your dataviz power with a set of unrivaled chart design features. Use Datylon for illustrator or Datylon Report Studio to supercharge your data visualization projects and truly impress your audience.

Break your team silos - Increase efficiency and save loads of time. Build your own collection of on-brand chart templates and feed them with new data with the click of a button to create new charts. Easily adapt those charts to fit a new design or layout.

Break your team silos

Increase efficiency and save loads of time. Build your own collection of on-brand chart templates and feed them with new data with the click of a button to create new charts. Easily adapt those charts to fit a new design or layout.

Design tools for charts & reports
Our robust tools can transform your numbers into visually stunning, compelling, and engaging data stories. Start building engaging data visualizations today.
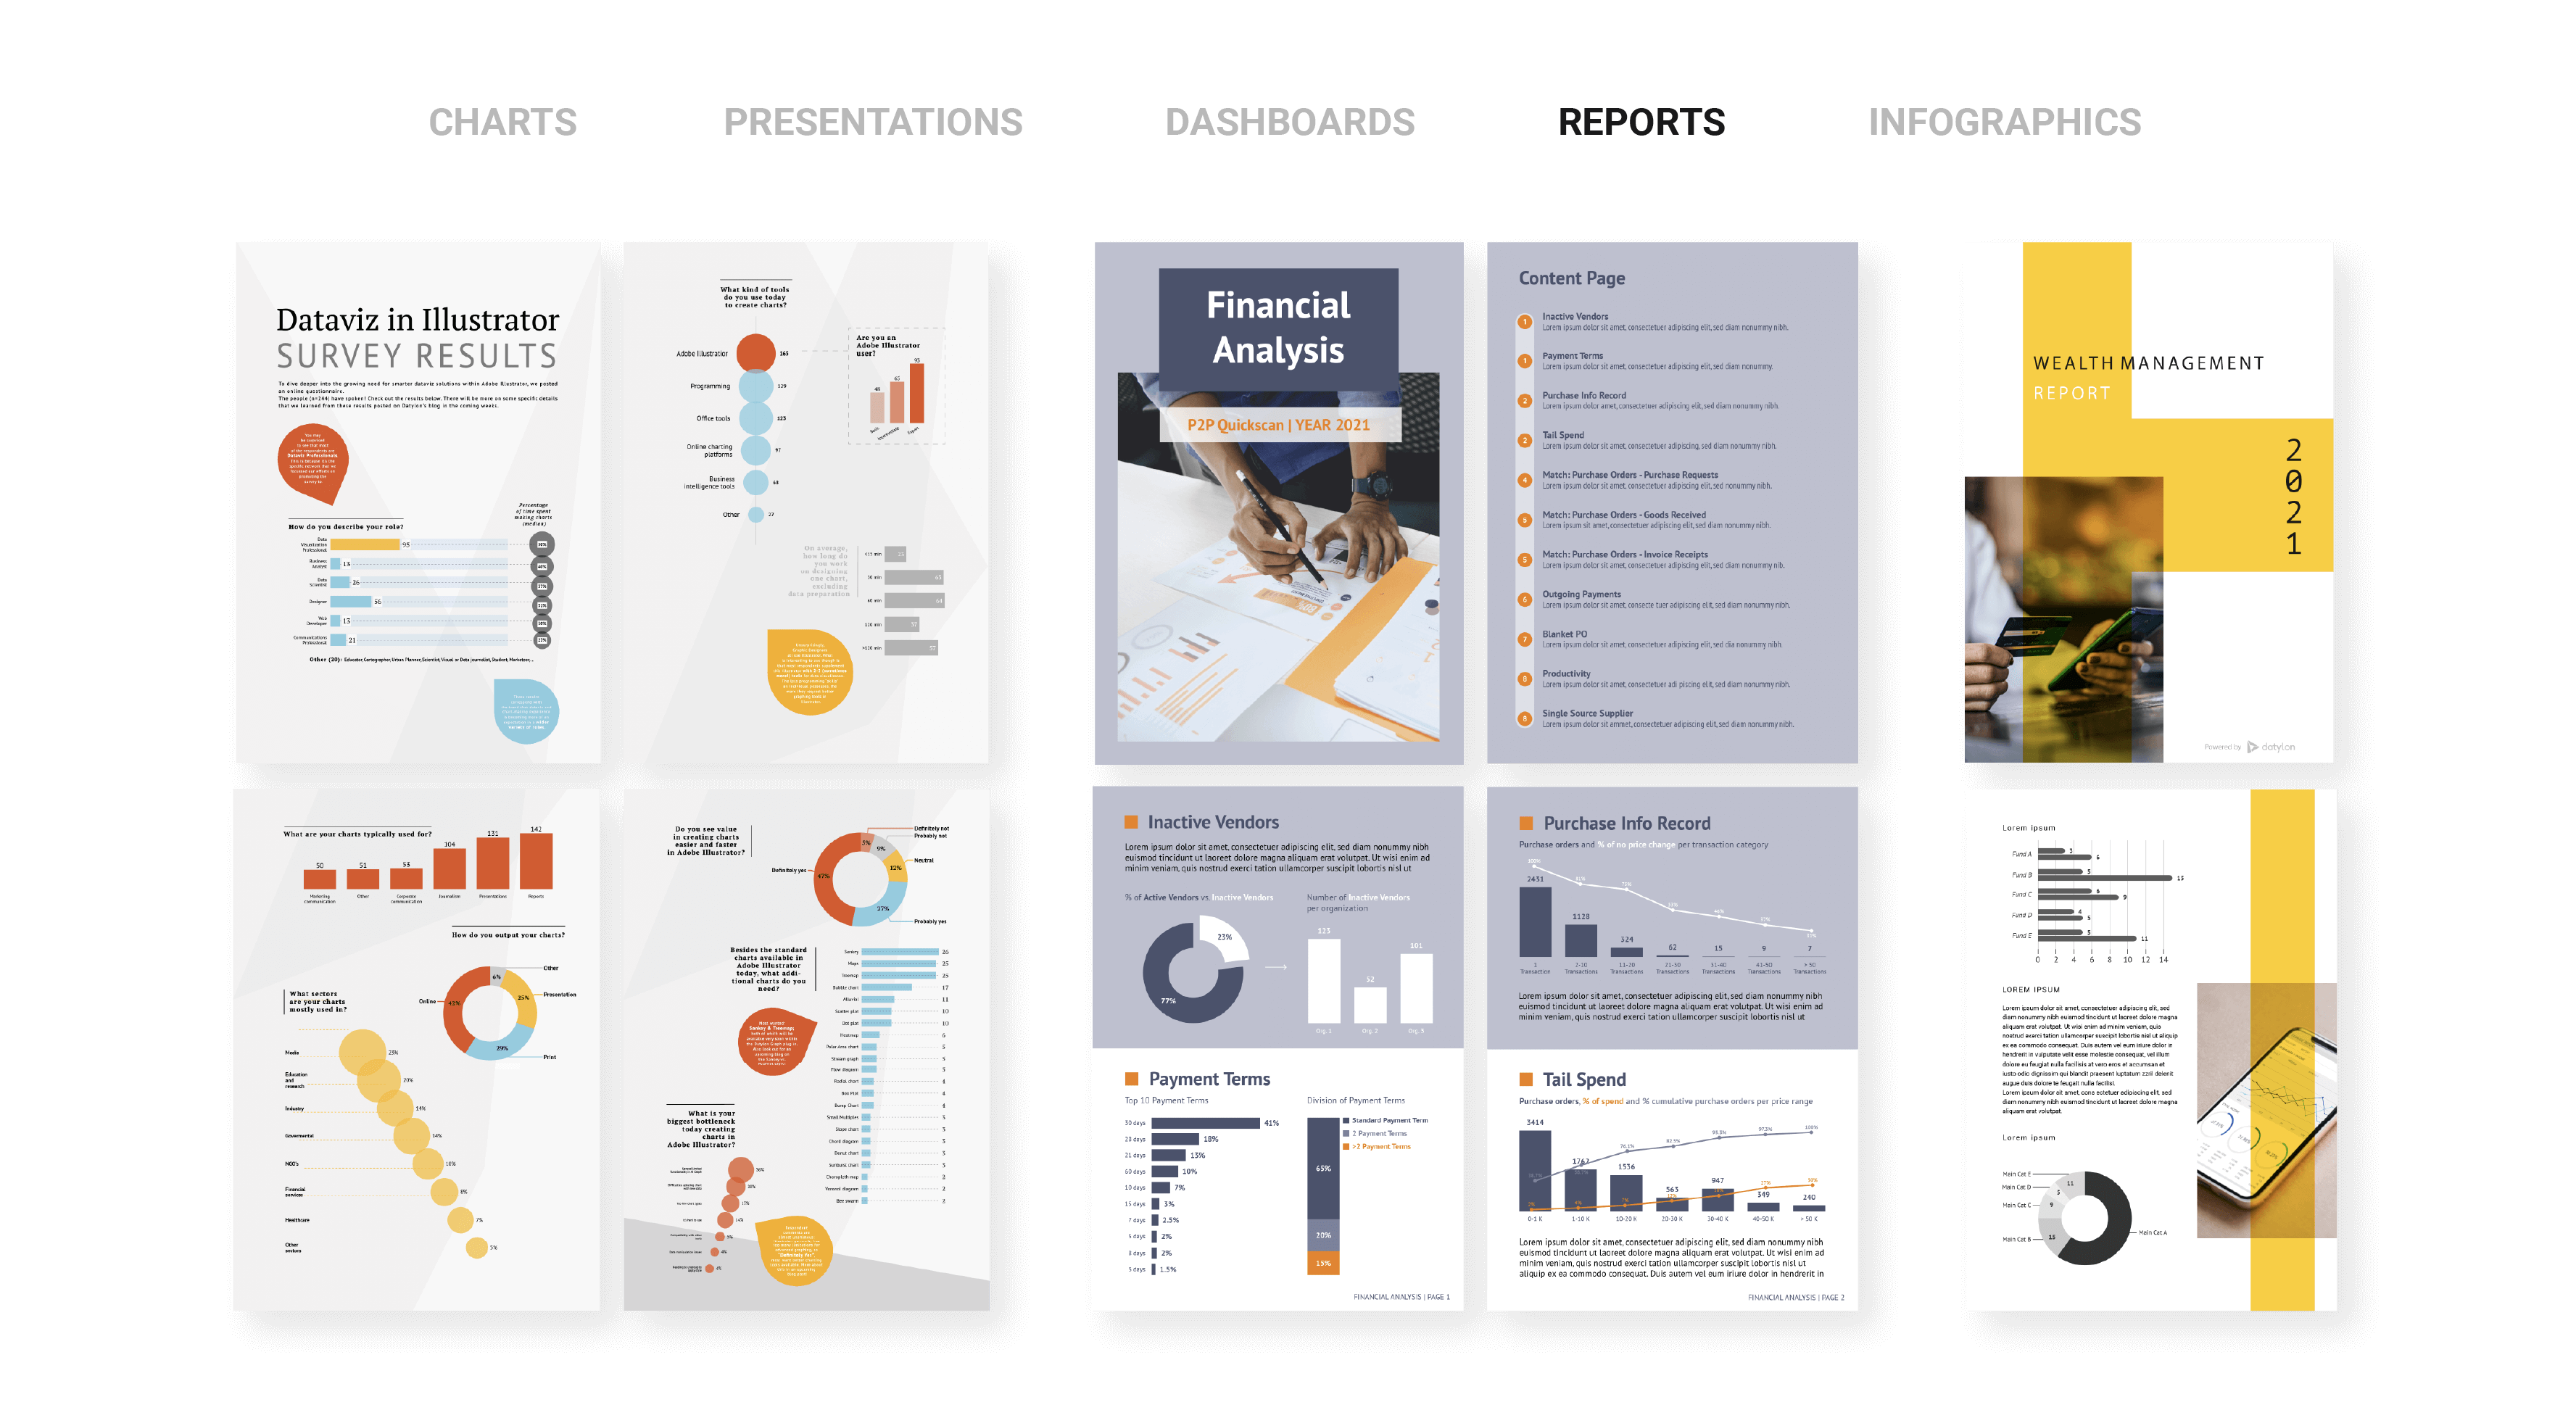
Try Datylon for Illustrator - our robust plugin for Adobe Illustrator to design the most beautiful charts and reports.
Datylon for Illustrator

Design beautiful charts and report templates right within Adobe Illustrator.

Discover the plug-in
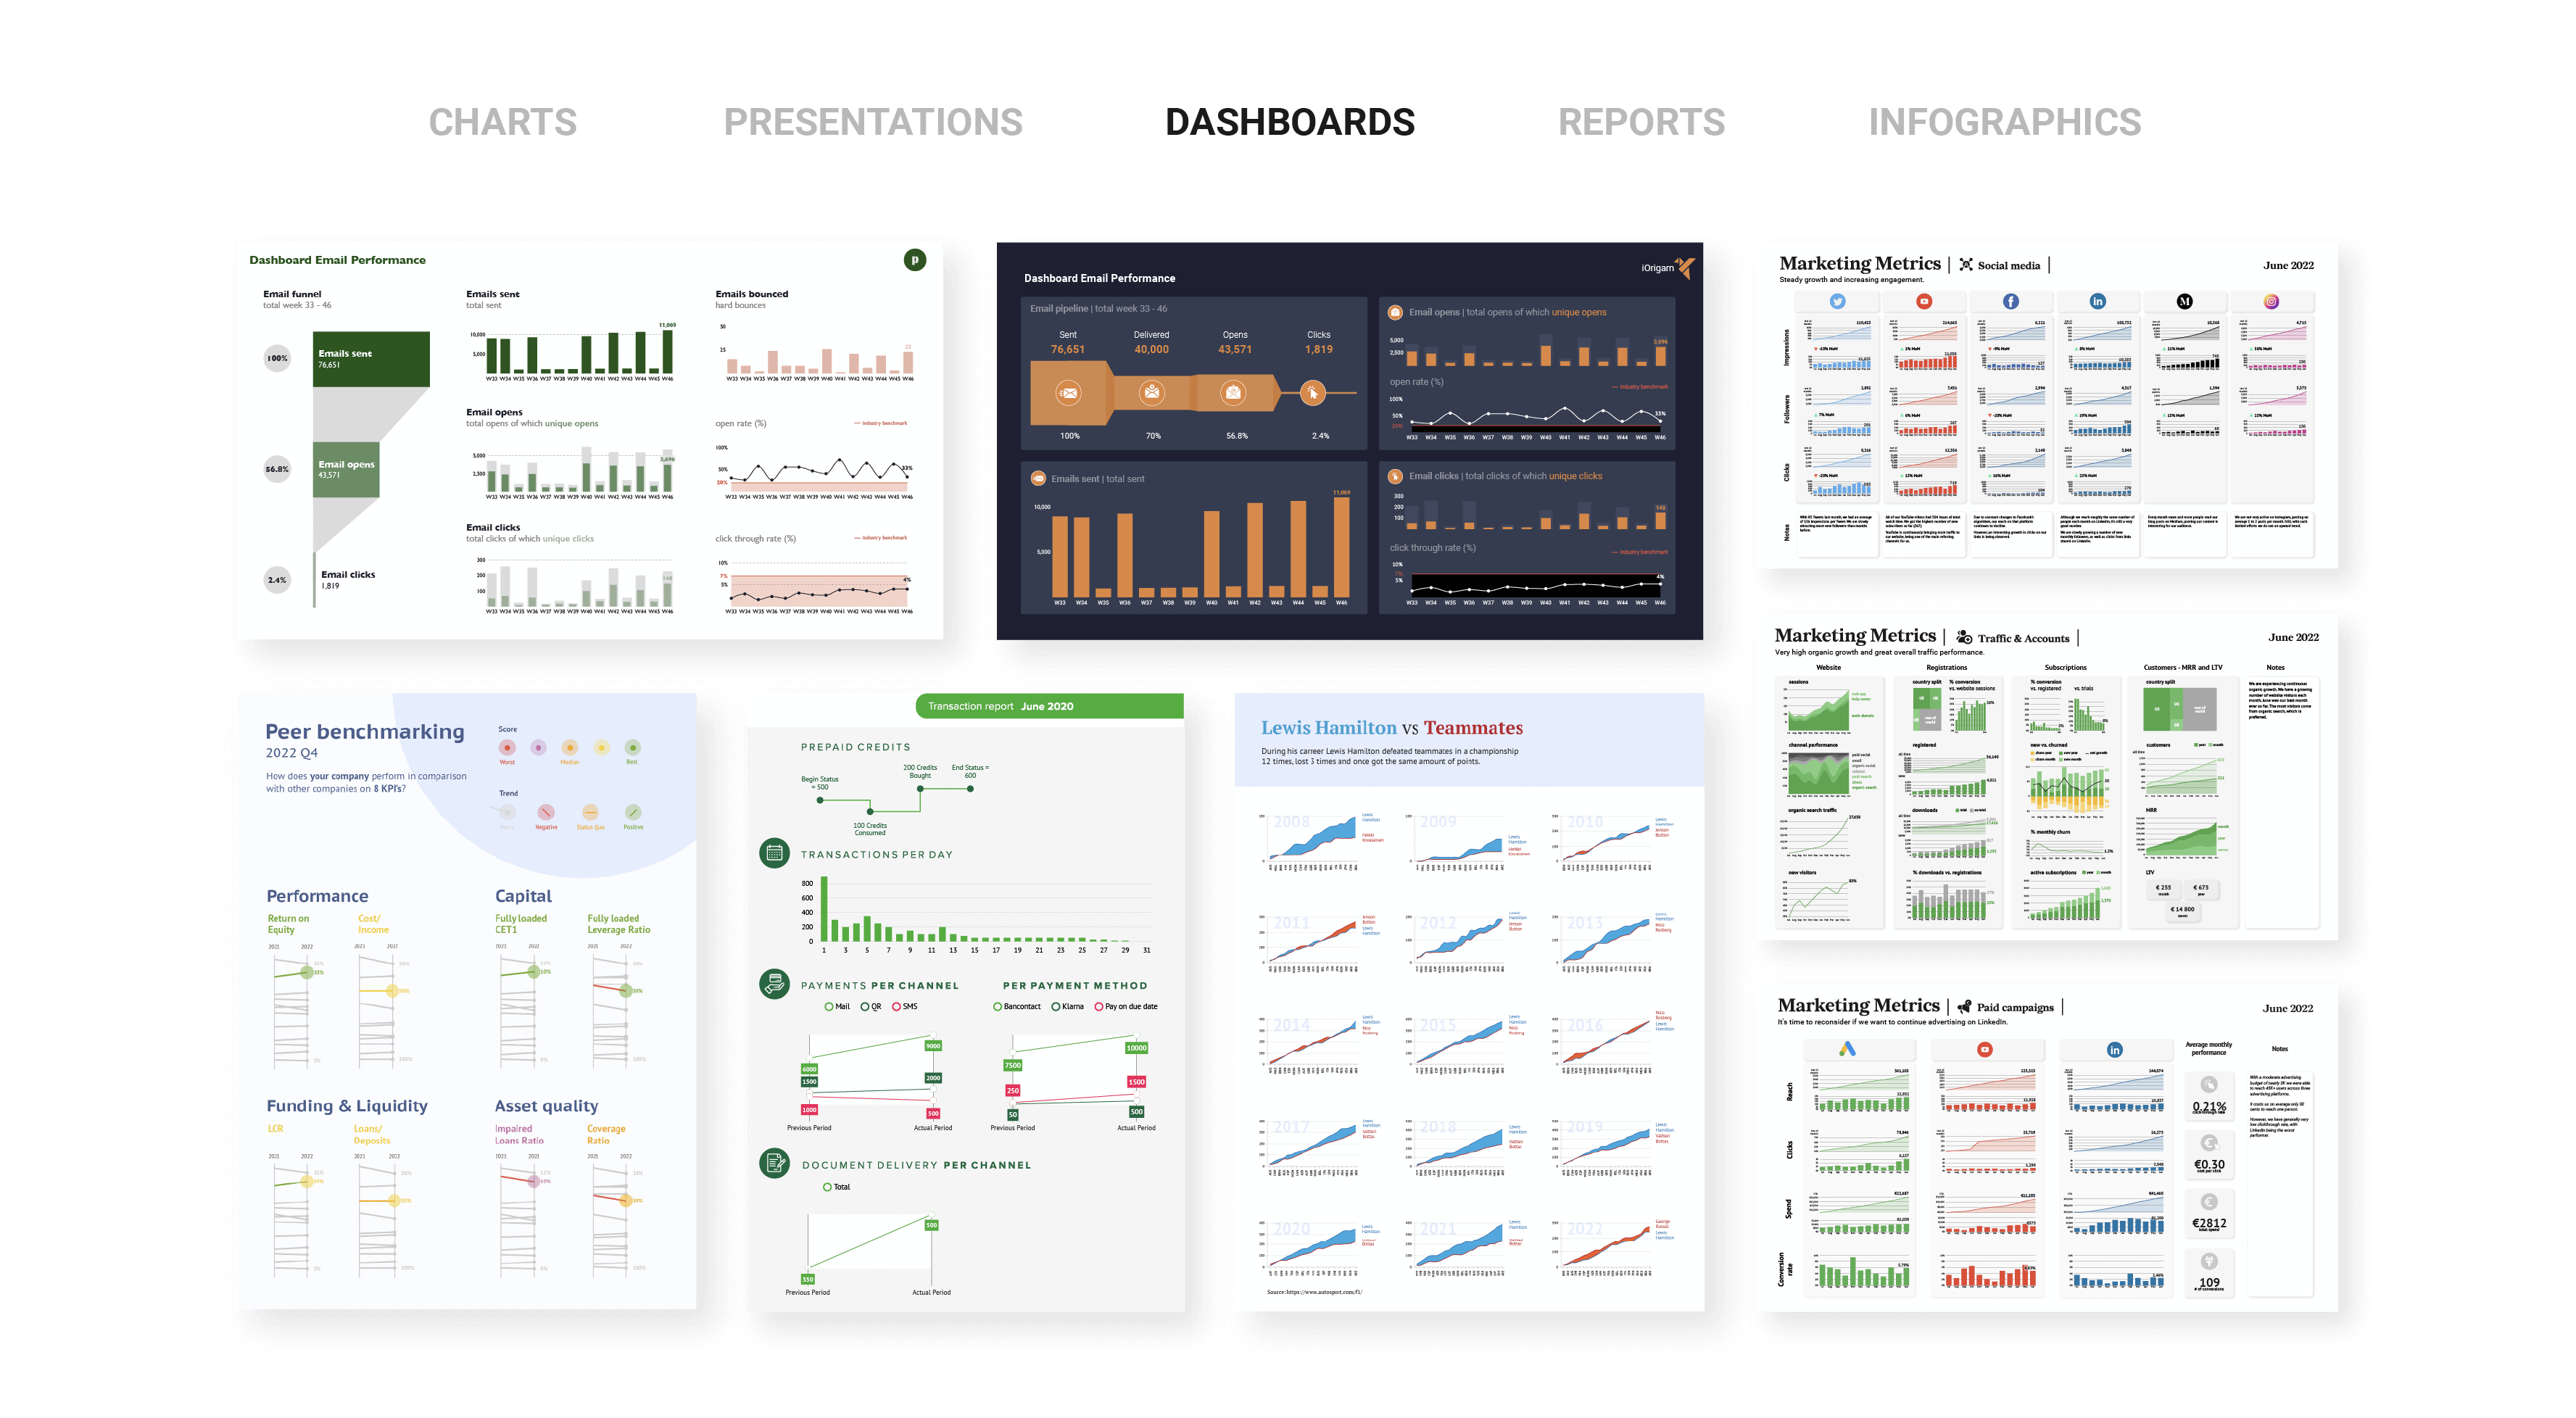
Join Datylon for free and start using Datylon Report Studio, where you can store and manage your report templates, as well as edit charts with our online chart editor.
Datylon Report Studio

Create or edit individual charts with an online editor.

See how it works
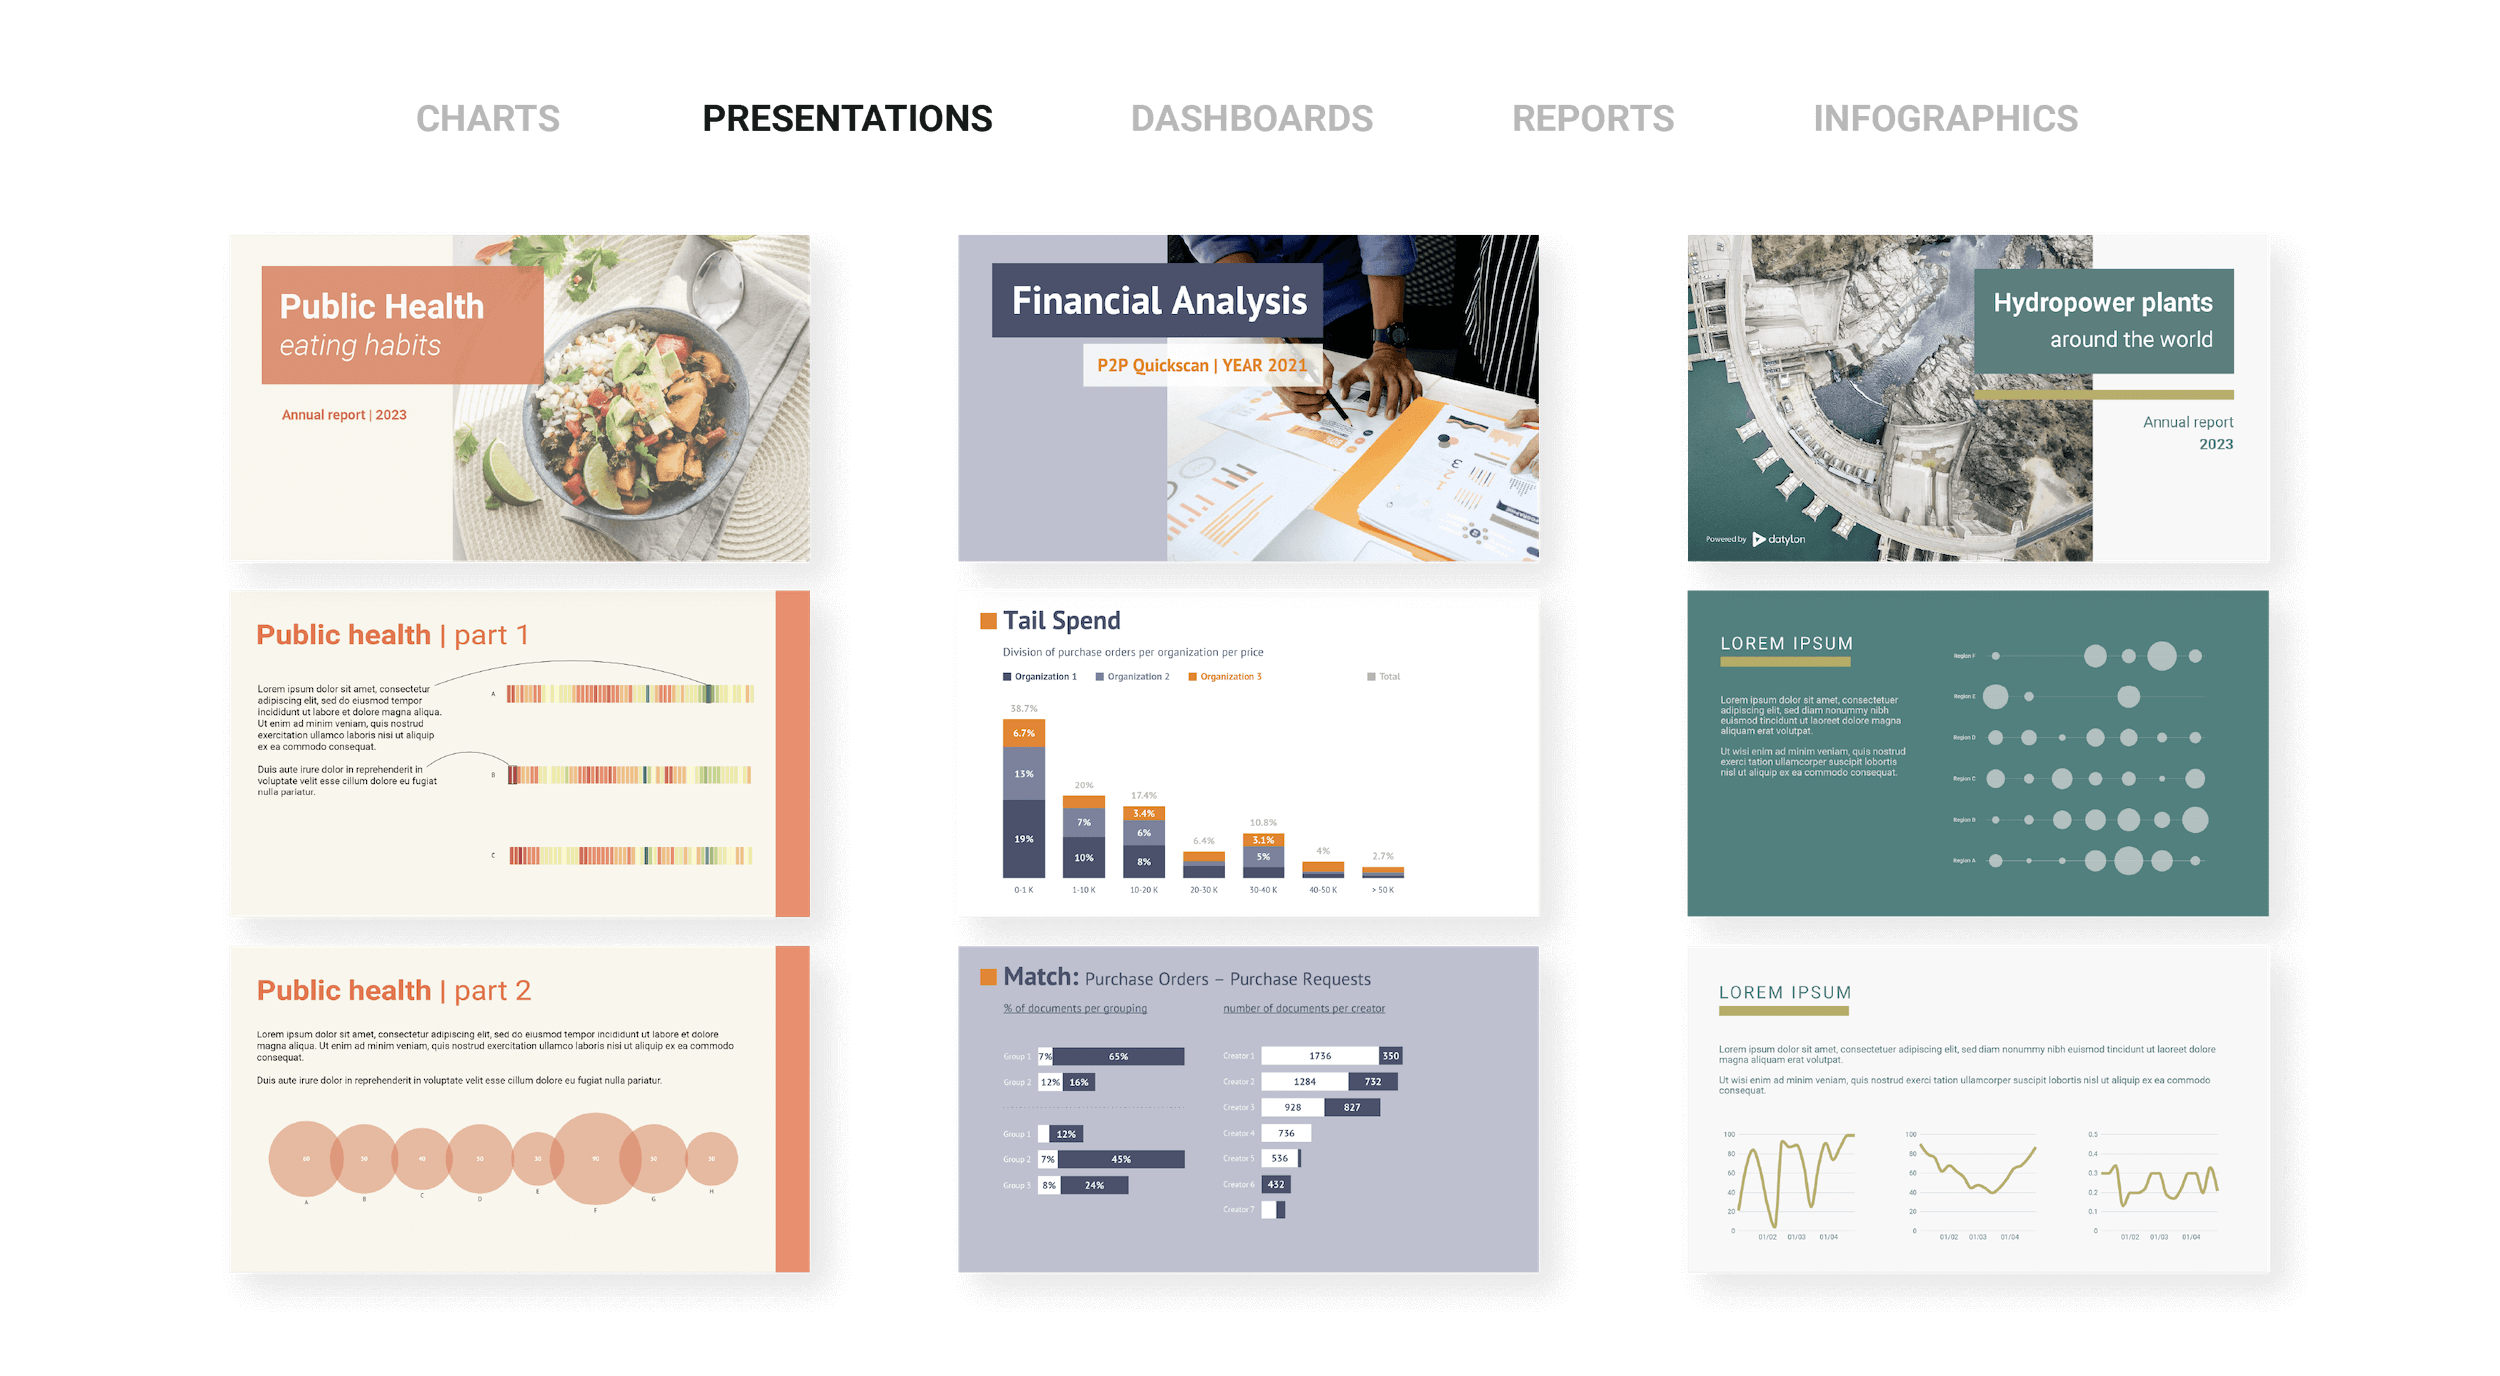
Try Datylon for PowerPoint - our add-in for Microsoft PowerPoint and enhance your slides and presentation with stunning data visualizations.
Datylon for PowerPoint

Datylon add-in for PowerPoint to enrich your presentations with beautiful charts.

Read more
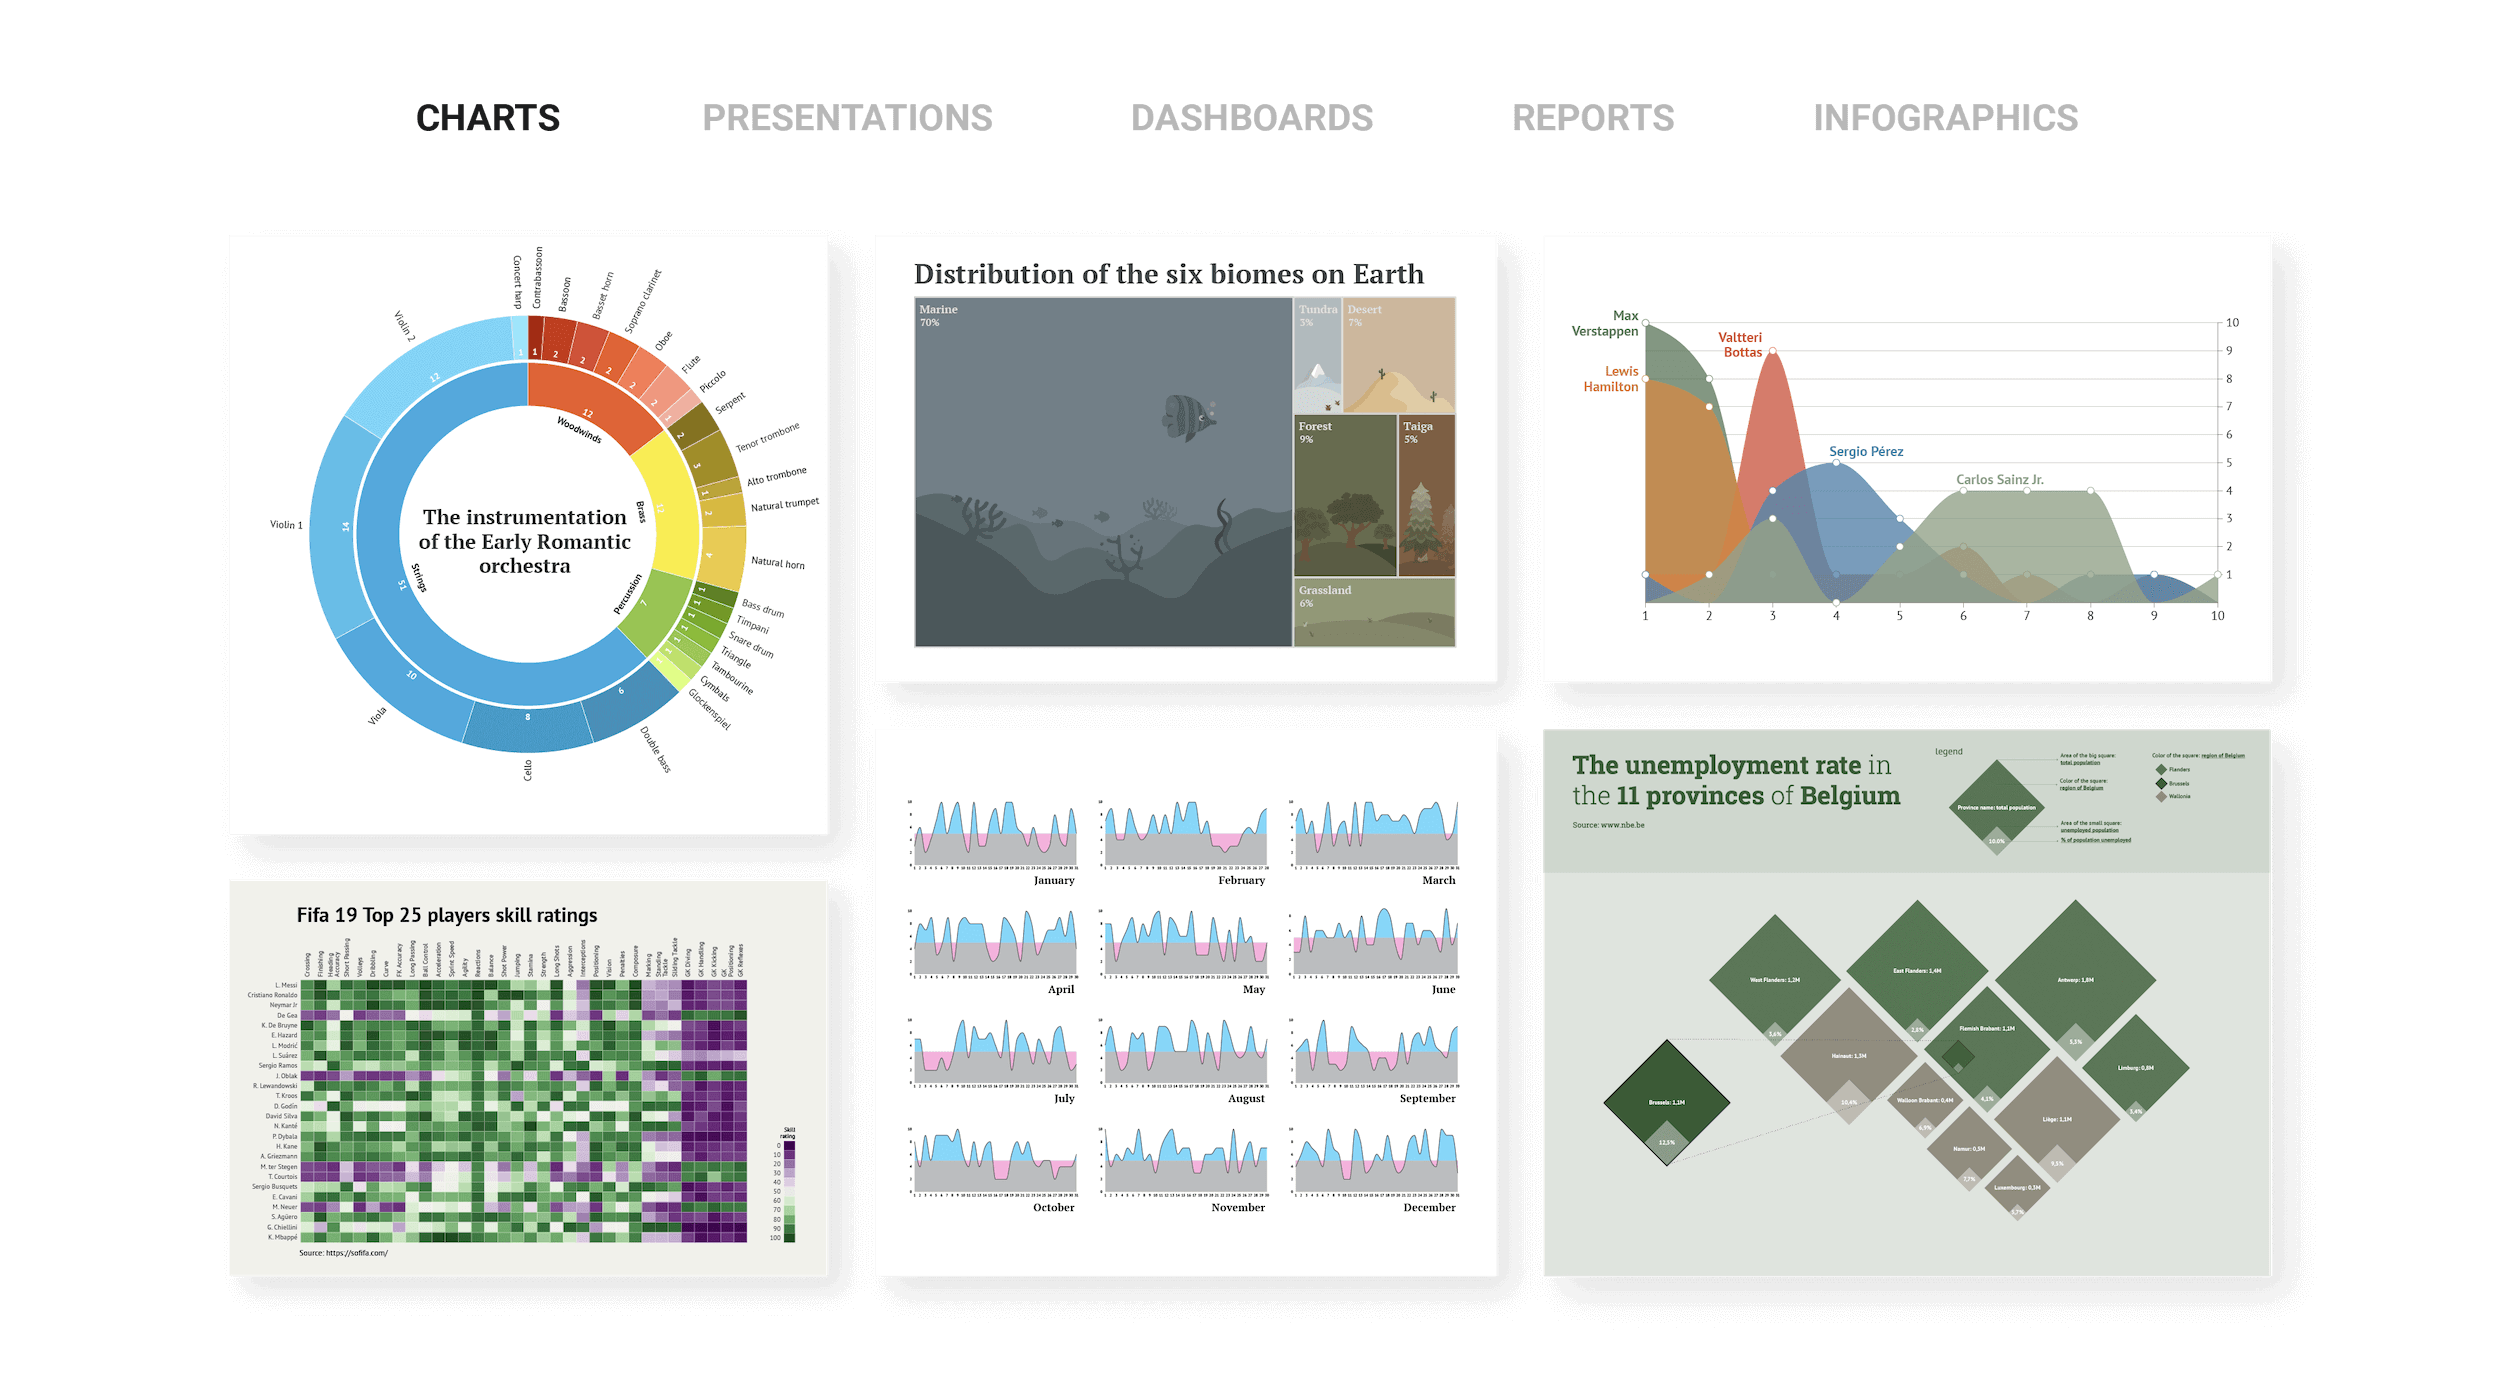
130+ chart templates - Choose from a growing collection of carefully crafted chart types to get you started faster. Edit and optimize them to the smallest detail and meet your design requirements.

130+ chart templates

Choose from a growing collection of carefully crafted chart types to get you started faster. Edit and optimize them to the smallest detail and meet your design requirements.

Discover all charts available in our Chart Library
Update your charts in a snap - Import data from a file (.xls, .xlsx and .csv) or link to an online data source (Google Sheets, OneDrive XLS) and update your charts with new data in one click. Manage your data sheets in workbooks and keep everything nicely organized.

Update your charts in a snap

Import data from a file (.xls, .xlsx and .csv) or link to an online data source (Google Sheets, OneDrive XLS) and update your charts with new data in one click. Manage your data sheets in workbooks and keep everything nicely organized.

Start creating your own charts
Data-driven styling - Let your data drive the look & feel of your chart. Style series and data points with ease. Bind the colors, shapes, strokes, size, radius, and label text to your data, empowering the reusability of your charts.

Data-driven styling

Let your data drive the look & feel of your chart. Style series and data points with ease. Bind the colors, shapes, strokes, size, radius, and label text to your data, empowering the reusability of your charts.

Design impressive and engaging charts
Export, publish, embed or share with ease - Download your chart as PDF, PNG, or SVG and place it seamlessly into presentation slides or graphic editors. Or embed it in external apps and websites. Use, publish, or share your chart effectively with your audience, anywhere you want.

Export, publish, embed or share with ease

Download your chart as PDF, PNG, or SVG and place it seamlessly into presentation slides or graphic editors. Or embed it in external apps and websites. Use, publish, or share your chart effectively with your audience, anywhere you want.

Get started with Datylon for free
Beautify the boring, without coding.
You don't need coding skills to create custom, truly beautiful, on-brand charts. Make an impact with your chart design.
Design your own
Pie chart
Unleash your creativity with more chart design freedom than ever before.
Design impactful data visualizations
Datylon for Illustrator gives you full creative control with a myriad of styling options for charts, including styling based on data and reusable chart templates.

Support Your Executives: Optimize Reporting for Strategic Success

Executive reports are crucial for supporting decision-makers to quickly understand the most...

Read More

Operational vs. Progress ESG Reports: A Deep Dive

The urgency to address environmental, social, and governance challenges has propelled ESG...

Read More

How to Create Tailored Data Stories and Reports with Indesign and Datylon

Are you tired of manually creating multiple versions of your data stories and reports? And what...

Read More

Datylon vs Power BI for automated reporting

In the dynamic landscape of business intelligence, Datylon and Power BI stand out as premier tools...

Read More

ESG reporting: a comprehensive guide to communicating ESG results

The field of ESG reporting is undergoing continuous development. Even though understanding the...

Read More

Subscribe to our newsletter

Receive inspiration, practical advice, customer stories and news right in your mailbox. 

Newsletter