[go: up one dir, main page]
More Web Proxy on the site http://driver.im/

Nationals Arm Race

"… the reason you win or lose is darn near always the same – pitching.” — Earl Weaver

Archive for the ‘tom seaver’ tag

Opening Day Starter Trivia 2021

leave a comment

Kershaw gets another opening day start in 2021. Photo via wiki.

Every year I update this long-running XLS for this increasingly anachronistic relic of tracking Opening Day Starter honors for teams.

After this year’s opening day, which was delayed for nearly a week thanks to the Nats Covid outbreak, here’s some cool trivia:

  • Most Opening Day StartsActive Leaders:
    • Justin Verlander remains the current leader with 12, though he’s out for the season with injury.
    • Clayton Kershaw made his 9th opening day start after missing a couple in a row, making him the pitcher with the highest number that is still actively making opening day starts.
    • Felix Hernandez and Jon Lester have 10 and 8 opening day starts respectively, but neither
    • After these guys, the players with the most are Madison Bumgarner (7), Max Scherzer (6) and Julio Teheran (6).
  • Current Leading Consecutive streak:
    • both Max Scherzer and Aaron Nola are on a consecutive opening day start streak of 4 starts.
  • Number of first-time Opening Day Starters in 2021: Just 7. This is after 18 last year.
  • Number of Opening Day Starters who now have exactly two opening day starts: 14 of the 30.
  • Most surprising opening-day starters in 2021:
    • Chad Kuhl: well someone had to pitch opening day for Pittsburgh, who may lose 115 games this year.

Historically, here’s the all-time record holders:

  • Most Ever Opening day StartsTom Seaver with 16.  Tied for 2nd place with 14 is Jack Morris, Randy Johnson and Steve Carlton
  • Most Consecutive Opening Day StartsJack Morris, all of whom’s 14 opening day starts were in a row.

Hope you enjoy this useless trivia!

Opening Day Starter Trivia 2019

22 comments

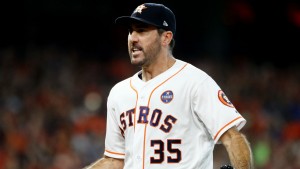
Verlander makes his 11th career opening day start, tying him for the active lead. Photo via sporting News.

Verlander makes his 11th career opening day start, tying him for the active lead. Photo via sporting News.

Every year I update this long-running XLS for this increasingly anachronistic relic of tracking Opening Day Starter honors for teams.  But it does make for some good trivia questions.

After this year’s opening day (including the two-day series in Japan), here’s some interesting stats related to Opening Day Starts from around the league:

  • Most Opening Day Starts, Active Leaders:
    • Justin Verlander makes his 11th and he seems well suited to increase that total given current form and new contract.
    • 11 ties him with both CC Sabathia and Felix Hernandez for the most active, neither of whom seem like they’ll get another shot to extend their totals.
    • Next closest are three tied with 8 each: Jon LesterClayton Kershaw and James Shields.  Lester’s is active, Kershaw’s should continue, while Shields remains unsigned for 2019 and seems unlikely to get another shot.
  • Current Leading Consecutive streak:
    • Julio Teheran with 6, which is pretty amazing because there was talk of him not even making the team with all the pitching depth Atlanta has.
    • Next closest is Corey Kluber with 5.
    • Nobody else really is close.  Lester has 3 straight for the Cubs, to add to his total of 8 between Boston and Chicago.
  • Consecutive streaks ended in 2019:
    • Felix Hernandez has his streak of 10 starts broken, and he wasn’t happy about it.
    • Kershaw had his streak of 8 broken thanks to the spring training injury.
    • Chris Archer has his streak of 4 broken thanks to a mid-season 2018 trade.
  • Number of first-time Opening Day Starters in 2019: 14.
    • deGrom, Castillo, Taillon, Mikolas, Freeland, Ryu, Lauer, Snell, Rodon, Keller, Berrios, Fiers, Gonzales, Minor
    • I’d say half of these are rewards for excellent 2018 seasons (deGrom, Taillon, Mikolas, Freelan, Snell for sure, perhaps also Berrios), some are covering for obvious candidates who are injured (Ryu), while the rest mostly play for tanking teams who have little better choice than to name a starter for opening day (Castillo, Lauer, Rodon, Keller, Fiers, Gonzales and Minor).
    • This is the highest number of first-time opening day starters in my decade of tracking this.

Historically, here’s the all-time record holders:

  • Most Ever Opening day Starts: Tom Seaver with 16.  Tied for 2nd place with 14 is Jack Morris, Randy Johnson and Steve Carlton
  • Most Consecutive Opening Day Starts: Jack Morris, all of whom’s 14 opening day starts were in a row.

Hope you enjoy this useless trivia!


Opening Day Starter Useless Trivia for 2018

11 comments

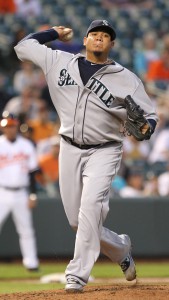
Felix Hernandez made his leading 11th opening day start. Photo Keith Allison via flickr/CCL

Felix Hernandez made his leading 11th opening day start.
Photo Keith Allison via flickr/CCL

Every year I capture the Opening Day Starters into an XLS and then capture some useless trivia on it.  This is that post.

Google Doc XLS link: (the data is too big to make an HTML table): https://docs.google.com/spreadsheets/d/1Mv8gLgJOuJHEAf_pXNwPWGCNRL4RnYEyulH6rxMuudA/edit?usp=sharing

Max Scherzer made his 3rd  career opening day start, all in a Nat’s uniform (he never  got an Opening day start while pitching behind Justin Verlander in Detroit).   Stephen Strasburg has himself made four opening day starts, with these two guys covering every Nats opening day start dating to 2011.

The Nats have one other player with Opening day starts on their resume: Jeremy Hellickson made the 2016 and 2017 opening day starts for Philadelphia.  He currently sits in XST building up arm strength so he can take over for A.J. Cole as our fifth starter after he blows up a couple more times.  And its worth noting that former Nat Jordan Zimmermann earned his first ever such start for Detroit this year, shortly before getting hit in the head with a come-backer.

Here’s some useless trivia related to Opening Day Starts:

  • Active Leader: Tie at the top: Seattle’s Felix Hernandez with 11.  CC Sabathia also has 11, but hasn’t made the Yankee’s start since 2014.
  • Active Consecutive Leader: Also Hernandez, who has made 10 straight, missing one in 2008 when Erik Bedard took the mound in Game 1 as the new shiny FA signing that spring.  The next closest is Clayton Kershaw, who has made 8 straight for LA.
  • Other longish conseutive starts streak: Atlanta’s Julio Teheran with 5, Corey Kluber with 4, and Chris Archer with 4.
  • Madison BumgarnerMasahiro Tanaka and Dallas Keuchel all had 3-4 start streaks broken thanks to injury or being passed over for a different guy.
  • 13 of the 30 games were started by first time Opening Day starters this year, continuing a trend of new,  younger guys getting these starts.  In fact, I’d say that a couple of the opening day starters you’d be hard pressed to pull out of a lineup: Miami’s Jose Urena, Milwaukee’s Chase Anderson, and SF’s Ty Blach in particular.

All-time records:

  • Most Ever: Tom Seaver (16).  Tied for 2nd place with 14 is Jack Morris, Randy Johnson and Steve Carlton
  • Most Consecutive: Jack Morris (14)

Can Felix get 5 more starts to break Morris’ record?   He’s only signed through 2019 with an option for 2020, so he’d need to get an extension … something that’s more and more rare in today’s Baseball climate.

Thanks to that same trend against aging pitchers, a slew of former leaders of Opening Day starts may be permanently retired out of the game.  Guys like Jered WeaverTim Lincecum, Edison Volquez, Yovanni Gallardo (who was just DFA’d), Ricky NolascoJake Peavy and perhaps a few others, all of whom have at least 4-5 opening day starts to their name are struggling to find work right now or may be done.   Its turning into a young man’s game.

Opening Day 2017; Fun stats and other useless information

15 comments

OpeningDay2017

Happy Opening day!

Here’s my recurring “Opening Day” trivia/useless information post.  Here was 2016’s version,  2015, 2014 and 2013.  I also reference many Google XLS/Google Doc creations with historical data below, all of which have been updated for 2017.


Nats 2017 Opening day Payroll:

Why are these values different?   Cots and USA today disagree on Strasburg’s 2017 salary to the tune of about $2M, and that’s about the difference between their two figures.   My XLS counts all salaries in *current dollars* only, as opposed to the salary cap figures that USA Today and Cots do (Cots also splits out the signing bonuses prorated to each year of the contract).  Plus I count in payments to former players (in our case, Petit and Norris).  I believe this is a better representation of how the team and the Lerners see their payroll.  Teams that have huge payments to former players (like the Dodgers and Padres) should absolutely have those “dead money” payments included.  Roughly speaking, Strasburg and Scherzer both are getting $15M in current dollars but more than $40M combined in these claculations, which is a huge part of the delta between my XLS and Cots’.

Oh, by the way, the Nats now have $199 MILLION dollars of deferred payments on the books when adding in Blanton’s (mostly) deferred salary.


Opening Day Payroll; MLB wide

See this link for the list of all team payrolls at USA Today.  And Here’s Cot’s/Baseball Prospectus’ compensation home page.

I’ve put both of these lists side by side into this little handy Payroll XLS to demonstrate how ridiculously bad the USA Today figures are.  They’re off by $35M for the Padres and by $53M for the Los Angeles Dodgers.  Thats because the USA Today figures don’t account for any salaries being paid for former players, which in the modern game has more and more become a standard.  So, basically I ignore USA Today’s figures and always use Cot’s.

The Dodgers continue to lead the way (by either measure).  The Brewers are now dead last, just ahead of the purposely tanking Padres.  You may have seen posts that noted that Clayton Kershaw gets paid more this year than the Padres entire 25-man roster, and that’s true, but it ignores the $30M+ of dead money on their payroll.

The Nats are 9th on both lists.  Imagine what we could spend with a market value RSN!!


Home Openers Information

Opening Day 2017 attendance was announced at 42,744 .  That’s up more than a thousand from last year.  Here’s all our home openers in order with attendance, time of game, weather:

  • 2017: 42,744 (1:05 monday game, 66 and cloudy)
  • 2016: 41,650 (4:05 thursday game, 60 and 1.5hr rain delay)
  • 2015: 42,295 (4:05 monday game, 75 and gorgeous)
  • 2014: 42,834 (1:05 friday game, 50s and overcast)
  • 2013: 45,274 (1:05 monday game, 60 and beautiful)
  • 2012: 40,907 (1:05 thursday game 56, partly cloudy)
  • 2011: 39,055 (1:05 thursday game, 41 degrees and overcast)
  • 2010: 41,290 (1pm game monday, beautiful weather 80s and sunny): Phillies invasion
  • 2009: 40,386 (3pm game on a monday, chilly 53degr and overcast)
  • 2008: 39,389 (season and stadium opener), 8pm sunday night, Braves, nat’l tv clear but cold.
  • 2007: 40,389 (in rfk, 1pm game vs Florida, 72degrees
  • 2006: 40,516 (in rfk, tuesday day game vs Mets, 72degr and sunny)
  • 2005: 45,596 (in rfk, debut of entire franchise, 62degr and clear, evening game).

Here’s some attendance milestones for the franchise:

  • Nats park capacity for 2017 somewhere between 41,506 and 41,546 depending on your source.
  • 2013’s opening day attendance of 45,274 remains the regular season record attendance.
  • All time record attendance?  The ill-fated 2012 NLDS game 5: 45,966.  No playoff games in 2014 or 2016 came close.
  • The first game in franchise history; 2005 in RFK: 45,596, which stood until the 2012 NLDS record-setting game.
  • The long-running regular season attendance record was the great Fathers day 2006 game in RFK against the Yankees: 45,157.  That record stood for more than 6 years.

Home Openers Box Scores and Results

Nats are 5-8 in their home openers now since moving to Washington.  Stephen Strasburg‘s 2017 start joins him with Livan Hernandez as the only two pitchers to throw more than one home opener for this team.  When Livan gets elected to Cooperstown, I hope he’s wearing the curly W.  🙂

  • 2017; mlb.com: Nats d Marlins 4-2.  WP: Strasburg, LP Phelps (Starters: Strasburg and Volquez)
  • 2016: mlb.com: Marlins d Nats 6-4.  WP: David Phelps, LP Tanner Roark (Starters: Brian Conley and Roark).
  • 2015: mlb.com: Mets d Nats 3-1.  WP: Bartolo Colon.  LP: Max Scherzer
  • 2014: mlb.com or b-r.com.  Braves d Nats 2-1.  WP: Luis Avilan.  LP: Tyler Clippard.  (Starters: Jordan Zimmermann and David Hale).
  • 2013: mlb.com or b-r.com.  Nats d Marlins 2-0.  WP: Stephen Strasburg.  LP: Ricky Nolasco
  • 2012: mlb.com.  Nats d Reds 3-2.  WP: Craig Stammen. LP: Alfredo Simon (Starters: Gio Gonzalez and Mat Latos)
  • 2011: mlb.com.  Braves d Nats 2-0.  WP: Derek Lowe.  LP: Livan Hernandez
  • 2010: mlb.com.  Phillies d Nats 11-1.  WP: Roy Halladay.  LP: John Lannan
  • 2009: mlb.com.  Phillies d Nats 9-8.  WP: Jamie Moyer.  LP: Saul Rivera (Nats Starter: Daniel Cabrera)
  • 2008: mlb.com.  Nats d Braves 3-2.  WP: Jon Rauch.  LP: Peter Moylan (Starters: Tim Hudson and Odalis Perez)
  • 2007: mlb.com.  Marlins d Nats 9-2.  WP: Dontrelle Willis.  LP: John Patterson
  • 2006: mlb.com.  Mets d Nats 7-1.  WP: Brian Bannister.  LP: Ramon Ortiz
  • 2005: mlb.com.  Nats beat Arizona 5-3. WP: Livan Hernandez. LP: Javier Vazquez

How about Season openers?

Record: 6-7.  # times home/away: 7 home, 6 away.

The Nats managed to lose 6 of their first 7 season openers … only winning in 2008 when debuting their new stadium.  And Jon Rauch did his darndest to blow that opener too, coughing up the lead in the 9th to give Ryan Zimmerman a chance at glory.


Opening Day Starter Trivia

Here’s my Opening Day starters worksheet in Google docs, updated for the 2017 slate.  Here’s the answer to some fun Opening Day Starter trivia:

  • Leader in Opening day starts: remains C.C. Sabathia with 11, though he’s not extending his record and will be caught next  year.
  • Leader in consecutive opening day starts: Felix Hernandez, making his 9th consecutive, 10th overall.
  • Justin Verlander returned to Opening Day duties, getting his 9th career opening day start; he remains in 3rd place actively.
  • Clayton Kershaw now has seven straight and may be in a position to challenge the all time records.
  • For the Nats; Stephen Strasburg gets his fourth.  Max Scherzer has two.  John Lannan, now back as a submarining lefty in AAA, also has two.
  • Twelve (12) pitchers made their first career opening day start in 2017, including (surprisingly) Yu Darvish.
  • Edinson Volquez got his 5th career opening day start … on four different teams.
  • The Mets have now used 7 different opening day starters in the last 7 seasons.  But that pales in comparison to what’s going on in Texas: 9 straight different opening day starters there.   Miami has used 6 different guys in a row and there’s a few other teams that have used 4 or 5 different guys over the last 4-5 seasons.
  • The most ever?  Tom Seaver with 16.  The most consecutive?  Jack Morris with 14.
Opening Day Payroll, Attendance, Starters & other cool stuff: 2016 Version

25 comments

2015 opening day image via sayhellobaseball.wordpress.com

2015 opening day image via sayhellobaseball.wordpress.com

My recurring “Opening Day” trivia/useless information post.  Here was 2015’s version, 2014‘s and 2013.  Many of the below links are to Google XLS docs that i’ve updated for 2016 and which are available on the right hand side under “NatsArm Creations.”


Nats 2016 Opening day Payroll: $145,178,886 according to Cots.  This is down nearly $20M from last year’s figure.  We can only hope that Mike Rizzo will be allowed to “spend” that money later in the year at the trade deadline if this team actually needs to spend money to acquire helpful players.

My personal payroll estimate came in at $ $137,286,029 coincidentally; why am I $8M off?  Because Cots basically makes arbitrary proclamations of salary for current year when money is deferred whereas I’m counting it as real dollars.  So for example I’m charging the Nats payroll precisely $15M for Max Scherzer this year while Cots puts the figure north of $22M, and Cots puts all of Papelbon’s $3M deferred 2016 salary on the 2016 books.  So between those two players the entire delta is accounted for.

The question is this: as a Nats fan are you “happy” that your payroll is down nearly $20M in Stephen Strasburg‘s walk  year and while your Season Ticket prices continue to rise?


Opening Day Payroll; MLB

USAToday also publishes opening day salaries for teams and i’m convinced that they’re garbage.  I’ve got a comparison spreadsheet where i’ve put the USAtoday figures side-by-side with Cots’ analysis and for some teams they’re off by more than $25M.  The problem is that USAToday doesn’t count ANY payments handed to and from between teams, whereas Cots does a very detailed auditing of such money.

Nonetheless, here’s USAToday and Cots’ rankings for the 30 teams (this is my first time using this new Table plug in; head to Google XLS to read it if this is too difficult):

Cots RankUSA Today rankTeamOpening Day - USA TodayOpening Day - CotsDelta USAtoday-Cots
12Los Angeles Dodgers$221,288,380 $247,781,668 $26,493,288
21New York Yankees$222,997,792 $227,854,350 $4,856,558
33Detroit Tigers$194,876,481 $198,018,000 $3,141,519
44Boston Red Sox$188,545,761 $197,899,679 $9,353,918
56San Francisco Giants$172,253,778 $172,086,611 ($167,167)
67Chicago Cubs$154,575,168 $171,611,834 $17,036,666
713Los Angeles Angels$137,251,333 $164,673,333 $27,422,000
85Texas Rangers$186,038,723 $157,955,390 ($28,083,333)
98Baltimore Orioles$145,533,782 $147,693,713 $2,159,931
109St. Louis Cardinals$143,053,500 $145,553,500 $2,500,000
1111Washington Nationals$141,652,646 $145,178,886 $3,526,240
1210Seattle Mariners$141,683,339 $141,830,193 $146,854
1312Toronto Blue Jays$138,701,700 $136,782,027 ($1,919,673)
1414New York Mets$133,889,129 $135,188,085 $1,298,956
1515Kansas City Royals$131,487,125 $131,487,125 $0
1616Chicago White Sox$112,998,667 $114,498,667 $1,500,000
1717Colorado Rockies$112,645,071 $112,645,071 $0
1818Minnesota Twins$105,333,200 $105,333,700 $500
1920San Diego Padres$101,424,814 $100,759,500 ($665,314)
2019Pittsburgh Pirates$103,778,833 $99,945,500 ($3,833,333)
2123Arizona Diamondbacks$89,264,063 $98,172,683 $8,908,620
2221Houston Astros$94,893,700 $96,893,700 $2,000,000
2327Cleveland Indians$74,311,900 $96,304,400 $21,992,500
2422Cincinnati Reds$89,955,059 $89,871,228 ($83,831)
2525Philadelphia Phillies$83,980,000 $88,846,667 $4,866,667
2624Oakland Athletics$86,806,234 $86,806,234 $0
2729Atlanta Braves$69,005,791 $86,580,792 $17,575,001
2826Miami Marlins$77,314,202 $74,364,500 ($2,949,702)
2930Tampa Bay Rays$57,097,310 $66,681,991 $9,584,681
3028Milwaukee Brewers$69,282,737 $63,908,300 ($5,374,437)


Opening day Nats park attendance

Opening Day 2016 attendance was announced at 41,650.  That’s down more than 800 from last year (but still a sell-out).  Perhaps the rain forcast kept people away.   Here’s all our home openers in order with attendance, time of game, weather:

  • 2016: 41,650 (4:05 thursday game, 60 and 1.5hr rain delay)
  • 2015: 42,295 (4:05 monday game, 75 and gorgeous)
  • 2014: 42,834 (1:05 friday game, 50s and overcast)
  • 2013: 45,274 (1:05 monday game, 60 and beautiful)
  • 2012: 40,907 (1:05 thursday game 56, partly cloudy)
  • 2011: 39,055 (1:05 thursday game, 41 degrees and overcast)
  • 2010: 41,290 (1pm game monday, beautiful weather 80s and sunny): Phillies invasion
  • 2009: 40,386 (3pm game on a monday, chilly 53degr and overcast)
  • 2008: 39,389 (season and stadium opener), 8pm sunday night, Braves, nat’l tv clear but cold.
  • 2007: 40,389 (in rfk, 1pm game vs Florida, 72degrees
  • 2006: 40,516 (in rfk, tuesday day game vs Mets, 72degr and sunny)
  • 2005: 45,596 (in rfk, debut of entire franchise, 62degr and clear, evening game).

Here’s some attendance milestones for the franchise:

  • Nats park capacity for 2015 seems to still be 41,456 unless they announce an 2016 adjustment.
  • 2015’s opening day crowd wasn’t even close to 2013’s: 45,274.  That remains the regular season record attendance.
  • All time record attendance?  The ill-fated 2012 NLDS game 5: 45,966.
  • The first game in franchise history; 2005 in RFK: 45,596, which stood until the NLDS record-setting game.
  • The long-running regular season attendance record was the great Fathers day 2006 game in RFK against the Yankees: 45,157.  That record stood for more than 6 years.

Opening Day Box Scores and Results

Nats are just 4-8 in their home openers now since moving to Washington.  Just one guy has thrown more than one home opener for the Nats: Livan Hernandez When Livan gets elected to Cooperstown, I hope he’s wearing the curly W.  🙂

  • 2016: mlb.com: Marlins d Nats 6-4.  WP: David Phelps, LP Tanner Roark (Starters: Brian Conley and Roark).
  • 2015: mlb.com: Mets d Nats 3-1.  WP: Bartolo Colon.  LP: Max Scherzer
  • 2014: mlb.com or b-r.com.  Braves d Nats 2-1.  WP: Luis Avilan.  LP: Tyler Clippard.  (Starters: Jordan Zimmermann and David Hale).
  • 2013: mlb.com or b-r.com.  Nats d Marlins 2-0.  WP: Stephen Strasburg.  LP: Ricky Nolasco
  • 2012: mlb.com.  Nats d Reds 3-2.  WP: Craig Stammen. LP: Alfredo Simon (Starters: Gio Gonzalez and Mat Latos)
  • 2011: mlb.com.  Braves d Nats 2-0.  WP: Derek Lowe.  LP: Livan Hernandez
  • 2010: mlb.com.  Phillies d Nats 11-1.  WP: Roy Halladay.  LP: John Lannan
  • 2009: mlb.com.  Phillies d Nats 9-8.  WP: Jamie Moyer.  LP: Saul Rivera (Nats Starter: Daniel Cabrera)
  • 2008: mlb.com.  Nats d Braves 3-2.  WP: Jon Rauch.  LP: Peter Moylan (Starters: Tim Hudson and Odalis Perez)
  • 2007: mlb.com.  Marlins d Nats 9-2.  WP: Dontrelle Willis.  LP: John Patterson
  • 2006: mlb.com.  Mets d Nats 7-1.  WP: Brian Bannister.  LP: Ramon Ortiz
  • 2005: mlb.com.  Nats beat Arizona 5-3. WP: Livan Hernandez. LP: Javier Vazquez

How about Season openers?

Record: 5-7.  # times home/away: 6 home, 6 away.

The Nats managed to lose 6 of their first 7 season openers … only winning in 2008 when debuting their new stadium.  And Jon Rauch did his darndest to blow that opener too, coughing up the lead in the 9th to give Ryan Zimmerman a chance at glory.

2016: away: Nats d Braves 4-3.  WP Treinen, LP O’Flarity (starters Scherzer, Teheran)
2015: home: Mets d Nats 3-1.  WP: Bartolo Colon.  LP: Max Scherzer
2014: away: Nats d Mets 9-7.  WP Aaron Barrett, LP Familia (starters Strasburg, Dillon Gee)
2013: home: Nats d Marlins 2-0.  WP: Stephen Strasburg.  LP: Ricky Nolasco
2012: away: Nats d Cubs 2-1.  WP Clippard, LP Marmol (starters: Strasburg and Ryan Dempster)
2011: home: Braves d Nats 2-0.  WP: Derek Lowe.  LP: Livan Hernandez
2010: home: Phillies d Nats 11-1.  WP: Roy Halladay.  LP: John Lannan
2009: away: Marlins d Nats 12-6.  WP: Nolasco, LP; Lannan
2008: home: Nats d Braves 3-2.  WP: Jon Rauch.  LP: Peter Moylan (Starters: Tim Hudson and Odalis Perez)
2007: home: Marlins d Nats 9-2.  WP: Dontrelle Willis.  LP: John Patterson
2006: away: Mets d Nats 3-2.  WP: Glavine, LP: Hernandez
2005: away: Phillies d Nats 8-4.  WP: Lieber, LP: Hernandez


Opening Day Starter Trivia

Here’s my Opening Day starters worksheet in Google docs.  Here’s the answer to some fun Opening Day Starter trivia:

  • Leader in Opening day starts: remains C.C. Sabathia with 11, though he’s missed the last two years.
  • Leader in consecutive opening day starts: Felix Hernandez, making his 8th consecutive, 9th overall.
  • Justin Verlander returned to Opening Day duties, getting his 8th career opening day start; he remains in 3rd place actively.
  • For the Nats; Max Scherzer gets his 2nd and Stephen Strasburg continues to have three.
  • Ten (10) pitchers made their first opening day start in 2016.
  • There’s 8 guys out there still active with 4 or more Opening Day starts who did not get them this year, and they include a number of former Aces who might be on the way out of the game (Tim Lincecum in particular, but also guys like James Shields, Bartolo Colon and Yovanni Gallardo)
  • The most ever?  Tom Seaver with 16.  The most consecutive?  Jack Morris with 14.


How will HoFame balloting be affected by the voter purge?

7 comments

Griffey is a shoe-in for 2016 class; who else might be affected? Photo via freeteam.com

Griffey is a shoe-in for 2016 class; who else might be affected? Photo via freeteam.com

(Editor note: we’ll take a quick break from the minor league reviews and arguing about why the Nats are trying to fill a 5th starter spot instead of one of their several obvious needs for that classic Late December task: arguing about the Hall of Fame.  I wrote most of this post much earlier this summer/fall, waiting for the “hall of fame” blogger season to post it.  Now’s as good of a time as any).

In the middle of the 2015 post-season, an interesting tidbit got reported by NBCSports’ Craig Calcaterra: The Hall of Fame BBWAA electorate has been reduced by a whopping 20% thanks to the new voter eligibility rules announced back in July 2015.

20% of voters!  That’s a huge number.  I thought the rules, when they were first announced, would have a negligible effect on things and would be a paper tiger.  But losing 20% of the voters will have a profound effect on the ballots going forward.  I agree with Calcaterra in characterizing these types of voters as generally being out of touch, industry-has-passed-them-by, believe everything they read from Murray Chass types who have directly led to the ballot congestion and the ridiculous voting patterns we’ve seen lately.  No word yet on whether the category of writers purged also includes those who no longer cover the sport actively (the most egregious example being the 3 voters who write for www.golferswest.com) who not only kept their votes but felt the need to pontificate about the state of the sport!).

Early returns are promising, by the way.  The BBHOF tracker website has taken the lead in collecting all published ballots and they’re tracked directly in this Google xls.  As of the time of this writing, they have about 20% of the ballots in the tracker spreadsheet and borderline candidates like Piazza, Raines and Bagwell are all trending above the 75% needed.  Griffey is at a perfect 100% and still looks like a good bet to beat Tom Seaver‘s all time record.  That is until some curmudgeons decide they like Seaver more than Griffey and send in blank ballots or some dumb-ass thing.

Key Dates in 2016 HoF class voting:

  • 11/9/15: ballot officially released, though we’ve known for years who’s actually on it thanks to baseball-reference.com.
  • 12/21/15: BBWAA ballots due back to Cooperstown for counting
  • 1/6/16: Class of 2016 announced, as well as 10,000 internet blogger posts on the topic.
  • 7/24/16: Official induction ceremony for the Class of 2016 in Cooperstown, NY

Anyway.  Lets look at the 2016 Ballot (hey, its never too early to do Hall of Fame vote analysis) and guess how things may go for the candidates, now that 20% of dead-weight is gone.

  • Ken Griffey Jr: if anything, his chances of breaking Tom Seaver‘s vote % record may rise thanks to the elimination of a bunch of curmudgeons who have been witholding votes inexplicably to prevent there ever being a unanimous inductee.  Easily gets elected in 2016.
  • Trevor Hoffman: might be hurt by more new-age voters who realize how minimal the impact of a closer is, no matter how good (Hoffman had just a 28.4 career bWAR, less than Mike Trout had accumulated by the end of his third full season, by way of comparison).

There’s not really anyone else new to the 2016 class worth mentioning; I could see Jim Edmonds getting 5% of the vote to stay on the ballot but nobody else getting much more than home-town beat writer sympathy votes.  This isn’t an indictment of Edmonds at all; there’s just too many good players on the ballot (our lament every year) and I think he’s a worthy candidate (some of the Jay Jaffe JAWS analysis on Edmonds is pretty telling; for a period of 10 years during his peak he trailed only Griffey and Bonds in terms of WAR).

How about the hold overs?  I think there’s good news for some guys:

  • Mike Piazza/Jeff Bagwell: two “PED-suspicion” guys who have never had any actual concrete proof against them probably now get in thanks to the elimination of a class of voters who probably believed everything they read in the anonymous-sourced NYTimes articles from 10 years ago.  Bagwell has further to go and may not get to 75%, but Piazza should.
  • Tim Raines: the more older/non sabremetric appreciating voters that go mean the higher percentage of votes Raines will get from more modern voters who realize just how valuable he was.  Like Bagwell, he has further to go and may not get to 75% this time, but between 2016 and 2017 he should get in.
  • Roger Clemens/Barry Bonds: I can see their vote totals rise from the 35% they’ve  been getting into the 50% range, still not enough to get enshrinement.  Still too many wounds and not enough voters who can overcome their disdain for what happened.
  • Mark McGwire/Sammy Sosa: same story as Clemens/Bonds, except whack off another 20% of votes.
  • Curt Schilling/Mike Mussina: Hard to see their vote totals changing much; older voters were probably giving Schilling too much credit for the bloody sock game but new voters havn’t supported him as much as expected (and he’s doing himself no favors with his continued idiotic political twitter posts).  Mussina just doens’t seem like the kind of pitcher that gets elected to the Hall thanks to a long career without specific accolades and being a known pr*ck to the media.

Everyone else held over from the 2015 ballot not already mentioned (Smith, Martinez, Trammell, Kent, McGriff, Walker, Sheffield, Garciaparra) each have specific issues that likely prevent any of them from getting much above the vote totals they’ve already gotten and probably won’t be helped much by the purge of the electorate.  I would vote for some of these guys (namely Martinez and Trammell) but understand why others don’t.

This is as close to a prediction piece as we’ll do for the Hall of Fame 2016 ballot (there’s way too many of them already), but my guess is that we’ll be seeing just Griffey and Piazza in Cooperstown in July 2016, with Bagwell, Raines and perhaps Hoffman right on the cusp to join them in 2017 (where the incoming class has some pretty serious PED-related issues that should be fascinating to watch play out; more on that in a year’s time).

Here’s some similar articles for your Hall of Fame perusal:

Opening Day Payroll, Attendance, Starters & other cool stuff

6 comments

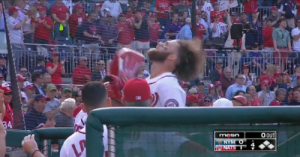
Harper's homer and subsequent hair flip was the highlight of the Nats opening day: photo via natsenquirer.com

Harper’s homer and subsequent hair flip was the highlight of the Nats opening day: photo via natsenquirer.com

Every year I try to attend Nats Opening Day.  Since giving up our season tickets, we’ve had to pay (handsomely) for the opportunity, and yesterday was no exception.  For nostalga purposes, we bought into our old section (131) for the home opener and had a great time in the sun.  Too bad Ian Desmond had money on the game and enabled three unearned runs to score.  Oh and our first pinch hitter off the bench?  The powerful and feared Matt den Dekker.  So yeah, this team looks like it may struggle offensively for a bit.

Here’s some fun stuff that I have been tracking for years inre opening day.


Opening Day Payroll; Nats

Counting payroll is always a tough one.  I have a payroll tracking worksheet (now updated for our last three NRI additions and our opening day roster) where I have been trying to estimate the Nats payroll.

Why the discrepancies?   I can’t quite figure out how my and Cot’s estimates are off: I’m counting the $2M option year buyout to Adam LaRoche, while Cots does not.  Taking that out, i’d still be off by about the same amount, only to the wrong side.  My guess is that Cots is missing a min-salary guy somewhere.  Meanwhile USA Today’s estimate is counting the entirety of Dan Uggla‘s 2015 salary of $13.5M towards Washington’s total; If you took that away except for the MLB min portion Washington is responsible for you’d be at $161,518,497 as their estimate.  USA Today’s numbers also don’t take into account the nearly $40 million dollars (net) that the Dodgers are paying players who no longer play for them; their payroll (per USA Today’s estimates) should really be nearer the $270M range.

You know what they say; a few million here, a few million there, and soon you’re talking about real money.


Opening Day Payroll; MLB

Here’s a quickie little XLS where I have the opening day payroll for all 30 teams going back 5 years.  Caveat; I usually depend on the USAToday salary database for these numbers, which have proved to have some issues (as discussed above).

USAToday has the Dodgers at $230M, but that’s before another $40M of payments to former players.  Cots has the Dodgers at $271M, a more accurate figure.  That’s first place by a significant margin.  In second place is the Yankees: $213M-$217M for a team that many feel will come in last last place.

I’m going to update this XLS for Cot’s figures, since USAToday’s are just so bad.


Opening day Nats park attendance

Attendance for yesterday’s game was announced at 42,295.  Here’s some attendance milestones for the franchise:

  • Nats park capacity for 2015 seems to be 41,456, an increase of 40 seats from last year
  • 2015’s opening day crowd wasn’t even close to 2013’s: 45,274.  That remains the regular season record attendance.
  • All time record attendance?  The ill-fated 2012 NLDS game 5: 45,966.
  • The first game in franchise history; 2005 in RFK: 45,596, which stood until the NLDS record-setting game.
  • The long-running regular season attendance record was the great Fathers day 2006 game in RFK against the Yankees: 45,157.  That record stood for more than 6 years.


Opening Day Starters

Here’s my opening day starters worksheet in Google docs.  Thanks to some turnover at the top of some of these rotations, the two active leaders in Opening Day starts (CC Sabathia and Mark Buehrle) did not extend their leads of 11 and 9 respectively.  The names of note for opening day starts:

  • Leader in Opening day starts who extended their total in 2015: Felix Hernandez, making his 8th.
  • Leader in consecutive opening day starts: also Hernandez, making his 7th total (he missed one earlier in his career).
  • Four pitchers now have 7 opening day starts on their resume: Bartolo Colon, Jered Weaver, James Shields and Justin Verlander.  Verlander’s streak of 7 consecutive starts was broken when he was supplanted by David Price for 2015.  Of these four, it seems likely only that Shields will continue.
  • 12 pitchers made their first opening day start in 2015, including our own Max Scherzer.
  • The most ever?  Tom Seaver with 16.  The most consecutive?  Jack Morris with 14.


cool stuff

Opening Day Starter Trivia – Updated for 2014

one comment

CC Sabathia continues to be the active leader in Opening Day starts. Photo via wiki/flickr.

Some of my favorite trivia questions  revolves around Opening Day Starters.  With another Opening Day in the books, here’s some useless trivia related to Opening Day starters.  I’ve updated my Opening Day Starters spreadsheet to Google Docs and created a link in the “Nationals Arm Race creation” section along the right.  Fyi, on a team-by-team basis you can query Baseball-Reference.com for the opening day lineups (here’s the Washington/Montreal franchise’ opening day lineup history as an example).

Current Active Leaders in Opening Day Starts

11 CC Sabathia
9 Mark Buehrle
7 Felix Hernandez
7 Justin Verlander
6 Bartolo Colon
6 Tim Hudson
6 Jered Weaver
6 James Shields
5 Josh Beckett
5 Yovanni Gallardo
4 Jake Peavy
4 Tim Lincecum
4 Clayton Kershaw
4 Jon Lester
3 Strasburg, Cueto, Wainwright, Price, Masterson, Nolasco
2 Lee, Samardzija, Liriano, Dickey, Sale, Feldman

Those players bolded in the list above had 2014 opening day starts and added to their totals.   (Note; there’s plenty of guys out there with 2 or 3 opening day starts but who did not extend their count in 2014; they are not included here).  With the retirement of Roy HalladayCC Sabathia extends his active lead in this category.  Mark Buehrle has given over the reigns of opening day starter possibly for good, based on his standing in the Toronto rotation.  Meanwhile the next closest competitors (Justin Vernalder and Felix Hernandez) could eventually supplant Sabathia, especially if he continues to struggle and gets replaced as the Yankees’ ace.

Felix Hernandez and Justin Verlander continue to be the best bets to broach the all-time records (see below) based on their ages, their current counts and their new long-term contracts.

Answers to other Opening Day start trivia:

Current Active Leader in consecutive Opening Day Starts: Sabathia with 9 consecutive, split among two teams.  Second is Verlander with 7 straight, albeit all with the same team.  There was talk about how his Cy Young-winning rotation mate Max Scherzer should have gotten the ball this year, given Verlander’s 2013 struggles.

Most ever Opening Day Starts all-timeTom Seaver with 16 in his career.

Most ever Consecutive Opening Day Starts: Hall of Fame lightning rod Jack Morris, who made 14 straight such starts.

Number of first-time opening day starters in 2014: Ten (10) guys got the ball on opening day for the first time, slightly down from last year’s 13.  Injuries gave some pitchers the ball on opening day over other expected rotation mates (this is definitely the case with the likes of Julio Teheran, Tanner ScheppersSonny Gray, Dillon Gee, Jorge De La Rosa), and its probably the case that others got the ball on opening day thanks to their own personal ascention to the “lead-dog” spot on their teams (Jose Fernandez, Madison Bumgarner).  The other three newbies (Andrew CashnerWade Miley, and Chris Tillman) probably fall somewhere inbetween these categories.

Who seems most likely to break Seaver or Morris’ Records at this point? Still Sabathia, who already has 11 opening day starts (and 9 straight), is the #1 in New York, is only 32 and still has four years on his current deal. However, he took a big step backwards in 2013 performance-wise, and the Yankees spent a ton of money on Masahiro Tanaka, and there could be a passing of the torch if Tanaka blows it out in 2014.  Meanwhile Hernandez already has 7 opening day starts, just signed a deal that takes him through 2019 with a relatively easy option for 2020.   That’s many more seasons under contract and he’d only be 34 years of age by its end.   He could be the standard holder if he stays healthy and continues to pitch like an ace.

Most Inconsisent team using Opening Day Pitchers: Oakland.  They’ve used 9 different opening day starters in the last 9 seasons, and that’s likely to continue since both the candidates for this year had injuries that forced them to go to a rookie for 2014.  Pittsburgh is right behind them;  they have used 7 different opening day starters in the last 7 seasons, and 13 different starters in the last 15 seasons. The Nats have at some point employed no less than three former Pittsburgh opening day starters: Ron Villone, Oliver Perez and Zach Duke.   Colorado, Baltimore and Minnesota have also struggled for most of the past decade to find a dominant, reliable “Ace” and constantly cycle through new opening day starters, and once again each is using a different guy in 2014.


Opening Day Starter Trivia

one comment

Sabathia is your current Active leader in Opening Day starts. Photo wiki/flickr chris.ptacek

One of my favorite annual trivia questions amongst my baseball buddies revolves around Opening Day Starters.  With another Opening Day in the books, here’s some useless trivia related to Opening Day starters for my readers.  I’ve uploaded my little Opening Day Starters spreadsheet to Google Docs and created a link in the “Nationals Arm Race creation” section along the right.

Current Active Leaders in Opening Day Starts

10 Roy Halladay
10 CC Sabathia
9 Mark Buehrle
6 Bartolo Colon
6 Derek Lowe
6 Tim Hudson
6 Felix Hernandez
6 Justin Verlander
5 Aaron Harang
5 Josh Beckett
5 Jered Weaver
5 James Shields
4 Jake Peavy
4 Barry Zito
4 Tim Lincecum
4 Yovani Gallardo

Those players bolded in the list above had 2013 opening day starts and added to their totals.  Roy Halladay‘s difficult spring training cost him his shot at Opening Day and thus CC Sabathia moves into a tie for first.  Mark Buehrle has given over the reigns of opening day starter possibly for good, based on his standing in the Toronto rotation (4th starter?).

Felix Hernandez and Justin Verlander have chances to broach the all-time records (see below) based on their ages, their current counts and their new long-term contracts.

Current Active Leader in consecutive Opening Day Starts: Verlander with 6 straight.

Most ever Opening Day Starts all-time: Tom Seaver with 16 in his career.

Most ever Consecutive Opening Day Starts: Hall of Fame lightning rod Jack Morris, who made 14 straight such starts.

Number of first-time opening day starters in 2013: no less than 13 first timers this year, nearly half the league.   Some guys got deserved first-time opening day starts (Jeff Samardzija, Matt Cain, and R.A. Dickey), some guys got Opening Day starts mostly out of attrition of other worthy pitchers (Jon Niese, Bud Norris, A.J. Burnett, Vance Worley and Jhoulys Chacin) and some guys are taking over as the new big-dog of their rotations (Brett Anderson, Chris Sale).

Who seems most likely to break Seaver’s Record at this point? Sabathia, who already has 10 opening day starts, is clearly the #1 in New York, is only 32 and still has five years on his current deal.  Question is, if he renews past 2017, can he still earn the #1 spot?   Meanwhile Hernandez already has 6, just signed a deal that takes him through 2019 with a relatively easy option for 2020.   That’s 8 more seasons on his existing 6 opening day starts and he’d only be 34 years of age.   He could be the standard holder if he stays healthy and continues to pitch like an ace.