Forecasting
Forecasting
Wednesday, November 15, 2023
Back in the early 2000s, when I started blogging heavily on baseball and hockey, I was intrigued, then aghast at the "forecasting" systems being offered, some for a price. They all came with a pseudo-promise of some sort or other.
This is the same thing with the stock market that I used to follow back in the 1990s. I saw an article at the time about evaluating stock predictions. And wouldn't you know it: only one of the ten brokerage houses even beat the index. Basically, nobody can predict anything really. No one has any special insight. You throw thousands of people together, and Random Variation will simply start putting some folks ahead of others.
It's also when I learned how Mutual Funds would get above-average results: you'd have a fund company that has two similar types of funds. One will do better than the other. Guess what happens: one absorbs the assets of the other, but NOT the history. So, now you get survivorship bias: all the remaining mutual funds are above average! And then they create a NEW second one, to keep that cycle going.
This is also how they sell those free betting tips. You call some 1-800 number with three picks being offered for free. Well, they set up 8 different lines, each with a different combination of picks. One of them will get all of them right, and therefore 12.5% of the callers will be happy with those results, and stick with that phone line.
Anyway, back to baseball. I decided to try my hand at forecasting. I started with something simple, and just used the three most recent seasons. It worked pretty well. Then I started adding more and more. And something curious happened. It would help for 51% of the batters and hurt 49% of the batters. No matter what I tried, other than age, nothing really stuck much. A different 51% of batters helped, but no real bias. Each iteration was alot of work, for such little gain. So, I decided to take a step back and decided to have as my baseline just a Naive model: last three seasons, age, and regression.
Then, I compared that to what was being published publicly, and something interesting happened: the Naive model was as good, or better than virtually everything out there. So, instead of trying to improve the model to try to get every little gain, I decided to publish as-is, and call it Marcel The Monkey Forecasting System, aka The Marcels, as the basic most simple forecasting system anyone should expect. So, instead of trying to be the best, I'm basically saying: this is the worst (acceptable). And boy did that clear the field. If you can't beat The Marcels, then what is the value-added of your system?
And so, I published it, and kept it up for a while. In the meantime, others have implemented my model (though without me checking their code, so I can't confirm they are totally faithful, but, I'm sure they are all excellent).
And that's how The Marcels work and came to be.
(1)
Comments
• 2023/11/15
•
Forecasting
Sunday, June 04, 2023
Yes, pretty much.
Dan did the study, which is excellent. You should read it, but I'll summarize it in bullet points:
- Grab all the forecasts as of June 1 of each season, 2014-2022, except 2020. That gives us 240 team seasons
- Compare the rest-of-season forecasts to the rest-of-season actual W-L records
- The RMSE is 54 points, which is excellent in comparison to their season-to-date record (RMSE of 69) and the coin-flip (RMSE of 72). The "gain" compared to the coin-flip is enormous relative to season-to-date
- In trying to use BOTH the rest-of-season forecast and the season-to-date W-L records, we can improve the rest-of-season forecast... all the way to an RMSE of 53 points (meaning barely anything new is learned using the season-to-date W-L records)
So, there you have it: the rest-of-season forecasts from Fangraphs do their job very well.
I would have liked to see Dan use my method as the baseline (add 35 W and 35 L to the actual record, and use that as the rest-of-season win%). I would guess the RMSE would be closer to the 54 than to the 69.
UPDATE: Click comments below to see updated research from Dan in response to my request above. Thank you to Dan!
(2)
Comments
• 2023/06/04
•
Forecasting
Monday, December 05, 2022
This is from Jan 2017, but it's the first time I see it. I think it's the first time anyway. Terrific job by @henrydruschel in doing the work. Jumping to the conclusion:
The only thing these results seem to say with any confidence: Marcel is shockingly good. It debuted nearly ten years ago, and these projection systems have existed for that long or longer as well. They still struggle to do any better than the system made to be as simple as possible. Predicting baseball: It’s really, really hard.
(2)
Comments
• 2022/12/06
•
Forecasting
Friday, May 27, 2022
Back around 2002 or so, I was getting really (really) tired with all of the baseball forecasting systems coming out of the woodwork, each one proclaiming it was better than the next.
I set out not to be the best, but to be the worst. I needed to create a Naive model, so simple, that we can measure all the forecasting systems against it. And so transparent that anybody could recreate it.
I called it The Marcels, which Id love to say it was named after Marcel Dionne or any other great Marcel out there. Unfortunately, it was a dated reference to Marcel The Monkey from Friends. In any case, it was so simple, a monkey could do it.
The model was straightforward:
- limit the data to the last three years, giving more weight to the more recent seasons
- include an aging component
- apply a regression amount
That's it. I basically modeled it the way a baseball fan might look at the back of a baseball card (sorry, yet another dated reference), and come up with a reasonable forecast. Very intuitive. And never, ever, would you get some outlandish or out of character forecast. Remember, I wasn't trying to be the best. I was just trying to create a system that seemed plausible enough to keep its head above water. The replacement level of forecasting systems.
And much to my surprise, it was not the worst. Indeed, it was one of the best. In some years, it actually was the best.
This had the benefit of what I was after: knocking out all those so-called forecasting systems that were really below replacement level. They had no business calling themselves forecasting systems, and especially trying to sell their inferior product to unsuspecting, and hungry, baseball fans.
What was left were forecasting systems that actually were good. Systems like Oliver, Chone, Pecota, Zips (at the time anyway). I don't know how they currently fare, or how the newer models perform. But I would presume they, along with Steamer, are the current state-of-the-art.
And while they may be better than Marcel, whatever advantage they have is going to be slight. I mean, we are talking about Marcel winning probably 48% of the individual head to head matchups. Everyone is really fighting for that 2%. If Marcel is an 81-win kind of a forecasting system, everyone else is an 82 or 83 win system. 84 if they've really tapped into something the others haven't. There's just not that much you can do, such is the power of Random Variation.
Anyway, the point here is that you should always (always) have a Naive model. It's the simplest, cleanest, most intuitive way to explain whether your system is at least treading water. And if it is (that's a big IF), how much better than Naive is it. This is what a saberist does: determine if something is real, and describe the magnitude of that reality. That's really the job. This is what a Saber Watchdog does. So when you look around, enjoy those Saber Watchdog moments.
(2)
Comments
• 2022/05/28
•
Forecasting
Saturday, May 23, 2020
I did this particular study 15-20 years ago. It was a good “starter” study. That is, sometimes, you just want to start small, to see whether it’s worth it to go further. It was also near the start of me doing research and blogging about it. So, it’s a bit raw. I kind of dismissed the 10% game gap, so I was probably a bit rushed there. I also didn’t consider the position of the player, and since speed and fielding are linked, that was an unfortunate miss. Finally, there was enough in here that I, or someone, should have taken the next step here. I was looking for a big win, when in reality, what we should be after are small wins. I don’t think I’ve seen anyone continue that study.
Until today. Bill James independently did his own study with his own question. And his sample size is far higher, and so, it reduces our uncertainty as to what the results mean. Whereas I had only 20 matched pairs, he had 1237 matched pairs. This is the REALLY funny part:
The speedsters average 75 more games for their post-30 career. Hardly a significant advantage.
But of most significance, the Speed Group played an average of 79 additional games in the rest of their careers.
The first line was written by me. The second by Bill twenty years later. Two different studies, done very differently. Coming to the same results. But we interpret the results very differently.
As I said, I was too quick to dismiss the results. Anyway, the floor is there for the aspiring saberists.
Sunday, March 01, 2020
The most productive combination of speed+angle for a batter is centered at 28 degrees of launch angle, at a speed of 95+ mph. Fans of Barrels already know this. Fans of baseball implicitly know this. Baseball players live it. The only thing that I am really doing at this point is quantifying the effect.
In 2019, at a launch angle of 24 to 32 degrees (average of 28), at a speed of 95+ mph (average of 100), the average wOBA on Contact (wOBAcon) is 1.261. For those new to wOBAcon: the average is between .350 and .400 depending on the year. League leaders are at .600. A single is .900. A Home Run is 2.000. So, a 1.261 is a sensational result. This is why we talk about “Launch Angle” as a noun, as a verb, as an adjective and adverb.
If you can hit it hard. A launch angle of 24 to 32 degrees, weakly hit balls that average 80mph have a wOBA of .269. The difference is that hard hit balls will go over the outfield, or even over the fence, while weakly hit balls at 28 degrees will go right to the outfielders. At 28 degrees, it is a high risk, high reward scenario. Batters that can hit balls 95+ will take that chance. Batters that can’t hit that benchmark regularly won’t consider 28 degrees a success. Those batters prefer a line drive angle.
Here’s a chart that shows the wOBAcon at each launch angle, based on whether you hit the ball hard or not. xwOBAcon is simply a metric that reflects the reality of a batted ball. If you happen to hit a 100mph groundball, you won’t get much success. As you can see in the chart, that’s a .287 wOBAcon.

But, but, but… hitting a ball at 100mph tells you something about the player: he can hit the ball hard. Just because he did not have success on THAT PLAY, it does tell you something about THAT PLAYER. The difference between the x-stats and the predictive-stats is this: x-stats describes THE PLAY, while predictive-stats describes THE PLAYER.
A good example are the two PLAYS I mentioned: weakly hit balls at 28 degrees launch has an ACTUAL result of .269 while strongly hit groundballs has an ACTUAL result of .287. Both similar, both very poor results. And xwOBAcon will result in a similar interpretation of those balls. But, but, but… which of those two plays tells you more about the BATTER? Is it the mishit for an easy out to the outfielder, or is it the scorcher that was hit right to an infielder?
Based on my adjectives, you know the answer. But, it’s not necessarily obvious. Here’s how a PREDICTIVE model looks, if we look at the speed+angle combination for each batter (which I will put side by side with the Actual):

What this says is that a hardhit groundball would count as a .515 wOBAcon for a PREDICTIVE model, even though its ACTUAL value is .287. And a weakly hit ball at a perfect launch angle would count as a .369 wOBAcon for a PREDICTIVE model, compared to the ACTUAL .269. In other words, BOTH balls tells us something more about a batter than the actual result itself. Hitting at 28 degrees is a good sign for a batter. Hitting at 100mph is a good sign for a batter. Those things override the mishit portion of those actual batted balls.
And if you look at each combination of speed+angle, you will notice a few things:
- the worst indicator for a hardhit ball (groundball, .515 wOBAcon) is better than the best indicator for a weakly hit ball (line drive or flyball); this tells us knowing how hard a batter can hit a ball is terrifically important indicator
- the best indicator for a hardhit ball is the worst outcome of them all: a strongly hit popup, 52 degrees, 100mph; why is that? Because it takes an immense amount of power to mishit a ball at such a horrible angle that you can STILL launch the ball off the bat at 100 mph
If you are looking for a quick summary to try to understand a player, you can break off his actual outcomes into 4 groups:
- balls hit 95+, at 24+ degrees: these are the best indicator of a batter’s talent
- balls hit 95+, under 24 degrees: these are a very solid indicator of a batter’s talent
- balls hit under 95, at 8-32 degrees: this tells you how average a batter is
- balls hit under 95, outside of 8-32 degrees: this tells you everything bad about a batter, mishitting on both speed and angle
So, be careful how you use xwOBAcon, as what you may really be after is Predictive wOBAcon
Monday, December 16, 2019
?While I'll be using Gerrit Cole as my illustration, this isn't about Gerrit Cole. It's about any great pitcher under 30. And by great, I don't mean great, but I mean GREAT.
First I'll ask an easy question: how old is Gerrit Cole? He was born Sept 8, 1990. That makes him 29. Unless I asked you on Sept 7, in which case he's 28. Welcome to the world of truncation and math. Age is the only calculation that we make that we've all agreed to truncate. And therein lies the problem. If we ask the age question on July 1, 2019, we're going to get a different answer for players born on June 30, 1990 and July 2, 1990, even though they are only 2 days apart: we will get an answer that is one year apart. Analytically, this makes no sense. Mathematically, this makes no sense.
On July 1, 2019, the mid-point of the season, Gerrit Cole was 28.81 years old. If we are looking for pitchers at a comparable age, you can look for pitchers in the season in question who were 28.31 to 29.31 years old, or 28.81 +/- 0.5. But, we don't have to limit it that way. We can also look for comparable pitchers that are +/- 1 year from his age, or pitchers who on July 1 were 27.81 to 29.81 years old.
You can actually go even wider, but then you get into two issues. The first is that we want to make sure that Cole is at the center of the pitchers in age. You don't want to go so wide that the comparable pitchers end up being say 6 months younger on average than Cole, or 4 months older. You really want him to be right in the middle. The second issue is linearity: you want to constrain it to a point such that the pitchers older and younger than him cancel out. The wider you go, the more likely you end with some pitchers on the upward slope of the curve and other pitchers on the downward slope of the curve.
Pedro Martinez was born on October 25, 1971. In the year 2000, on July 1, he was 28.68 years old, or 0.13 years younger than Cole. In 2001, he was 29.68 years old, or 0.87 years older than Cole. If we use BOTH Pedro seasons, then two-year Pedro is 0.37 years older than Cole. Both Pedro seasons are part of the GREAT pool of pitchers at Cole's age.
I created a quick metric, weighted WAR or wWAR, that is 60% WAR (as shown on Baseball Reference) in the year in question (year T), 30% year T-1 and 10% year T-2. I selected all pitchers born since 1922, with at least 5 wWAR. And who were within 1 year of Cole's age in 2019. I also limited to pitchers whose year in question was 2010 or earlier (so that I get a full 9 years).
The most recent pitchers to qualify, if we only focus on the elite of elite, at least 7 wWAR: Tim Hudson in 2003, then two Pedros, two Madduxes, a Rijo, two Clemenses, a Viola, a Stieb, two Guidrys, a Reuschel... I guess I should stop, but I'll keep going... a Catfish, two Seavers, two Fergies, Wilbur Wood, a Marichal, two Koufaxes, a Robin Roberts, and a pear tree. Those 23 seasons, each of which was at least 7 wWAR, averaged 8.1 wWAR. This is a ridiculously high performance level.
In their first year, they averaged 5.7 WAR. Wilbur Wood and Koufax were above 10, while Dave Stieb was under 0. Such is the life of a pitcher. Another way to say this: when you observe 8.1 WAR, it's actually being generated by a 5.7 WAR pitcher, who happened to be healthy and get alot more good luck than bad luck.
In their 2nd year, they averaged 5.0 WAR, losing Koufax in the process, with a sub-zero from Catfish, his last season. But they ALSO have the other Koufax. Remember, we've got two Koufaxes, spaced one year apart. So Koufax is both the best and worst performing pitcher in year 2.
And on and on we go. In year 3, it's a 4.5 WAR. Year 4, it's 3.8. Year 5, 3.1. And years 6 through 9: 2.5, 2.7, 1.9, 1.1.
If we add up all nine years, that's 30.4 WAR. In other words, we'd expect pitchers who have a wWAR of 8.1 over their last 3 years to generate 30.4 WAR in their next 9 years, or a multiple of 3.7.
What if we expanded our pool and looked at all pitchers with at least 6 wWAR? That's 46 seasons, with an average wWAR of 7.3, and a next 9 years of WAR of 24.4. That's a multiple of 3.3.
And if we look at all pitchers with at least 5 wWAR? The most recent pitchers include two seasons of each Wainwright, Haren, CC, Johan, and Webb. You can see the future right? That's an average of 6.3, which puts Cole close to the center. And the next 9 WAR averages 22.0. That's a multiple of 3.5.
This is how it looks: you are basically expecting some 20 to 25 wins, with a spread of 0 to 50 wins, and an outside shot of being Bob Gibson, Roger Clemens, Greg Maddux or Gaylord Perry.
?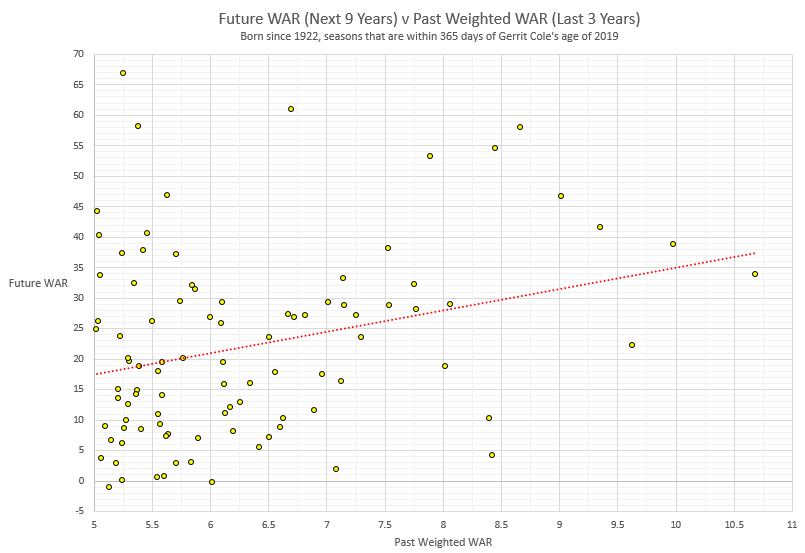
(click to embiggen)
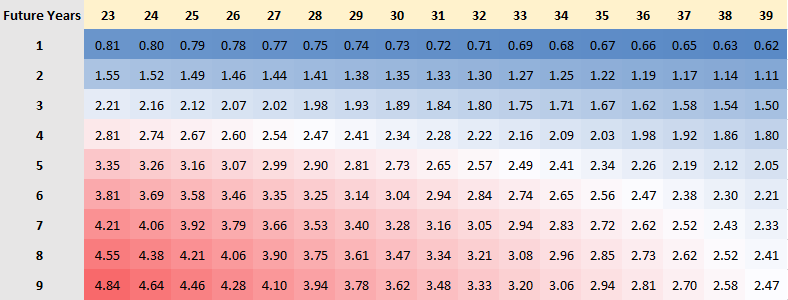
And here's the multiple table for any number of future years for any age, smoothed out. (Note this table is based on pitchers with at least 4 wWAR. So, you should be careful in extrapolating beyond that.)
Thursday, September 06, 2018
?This is not a new concept. I put a challenge out, and MGL took it up. And results look somewhat promising, and worthy of more research. This is what sabermetrics is all about.
(2)
Comments
• 2018/09/07
•
Forecasting
Wednesday, July 04, 2018
?As impressive as the results of MGL's first study is, it's the second study that basically suggests we should approach the first study differently. That is, don't establish hot or cold based on runs, but based on component-runs.
(2)
Comments
• 2018/07/06
•
Forecasting
Monday, June 11, 2018
?@EvolvingWild put out their model, complete with the code, step by step. It is a fantastic presentation.
One thing to be careful about is the term "predict". There's a difference between trying to "predict" (actually the expected value) a goal given the shot location, and trying to predict the number of FUTURE goals a player, say PK Subban will score based on his shooting PATTERN.
At the PLAYER LEVEL, this is the difference between having a DESCRIPTIVE stat and a PREDICTIVE stat.
At the THAT-PUCK-LEVEL, it is simply the "expected value".
If you try to merge THAT-PUCK with THAT-PLAYER, then it gets into a bit of a mess, trying to figure out the expected value of that-puck shot by that-player... but in a descriptive sense. It may LOOK predictive, but the reality is that you never will have THAT-PUCK data to predict with. You can try to infer that-shot-pattern for that-player.
Hope all that made sense. It's clear in my head.
Tuesday, December 19, 2017
?In the third of three articles that I enjoyed in the 2018 Shandler Baseball Forecaster, the author describes his Deserved HR idea. Longtime readers will think of MGL's Virtual HR, which at its core is essentially "UZR for HR". The same model is used by all sports. The real question is whether creating this metric adds value beyond just ACTUAL HR.
We see this in hockey as well, where NetShots has taken over from NetGoals in many analysts eyes, in predicting future NetGoals. (Goals, or Runs, or whatnot is what we are always after.) The volume of Shots, being over 10x to 20x that of goals is one reason why it excites analysts. However, by the time the number of games is large enough, the extra non-Goal Shots adds very little. So, the non-goal shots is a leading indicator... until you have enough goals... at which point those extra non-goal shots become a coincident indicator.(*)
(*) Term used by Tom Awad.
The same question would apply here. Based on the article, the results look promising, that two years of Actual HR is equivalent to one year of Deserved HR. You can see MGL's tweets from last night along with my followups, as for why we want Deserved HR as one component, but why we also don't want to go too far.
Therefore, what I'd like to see in future analysis for the aspiring saberists, is this:
- Create three pools of batted balls: (a) those that are both Actual and Deserved (b) those that are Actual but not Deserved (i.e., lucky) and (c) those that are Deserved by not Actual (i.e., unlucky)
- Compare the three pools to next year's data and see how much each pool predicts next year
If this is like NetGoals and NetNonGoalShots, we should expect to see the Actual carry more weight than the non-actual to some extent, and the more years you have the more the actual should carry. In other words, those pools that we think of as "lucky" may actually not be as lucky as it's presumed. They may look lucky based on this model, but only because the model doesn't account for everything.
Ok, since I am stuck on a train, I may as well blog this now.
Jeff Zimmerman has a fascinating finding in the 2018 Shandler Baseball Forecaster with regards to catching. Setting aside the potential selection bias with the non-catchers, that group provides the control group for what we see with the catchers. And that is, their performance is worse in the 2nd half than the 1st half.
?
The catchers are an interesting group. I looked at them for a Hardball Times Annual a few years ago, where I learned that catchers hit worse as catchers than as position players.
All of these findings "make sense" in that if you were to choose one position where you are told that you hit worse in the 2nd half than the 1st half, or you hit better after leaving a particular position, you would invariably say "catcher". The fun part of sabermetrics is quantifying the DEGREE to which this is true. It's rarely about finding about the "existence" of something, but more often about establishing the extent that something exists, and how can we find it to begin with. There's saber treasures out there, and were hunting them down. This one from Jeff should push for more research along those lines.
Monday, April 24, 2017
?Bill offers a new take on an old problem.
The traditional way is to follow the delta approach. You can see an article I did, along with the underlying data. A few years later, I tried something a bit different, which I may actually prefer, and that was the "five year window": for every player, beginning with his first year, choose his first five years and see where he peaks. Do that with his second year, using years 2 through 6. And so on.
Bill's method follows some combination of the two. He normalizes every player based on his career totals. Then he averages by age. It probably has the effect of depressing the results, because 2 and 3 years players are being compared with its own year already in there. It MIGHT be better if Bill were to compare to "rest of career" instead of "entire career". But then again, it has a sort of regression-toward-the-mean component built right in.
Anyway, you guys can compare Bill's results to mine (the component one), and see if there's anything that sticks out. One of the interesting findings of Bill, which confirmed what I had, was that the walk rate peaks very late (age 36 for Bill and 37 for me).
***
Note: I use a different definition of age from Bill. I have a math reason for it. If you love math, you'll agree with me. If you don't love math, you'll be 50/50. If you are an inertial reasoner, you will definitely not agree with me.
(5)
Comments
• 2017/04/25
•
Forecasting
Sunday, April 09, 2017
?@mitchellichtman
I don't know if this is an epiphany. One of the issues with looking at the forecasts of poorly forecasted players is that when one of them has a terrific start, he will keep playing, while those who have poor starts won't have a chance to keep pitching. And then we end up weighting the players based on playing time, giving more weight to the guys who got luckier.
So, when I saw this post from MGL, talking about Guthrie, I had a thought: what if MGL gives us the list of pitchers who he says is AA-level (or worse). And then we look at the FIRST game they play in MLB. And only the first game. Indeed, I would even say: let's look at the first 9 batters they face in MLB. Or even, just the very first batter.
I presume there's some 100 pitchers every year that MGL thinks is AA-level or worse who pitch each year, facing at least one batter. He does this for the last 10 years of his forecasts, and now we have 1000 PA of what should be AA-level or worse. Did they match MGL's forecasts? Or did the teams know something he didn't?
Friday, February 24, 2017
?Using the data collected from Jeff here, we can first compare the results of the Fangraphs Forecasts to what actually happened. That is a very healthy r=0.74. ZiPS+Steamer are giving you some great insights.
?
But as Jeff pointed out, some fans in March of 2016 weren't happy with some of the Fangraphs forecasts. Indeed, the two teams the Community thought were too low indeed ended up winning more than expected! The Royals and Jays collectively expected to win 161 games ended up winning together 170 wins, a difference of 9 wins. The Community had these two teams collectively at 170 wins.
We can more clearly say that the Community expected 6 more wins from the Royals and 3 more from the Jays, and they ended up actually with 4 and 5 respectively. So, good job on the Community.
On the low end however, the Community thought the forecasters were too high on: The Indians, The Cubs, and the Redsox, by 2 wins each. You can guess what happened here. Those three teams actually won 7, 6, and 5 more than forecasted.
When you look at all 30 teams, overall, there was zero value-added by the Community, over and above the Fangraphs Forecasts (r=.02).
It should be noted that the Fangraphs Forecasts includes the human-driven playing time forecasts, which have value. Therefore, the question is after you have that, and you have an automated model, is there any other gap that the community can further add. And the answer seems to be no.
Jeff is running this again this year, so let's see what happens in October.
(4)
Comments
• 2017/03/02
•
Forecasting
Thursday, January 05, 2017
?MGL takes a look. He shows that for pitchers who had a bad ERA overall, with some really bad starts in there, ending up matching MGL's forecast. His forecast did NOT include a "flag" for number of bad starts. It just looked at their overall seasonal stats.
More interestingly, MGL's control group is pitchers who had the (similar) bad ERA overall, without a big number of bad starts. Again, his forecast did not look for number of bad starts. And their overall forecast was the same as the studied group. Except this control group actually outperformed their forecast.
This tells me that either:
- MGL's forecasting system is not good enough (say 5% likelihood)
- Number of bad starts is actually a good indicator, but in the direction of "fewer bad starts, given same ERA as someone with many bad starts" in the positive direction (say 20% likelihood)
- Sample sizeitis (say 75% likelihood)
But for those hanging their hat on "if not for those really bad starts...", they won't find it here.
Tuesday, November 01, 2016
?The Marcels is a simple forecasting system. It is not only simple, but transparent. It is so simple and transparent that multiple people have implemented it on their sites or provided the code. I introduced it about 12 or 13 years ago, and have not made a change to it. It has taken on all-comers, and held its own. There are better ones. But those are better in the way that an 82, maybe 83 win team is better than an 81 win team. The goal of Marcel was always to be the minimum acceptable baseline, to be so simple and transparent that anyone can do it, and hopefully use it as their own core, where they would improve it on the periphery. There are many systems, or WERE anyway, that would be like a 73 or 75 win team, clearly below Marcel, not able to luck their way into being better. Those guys were always the pollution to forecasting, getting in the way, and I needed a way to mute those systems. That's what Marcel was, is, and will-be. That's why you see ZiPS and Steamer and MGL providing forecasts. They are not pollution.
Now, how about something EVEN SIMPLER? WAR already encapsulates a player's season. And we have multiple years for a player. Why not come up with something that ONLY uses a player's WAR? None of his components, none of his playing time, nothing except his WAR. And, I have to make it simple and transparent. And, not only forecast the upcoming year, but future years. The WAR Marcels... WARcels?
As usual, when it comes to creating a forecasting system, you go down that rabbit hole. You go down far enough and you are tempted to look at every little variable, improving it on the periphery, maybe making inroads for 1% of the players. But there's a reason that The Marcels has staying power: simple, transparent. That's the goal, that's the constraint.
Forecasting Year T+1:
Step 1: Take 60% of year T, 30% of year T-1, 10% of year T-2. Let's look at Edwin Encarnacion. For this example, I'm going to use the Baseball Reference version of WAR (rWAR). Later this week, I will do this for Fangraphs (fWAR) to confirm that this methodology will hold, and how the results will differ, if at all. His rWAR the last three years is: 3.7, 4.7, 3.6. That gives us a weighted average of 4.0.
Explanation: now you may think that the weights are too aggressive for the current time period, given that Marcel follows a 5/4/3 for hitters and 4/3/2 for pitchers model. However, that weighting scheme is for rate stats. For playing time, it uses a more aggressive 5/1/0 scheme. And since WAR is a combination of rate and playing time, we need a weighting scheme somewhere between the two. And a 6/3/1 fits the bill.
Step 2: Regression. Simply take 80% of the weighted WAR. Encarnacion is now at 3.2.
Explanation: now you may think we need playing time. And you'd be right, sort of. But given the constraints here of simply focusing on WAR, and given that WAR itself purports to represent itself as an overall metric, using playing time would undermine WAR. Indeed, what you'd want instead is WAR/PA and WAR/IP, which if you do that, you may as well do WAA/PA and WAA/IP. Which if you do that, you may as well rely on wRC+ and ERA+. Which if you do that, you may as well use The Marcels. (And eventually I will create something more granular, more based on components, more based on Statcast.) The idea for this metric is to NOT use The Marcels, but come up with something simpler than the most simple system. You have WAR in hand, let's just use that.
Step 3: compare the player's age in year T to the age of 30, where age is simply year T minus birth year. For every year away from age 30, add or subtract 0.1 wins. Obviously, add if he's under 30 and subtract if he's over 30. EE was born in 1983, which makes his calculated age 33 for the 2016 season, or 3 years beyond the peak of 30, or another 0.3 wins.
Explanation: A player who has a weighted WAR at age 28 of 4.0 and another player who had a weighted WAR at age 38 of 4.0 have historically shown to be around 3.2 the following year if 28 years old and 2.2 if 38 years old. Age makes a big difference.
So, for the 2017 season, Encarnacion gets a forecasted WAR of 2.9.
You may be thinking "darn, that is LOW! We started at 4.0 and we're down to 2.9?" There were 59 nonpitchers born since 1931 with a weighted WAR of between 3.5 and 4.5. In the following year, they averaged 2.8. This goes from a near high of his mate Bautista who at age 34 got a 6.1 WAR down to Nick Swisher of negative 1.2 WAR. Don't like Swisher as a comp? That's ok, other negative WAR at age 34: George Foster, Willie McCovey, Bobby Bonds.
Forecasting Year T+2 through T+5:
Year T+2: Start with your forecast of year T+1, and then subtract 0.4 wins. Then apply a further adjustment based on age. Compare his year T age to 30 and add or subtract 0.08 wins. EE gives us 2.89 minus 0.4 minus 0.24, or 2.25.
Year T+3: Take Year T+2, subtract 0.4. Compare his age to 30, and add or subtract 0.03 wins for each year away. EE gives us 2.25 - 0.4 - 0.09, or 1.76.
Year T+4: Take Year T+3, subtract 0.4. Compare his age to 30, and add or subtract 0.03 wins. EE gives us 1.76 - .4 - .09, or 1.27.
Year T+5: Take Year T+4, subtract 0.4. Compare his age to 30, and add or subtract 0.03 wins. EE gives us 1.27 - .4 - .09, or 0.78.
Encarnacion Comps:
So, over the next five years, his WAR forecast totals 9 wins. How does that compare to his comp group of 55 players (it was 59, but we lost guys who are too recent to give us 5 year forecasts)? Their 5-year actual WAR was 10 wins. That's on average. His best-case among recent players includes David Ortiz, Manny Ramirez, and Chipper Jones. His top 25th percentile averaged 18 wins. His worst-case scenarios includes: Bobby Bonds, Jim Rice, Albert Belle. His bottom 25th percentile averaged 2 wins. As you can see, forecasting is very difficult, since anything can happen.
So, there you have it... The WAR Marcels.
***
With this forecasting model as a framework, look for a deeper dive as they relate to this year’s free agent class on MLB.com in the coming days and weeks.
(9)
Comments
• 2018/03/20
•
Forecasting
Thursday, March 31, 2016
I sent this to Bill James, and I'd like to hear from the Straight Arrow readers as well.
If you created a baseball board game, and you produced a card for the 1998 Shane Spencer (10 HR, 73 PA), would you set his card so he'd AVERAGE 10 HR per 73 PA? Which means half the time, your sims would have him hit more than 10 HR per 73 PA? Or would you set his card so that 10/73 would happen say 10 or 15% of the time (meaning setting his card at around 6/73)? Similarly, Barry Bonds had 5 HR in 52 PA in 2005. Would you look at his neighboring seasons (rate of around 3.5/52), see that 5/52 is not that out of line, and set his card to 5/52 (or something close)?
Sunday, March 27, 2016
Yes, I think so.
So, I noticed something interesting, how it's harder to forecast. And it's harder to forecast when the talent level is tighter. So, this is what I did, 1998-2015 (30 team leagues). I figured the wOBA (or Linear Weights if you wish) for each player with at least 150 PA, along with his z-score, the number of standard deviations the player is from the mean. If you take the standard deviation of these z-scores, you will get a spread of talent. If there was no spread in talent at all, we'd expect the SD of the z-score to be exactly 1. That is, all of the observed spread in wOBA is identical to what we'd expect based just on random variation.
We get numbers much larger than 1, as expected. But, there was a change. Sudden and dramatic. From 1998-2003, the SD of the z-scores was between 1.72 and 1.82, averaging 1.77. From 2005-2009, it was 1.55 (range of 1.50 to 1.59). And during the new era of depressed runs and increased K, the SD of z-scores 2010-2015 is 1.54 (range of 1.49 to 1.59). In effect, the spread of talent was 13% wider 1998-2003 than it was 2005-2015.
In 2004, the year the policy took effect, the spread was 1.61, showing that the talent spread started to shrink rather suddenly, though not totally.
In terms of what I care about, forecasting and regression for component aging, this means we need to be a bit smarter about it.
In terms of what I don't care about, and what most others want to yap about to be part of the 24 hour news cycle: I'll look to see if I can come up with an "adjustment" to apply.
More to come...
Saturday, March 26, 2016
?You know how it goes right? Felix has been pitching so much for so long, how can he possibly keep going? You don't hear it like: Felix has been pitching so much for so long, he must be indestructible. That's because of the bias of the pitching arm, that it's just one pitch away from a being a blown tire. But, what in fact is the reality?
Is reality Don Sutton and Greg Maddux? From the time Sutton was a 21-yr old rookie, he's been pitching 200+ innings non-stop every year, except for a strike year and, basically, retirement, a feat that Maddux nearly matched. Or is reality Catfish Hunter, who after 4 straight seasons of top 5 Cy Young finishes had 700 IP left in his career?
The boring answer and the true answer is always "in the middle". But, where in the middle? Rather than start with an answer and construct the narrative, let's start with the question and find the answer.
***
I looked for all pitchers born between 1931 and 1980. At the age of 29, they had to have at least 2 WAR according to Baseball Reference, with at least 180 IP. In the 4 seasons from ages 26-29, they had to have a total of at least 14 WAR and a total of at least 700 IP. This gave me 64 pitchers. On average, these 64 pitchers had 5.3 WAR at age 29 (Felix had 4.4) and a total of 20 WAR at ages 26-29 (Felix had 21).
In the rest of their career, these pitchers had 22 WAR and 1444 IP (or the equivalent of 7 seasons of 206 IP. And this is what we would forecast for Felix, if we knew nothing about his career prior to age 26. But since we do know, let's continue.
The question: if you have a star pitcher who's been pitching great from age 26 to 29, does it matter how often he was pitching through to age 25, in determining how much baseball life he's got left at age 30 and later?
I will select from these 64 pitchers based on how many innings they threw prior to age 26, with the top 10 being the true young workhorses. They are, in order from most remaining bullets to least: Don Sutton, Greg Maddux, who lasted twice as long as the average of the 64. Then we have John Smoltz, Mark Buehrle who lasted right around the average. Then we continue with Vida Blue, CC Sabathia, Camilo Pascual, Don Drysdale, at about 70% of the group average. Finally we have the flameouts: Catfish Hunter and Sam McDowell.
As you can see, it's pretty much all over the place. On average, these 10 pitchers averaged 1406 IP after age 29, or the equivalent of 7 full seasons of 201 IP. That is, the most worked pitchers prior to age 26 is no different than the entire group, in terms of number of bullets remaining.
In terms of WAR, these 10 averaged 20 wins, which is a bit lower than the 22 for the whole group.

***
All-in-all, you will see stories of Felix, every year, of how he's one of the leaders in IP through age.... 26, 27, 28, 29. Every year you have seen those stories. And every year someone will write about "is this the year?". They do this because, eventually, some year WILL be the year. And no one remembers all the bad predictions. And when the predictions finally hits, the writer can stand up and say "See? I told you!" When that inevitably happens, you salute that writer, in whatever manner you think that prediction deserves.

Roy's salute (image) in his last game for Canadiens (video):
Recent comments
Older comments
Page 1 of 152 pages 1 2 3 > Last ›Complete Archive – By Category
Complete Archive – By Date
FORUM TOPICS
Jul 12 15:22 MarcelsApr 16 14:31 Pitch Count Estimators
Mar 12 16:30 Appendix to THE BOOK - THE GORY DETAILS
Jan 29 09:41 NFL Overtime Idea
Jan 22 14:48 Weighting Years for NFL Player Projections
Jan 21 09:18 positional runs in pythagenpat
Oct 20 15:57 DRS: FG vs. BB-Ref
Apr 12 09:43 What if baseball was like survivor? You are eliminated ...
Nov 24 09:57 Win Attribution to offense, pitching, and fielding at the game level (prototype method)
Jul 13 10:20 How to watch great past games without spoilers