 +
+## Types of Animation
+
+#### Lifecycle Demonstration
+
+
+
+
+
+
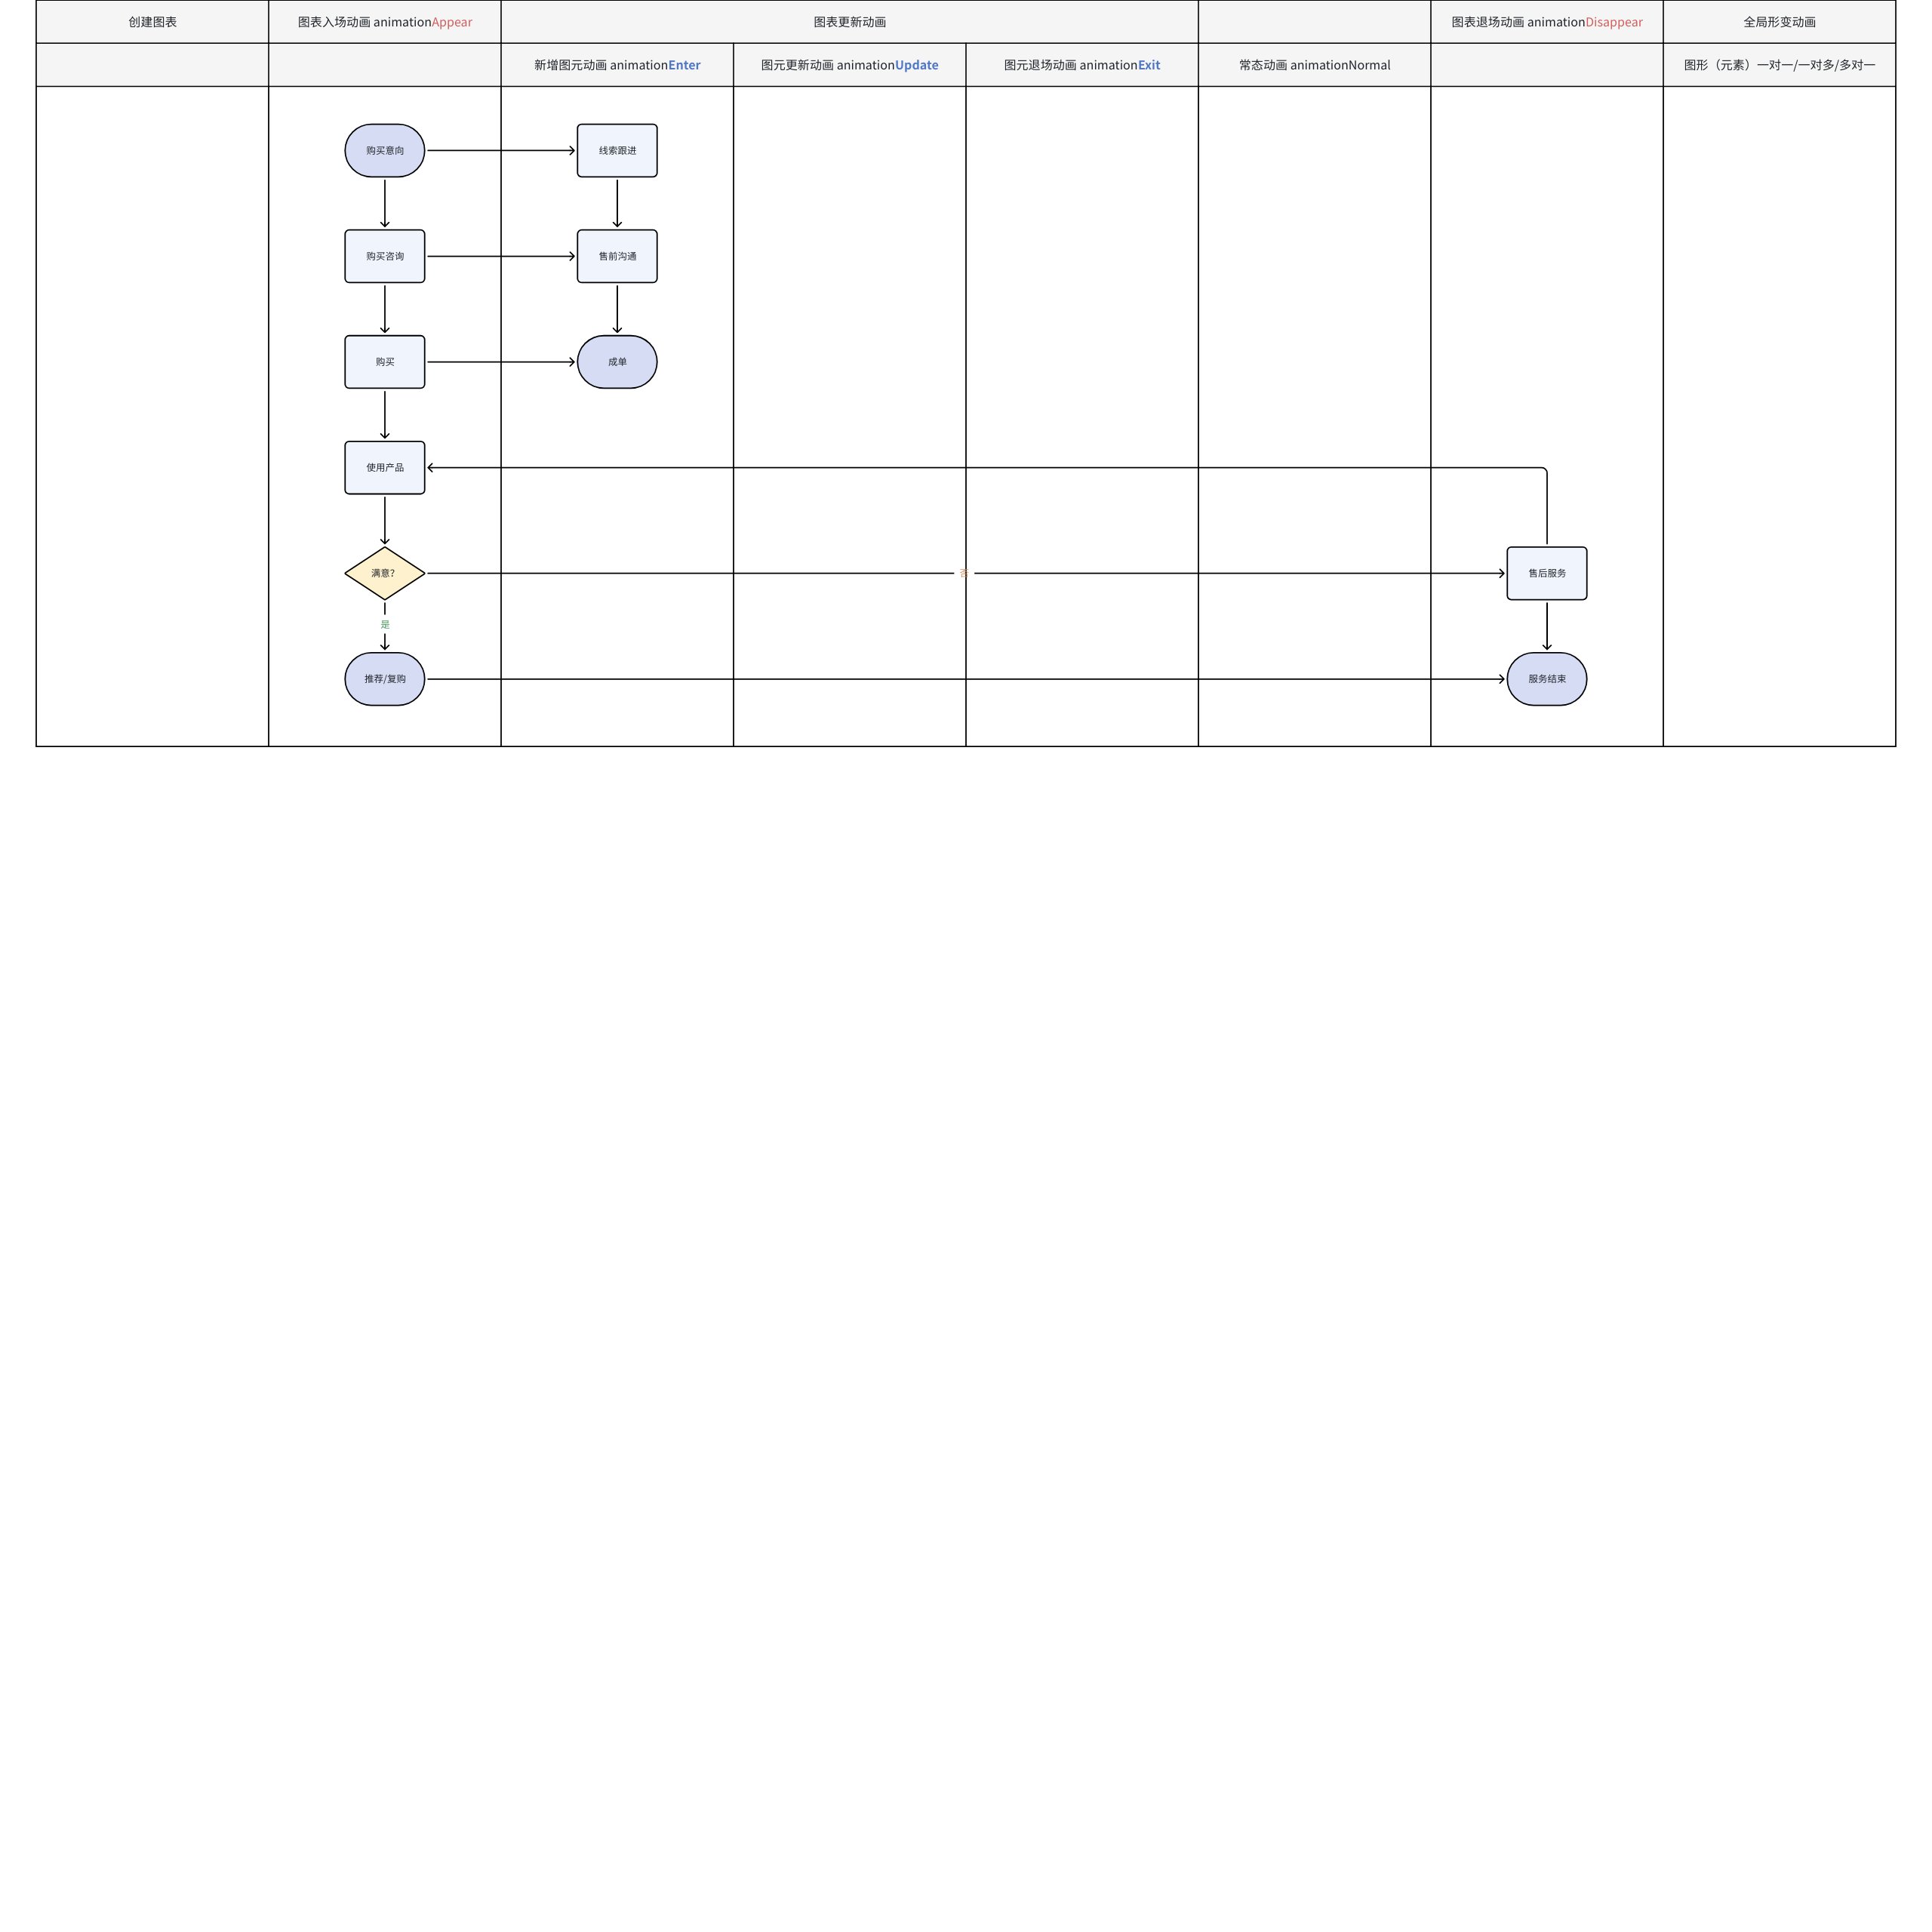
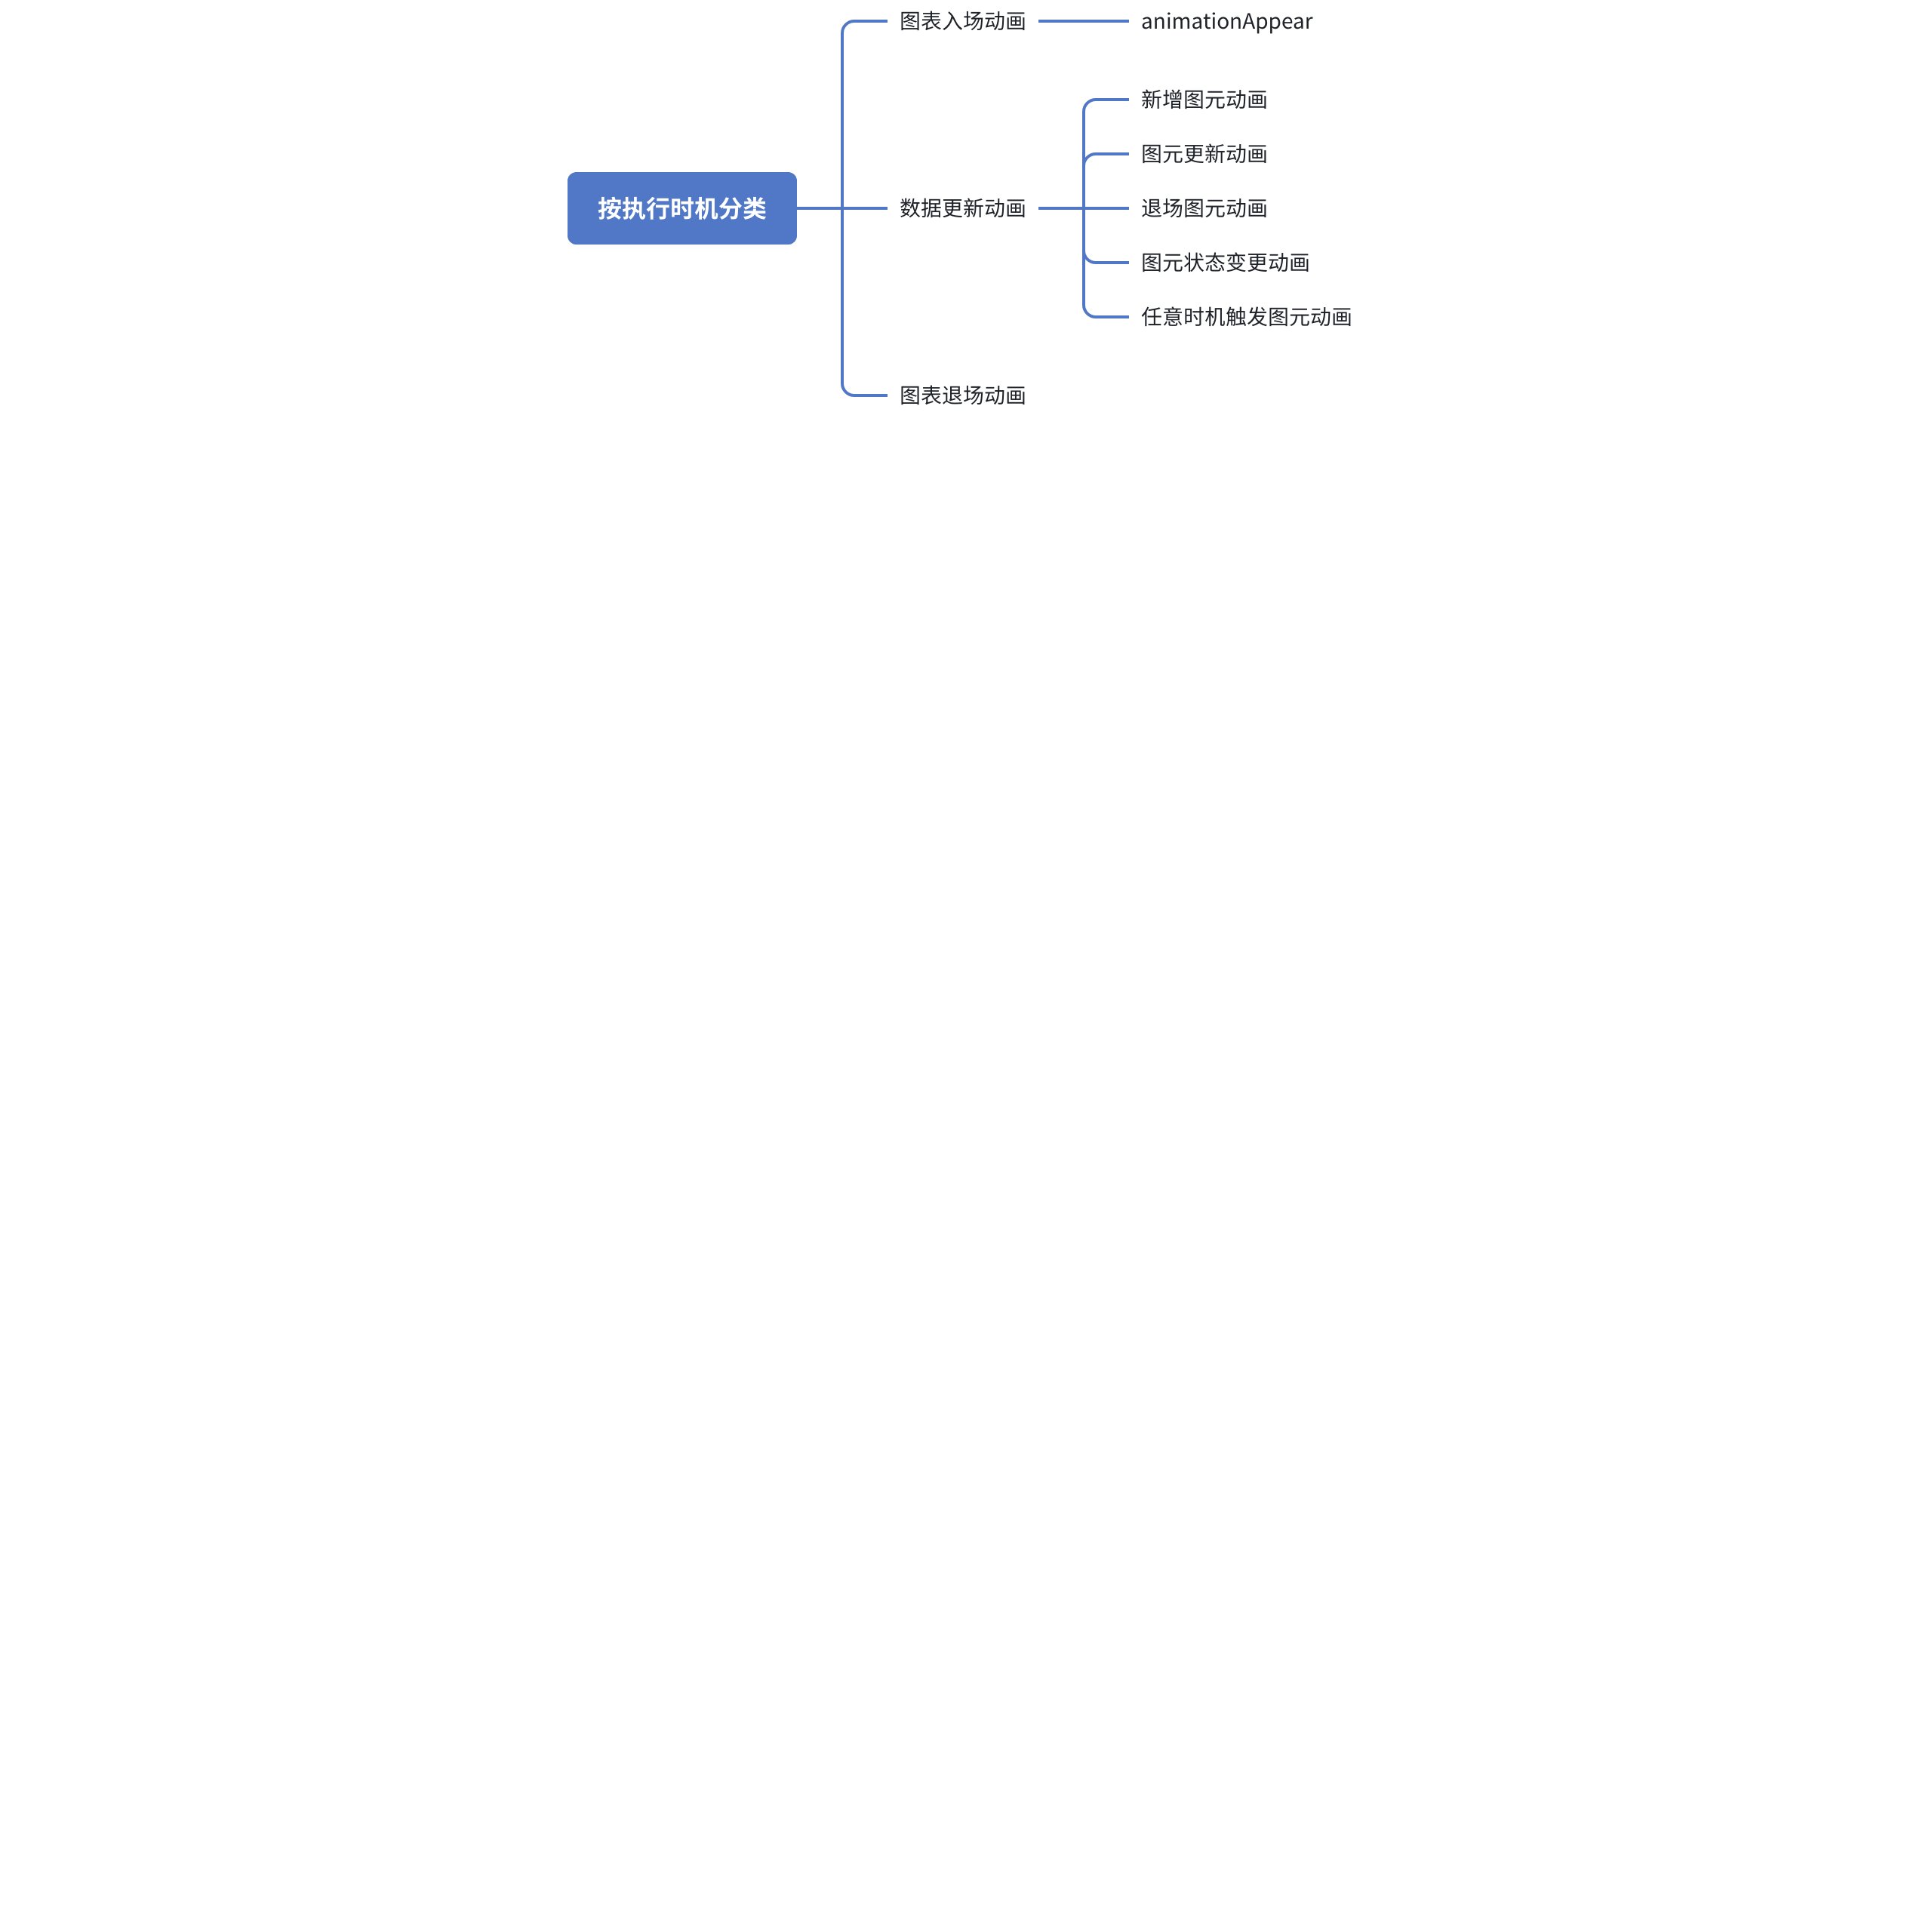
+### Classified by Execution Timing
+
+Chart animations in VChart are categorized based on state scenarios (execution timing) into: **Chart Entrance Animation**, **Data Update Animation**, and **Chart Exit Animation**.
+
+1. **Chart Entrance Animation:** Refers to the animation effect when the chart is created.
+
+1. **Data Update Animation:** When we update the chart data, the attribute animation of the graphic elements is called data update animation. It is divided into: **New Element Animation**, **Element Update Animation**, and **Exit Element Animation, State Change Animation, Animation Triggered at Any Time**. Usually, you don't need to worry about how to control these three update animations, as VChart will identify the association between the new data and the previous data during data updates, thus correctly executing the update animation.
+
+1. **Chart Exit Animation:** In some scenarios, we may need to remove the chart. At this time, we can set an exit animation for the chart to provide a smooth transition animation effect before removal.
+
+
+
+https://visactor.io/vchart/guide/tutorial_docs/Animation/Animation_Types Animation tutorial documentation
+
+https://www.visactor.io/vchart/option/barChart#animationState Animation configuration documentation
+
+#### Chart **Entrance Animation (**`**animationAppear**`**)**:
+
+* The transition effect of elements from nothing to something when the chart is first rendered.
+
+* Example code: The `animationAppear` configuration item is used to define the chart entrance animation.
+
+
+
+## Types of Animation
+
+#### Lifecycle Demonstration
+
+
+
+
+
+
+### Classified by Execution Timing
+
+Chart animations in VChart are categorized based on state scenarios (execution timing) into: **Chart Entrance Animation**, **Data Update Animation**, and **Chart Exit Animation**.
+
+1. **Chart Entrance Animation:** Refers to the animation effect when the chart is created.
+
+1. **Data Update Animation:** When we update the chart data, the attribute animation of the graphic elements is called data update animation. It is divided into: **New Element Animation**, **Element Update Animation**, and **Exit Element Animation, State Change Animation, Animation Triggered at Any Time**. Usually, you don't need to worry about how to control these three update animations, as VChart will identify the association between the new data and the previous data during data updates, thus correctly executing the update animation.
+
+1. **Chart Exit Animation:** In some scenarios, we may need to remove the chart. At this time, we can set an exit animation for the chart to provide a smooth transition animation effect before removal.
+
+
+
+https://visactor.io/vchart/guide/tutorial_docs/Animation/Animation_Types Animation tutorial documentation
+
+https://www.visactor.io/vchart/option/barChart#animationState Animation configuration documentation
+
+#### Chart **Entrance Animation (**`**animationAppear**`**)**:
+
+* The transition effect of elements from nothing to something when the chart is first rendered.
+
+* Example code: The `animationAppear` configuration item is used to define the chart entrance animation.
+
+ +
+```html
+
+
+
+
+
+```
+```xml
+animationAppear?: boolean | IStateAnimateSpec
+
+```html
+
+
+
+
+
+```
+```xml
+animationAppear?: boolean | IStateAnimateSpec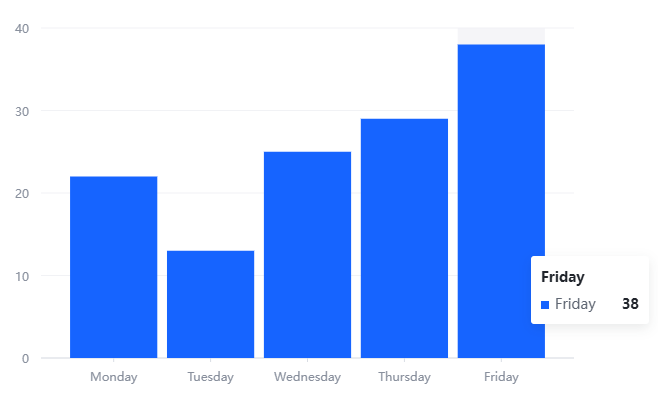 +
+```html
+
+
+
+
+
+
+```
+> How to create a basic VChart can be referred to in the following documents
+> https://www.visactor.io/vchart/guide/tutorial_docs/Getting_Started Quick Start
+> https://www.visactor.io/vchart/guide/tutorial_docs/Basic/How_to_Import_VChart Import VChart
+> https://www.visactor.io/vchart/guide/tutorial_docs/Basic/A_Basic_Spec Basic Configuration
+> https://www.visactor.io/vchart/guide/tutorial_docs/Basic/DeepSeek_With_Cursor DeepSeek+Cursor Assistance
+
+
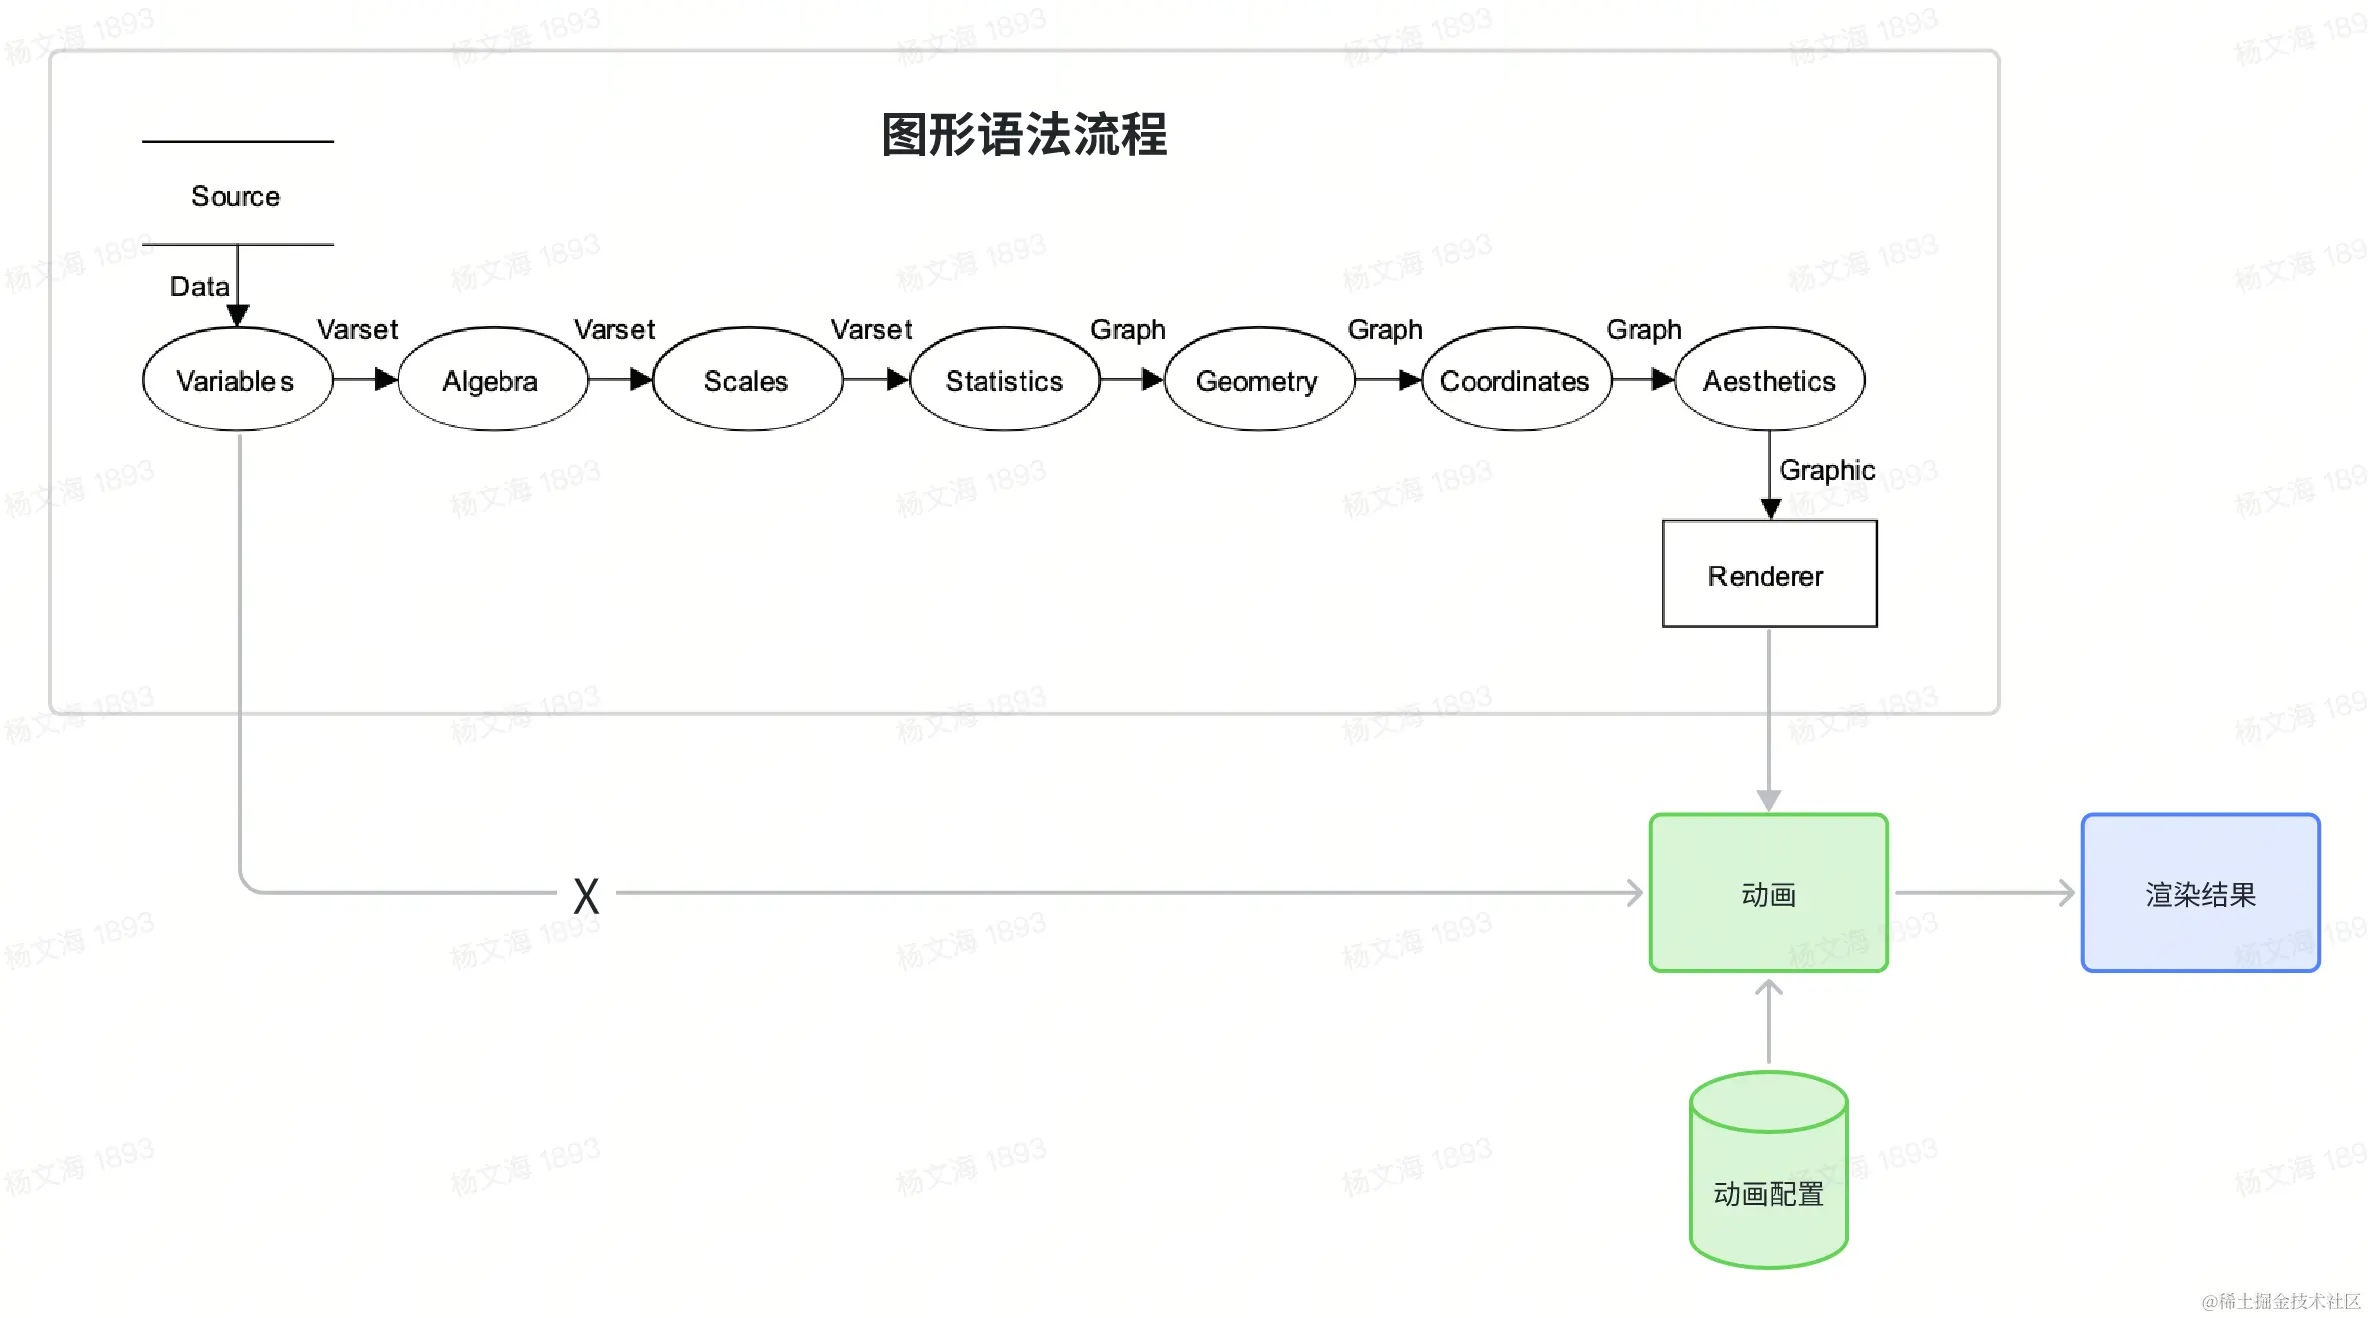
+In the `VChart` class, the `animation` configuration item in `spec` (chart configuration) is used to control the animation behavior of the chart. Specifically, the `animation` configuration item can define the animation effects of the chart in different states, such as entrance animation, update animation, exit animation, etc.
+
+#### The role of `animation` configuration
+
+1. **Define animation behavior**:
+
+* The `animation` configuration item can contain multiple sub-properties, such as `appear`, `enter`, `update`, `exit`, and `disappear`, corresponding to different animation scenarios.
+
+* Each sub-property can further configure parameters such as animation duration (`duration`), easing function (`easing`), whether to execute one by one (`oneByOne`), etc.
+
+1. **Control animation switch**:
+
+* If `animation` is set to `false`, all animation effects are disabled.
+
+* If set to `true` or a specific configuration object is provided, the corresponding animation effects are enabled.
+
+1. **Pass to underlying components**:
+
+* The `VChart` class will pass the `animation` configuration to the internal `Compiler` and `Chart` instances, which will decide whether and how to apply animations based on the configuration.
+
+### Example explanation of bar chart animation execution
+
+
+
+```html
+
+
+
+
+
+
+```
+> How to create a basic VChart can be referred to in the following documents
+> https://www.visactor.io/vchart/guide/tutorial_docs/Getting_Started Quick Start
+> https://www.visactor.io/vchart/guide/tutorial_docs/Basic/How_to_Import_VChart Import VChart
+> https://www.visactor.io/vchart/guide/tutorial_docs/Basic/A_Basic_Spec Basic Configuration
+> https://www.visactor.io/vchart/guide/tutorial_docs/Basic/DeepSeek_With_Cursor DeepSeek+Cursor Assistance
+
+
+In the `VChart` class, the `animation` configuration item in `spec` (chart configuration) is used to control the animation behavior of the chart. Specifically, the `animation` configuration item can define the animation effects of the chart in different states, such as entrance animation, update animation, exit animation, etc.
+
+#### The role of `animation` configuration
+
+1. **Define animation behavior**:
+
+* The `animation` configuration item can contain multiple sub-properties, such as `appear`, `enter`, `update`, `exit`, and `disappear`, corresponding to different animation scenarios.
+
+* Each sub-property can further configure parameters such as animation duration (`duration`), easing function (`easing`), whether to execute one by one (`oneByOne`), etc.
+
+1. **Control animation switch**:
+
+* If `animation` is set to `false`, all animation effects are disabled.
+
+* If set to `true` or a specific configuration object is provided, the corresponding animation effects are enabled.
+
+1. **Pass to underlying components**:
+
+* The `VChart` class will pass the `animation` configuration to the internal `Compiler` and `Chart` instances, which will decide whether and how to apply animations based on the configuration.
+
+### Example explanation of bar chart animation execution
+
+ +
+
+
+#### Example Code
+```xml
+import { isMobile } from 'react-device-detect';
+import { default as VChart } from '../../../../src/index';
+
+// 1. 创建图表配置项与数据
+const initialSpec = {
+ type: 'bar',
+ data: [
+ {
+ id: 'barData',
+ values: [
+ { month: 'January', sales: 22 },
+ { month: 'February', sales: 13 },
+ { month: 'March', sales: 25 },
+ { month: 'April', sales: 29 },
+ { month: 'May', sales: 38 }
+ ]
+ }
+ ],
+ xField: 'month',
+ yField: 'sales',
+ crosshair: {
+ xField: { visible: true }
+ },
+ animation: true // 开启动画
+};
+
+// 2. 创建 VChart 实例
+const vchart = new VChart(initialSpec, { dom: 'chart' });
+
+// 3. 渲染图表
+vchart.renderAsync().then(() => {
+ console.log('图表渲染完成');
+});
+
+// 4. 动画入场
+setTimeout(() => {
+ console.log('动画入场');
+}, 1000);
+
+// 5. 数据更新(新增图元)
+setTimeout(() => {
+ const newData = [
+ { month: 'June', sales: 45 },
+ { month: 'July', sales: 50 }
+ ];
+ vchart.updateDataSync('barData', newData, undefined, { reAnimate: true });
+ console.log('新增图元');
+}, 3000);
+
+// 6. 数据更新(图元更新)
+setTimeout(() => {
+ const updatedData = [
+ { month: 'January', sales: 30 },
+ { month: 'February', sales: 20 },
+ { month: 'March', sales: 35 },
+ { month: 'April', sales: 39 },
+ { month: 'May', sales: 48 },
+ { month: 'June', sales: 55 },
+ { month: 'July', sales: 60 }
+ ];
+ vchart.updateDataSync('barData', updatedData, undefined, { reAnimate: true });
+ console.log('图元更新');
+}, 6000);
+
+// 7. 数据更新(图元退出)
+setTimeout(() => {
+ const remainingData = [
+ { month: 'January', sales: 30 },
+ { month: 'February', sales: 20 },
+ { month: 'March', sales: 35 },
+ { month: 'April', sales: 39 },
+ { month: 'May', sales: 48 }
+ ];
+ vchart.updateDataSync('barData', remainingData, undefined, { reAnimate: true });
+ console.log('图元退出');
+}, 9000);
+
+// 8. 图元状态(state)的使用
+setTimeout(() => {
+ vchart.updateState(
+ {
+ selected: {
+ style: {
+ fill: 'red'
+ }
+ }
+ },
+ (series, mark, stateKey) => {
+ return mark.datum.sales > 40;
+ }
+ );
+ console.log('图元状态更新');
+}, 12000);
+
+// 9. 图表退场
+setTimeout(() => {
+ vchart.release();
+ console.log('图表退场');
+}, 15000);
+
+```
#### 创建逻辑说明
+1. **Create Chart Configuration and Data**:
+1. **Create VChart Instance**:
+1. **Render Chart**:
+1. **Animation Entrance**:
+1. **Data Update (Add Elements)**:
+1. **Data Update (Update Elements)**:
+1. **Data Update (Remove Elements)**:
+1. **Use of Element State**:
+1. **Chart Exit**:
+
+
+* Defined an initial chart configuration `initialSpec`, which includes chart type, data, axis fields, and animation configuration.
+
+* The data section includes a dataset `barData`, initially containing sales data for 5 months.
+
+* Create a VChart instance using `initialSpec` and the DOM container `chart`.
+
+* Call the `renderAsync` method to asynchronously render the chart. Once the chart is rendered, the animation entrance effect is triggered.
+
+* After rendering, simulate the animation entrance using `setTimeout`. The actual animation effect is handled internally by VChart.
+
+* After 3 seconds, add two months of sales data using the `updateDataSync` method. The `reAnimate: true` parameter ensures an animation effect when adding data.
+
+* After 6 seconds, update all elements' data using the `updateDataSync` method. The `reAnimate: true` parameter ensures an animation effect when updating data.
+
+* After 9 seconds, remove two months of sales data using the `updateDataSync` method. The `reAnimate: true` parameter ensures an animation effect when removing data.
+
+* After 12 seconds, update the state of elements using the `updateState` method. Here, a `selected` state is set, changing the fill color of elements to red when their `sales` value is greater than 40.
+
+* After 15 seconds, destroy the chart instance using the `release` method, exiting the chart.
+
+---
+
+
+
+### Source Code Implementation Process
+
+1. **Initialize VChart Instance**
+
+When you create a `VChart` instance and pass in `spec`, the constructor handles the `animation` configuration:
+
+File: `vchart.ts` Method: `constructor`
+
+```xml
+constructor(spec: ISpec, options: IInitOption) {
+ this._option = mergeOrigin(this._option, { animation: (spec as any).animation !== false }, options);
+ *// ...*
+}
+
+```
+This code ensures that if animation is not explicitly disabled in `spec` (i.e., `animation !== false`), then animation is enabled.
+
+1. Set a new spec and initialize the chart
+
+In the `VChart` class, the `_setNewSpec` method is used to set a new `spec` and convert it to a format used internally:
+
+File: `vchart.ts` Method: `_setNewSpec`
+
+```xml
+private _setNewSpec(spec: any, forceMerge?: boolean): boolean {
+ if (!spec) {
+ return false;
+ }
+ if (isString(spec)) {
+ spec = JSON.parse(spec);
+ }
+ if (forceMerge && this._originalSpec) {
+ spec = mergeSpec({}, this._originalSpec, spec);
+ }
+ this._originalSpec = spec;
+ this._spec = this._getSpecFromOriginalSpec();
+ return true;
+}
+
+```
+Next, the `initChartSpec` method initializes the chart specifications based on `spec`:
+
+File: `vchart.ts` Method: `initChartSpec`
+
+```xml
+private _initChartSpec(spec: any, actionSource: VChartRenderActionSource) {
+ *// 如果用户注册了函数,在配置中替换相应函数名为函数内容*
+ if (VChart.getFunctionList() && VChart.getFunctionList().length) {
+ spec = functionTransform(spec, VChart);
+ }
+ this._spec = spec;
+ if (!this._chartSpecTransformer) {
+ this._chartSpecTransformer = Factory.createChartSpecTransformer(
+ this._spec.type,
+ this._getChartOption(this._spec.type)
+ );
+ }
+ this._chartSpecTransformer?.transformSpec(this._spec);
+ *// 插件生命周期*
+ this._chartPluginApply('onAfterChartSpecTransform', this._spec, actionSource);
+ this._specInfo = this._chartSpecTransformer?.transformModelSpec(this._spec);
+ *// 插件生命周期*
+ this._chartPluginApply('onAfterModelSpecTransform', this._spec, this._specInfo, actionSource);
+}
+
+```
+1. Create and initialize Chart instance
+
+In the `_initChart` method, create and initialize the chart instance:
+
+File: `vchart.ts` Method: `_initChart`
+
+```xml
+private _initChart(spec: any) {
+ if (!this._compiler) {
+ this._option?.onError('compiler is not initialized');
+ return;
+ }
+ if (this._chart) {
+ this._option?.onError('chart is already initialized');
+ return;
+ }
+ const chart = Factory.createChart(spec.type, spec, this._getChartOption(spec.type));
+ if (!chart) {
+ this._option?.onError('init chart fail');
+ return;
+ }
+ this._chart = chart;
+ this._chart.setCanvasRect(this._currentSize.width, this._currentSize.height);
+ this._chart.created(this._chartSpecTransformer);
+ this._chart.init();
+ this._event.emit(ChartEvent.initialized, {
+ chart,
+ vchart: this
+ });
+}
+
+```
+1. Update Animation State
+
+When the chart needs to be re-rendered or updated, the `_updateAnimateState` method is called to update the animation state:
+
+File: `vchart.ts` Method: `_updateAnimateState`
+
+```xml
+private _updateAnimateState(initial?: boolean) {
+ if (this._option.animation) {
+ const animationState = initial ? AnimationStateEnum.appear : AnimationStateEnum.update;
+ this._chart?.getAllRegions().forEach(region => {
+ region.animate?.updateAnimateState(animationState, true);
+ });
+ this._chart?.getAllComponents().forEach(component => {
+ component.animate?.updateAnimateState(animationState, true);
+ });
+ }
+}
+
+```
+* **Initial State**: If `initial` is `true`, set the animation state to `AnimationStateEnum.appear` (entrance animation).
+
+* **Update State**: Otherwise, set it to `AnimationStateEnum.update` (update animation).
+
+1. Render the chart
+
+In the `renderSync` and `renderAsync` methods, the `animation` configuration is passed to the compiler for rendering:
+
+File: `vchart.ts` Method: `_renderSync`
+
+```xml
+protected _renderSync = (option: IVChartRenderOption = {}) => {
+ const self = this as unknown as IVChart;
+ if (!this._beforeRender(option)) {
+ return self;
+ }
+ *// 填充数据绘图*
+ this._compiler?.render(option.morphConfig);
+ this._afterRender();
+ return self;
+};
+
+```
+1. Update of Animation State
+
+In the `updateSpec` and `updateCustomConfigAndRerender` methods, the `reAnimate` flag is used to decide whether to re-trigger the animation:
+
+File: `vchart.ts` Methods: `updateSpec` and `updateCustomConfigAndRerender`
+
+```xml
+if (userUpdateOptions?.reAnimate) {
+ this.stopAnimation();
+ this._updateAnimateState(true);
+}
+
+```
+
+
+### Overview of Animation System Design
+
+
+
+The animation system design of VChart follows the principles of modularity, extensibility, and easy configuration, aiming to provide developers with a flexible and powerful tool to create rich animation effects. Below are the key components of the system and their working principles:
+
+### Principles
+
+#### 1. Animation Interface and Abstraction
+
+
+
+* **IAnimate Interface**: Defines the methods and properties that all animations must implement, including obtaining a unique ID, updating animation state, and getting the state signal name.
+
+*
+
+* **IAnimationSpec Interface**: Specifies the structure of animation configuration, covering various animation settings from entrance to exit.
+
+
+
+classDiagram
+
+ class AnimationStateEnum {
+
+ --Enum--
+
+ appear: AnimationStateEnum
+
+ disappear: AnimationStateEnum
+
+ enter: AnimationStateEnum
+
+ update: AnimationStateEnum
+
+ exit: AnimationStateEnum
+
+ state: AnimationStateEnum
+
+ normal: AnimationStateEnum
+
+ none: AnimationStateEnum
+
+ }
+
+
+
+ class IAnimate {
+
+ <>
+
+ +updateAnimateState(state: AnimationStateEnum, noRender?: boolean): void
+
+ +getAnimationStateSignalName(): string
+
+ +id: number
+
+ }
+
+
+
+ class ICartesianGroupAnimationParams {
+
+ <>
+
+ +direction(): "x" | "y"
+
+ +orient(): "positive" | "negative"
+
+ +width(): number
+
+ +height(): number
+
+ }
+
+
+
+ class AnimateManager {
+
+ --Attributes--
+
+ -_stateMap: IAnimateState & StateMap
+
+ +id: number
+
+ --Methods--
+
+ +updateAnimateState(state: AnimationStateEnum, noRender?: boolean): void
+
+ +getAnimationStateSignalName(): string
+
+ +constructor()
+
+ }
+
+
+
+ class MarkAnimationSpec {
+
+ --Attributes--
+
+ appear: IAnimationConfig
+
+ enter: IAnimationConfig
+
+ update: IAnimationConfig[]
+
+ exit: IAnimationConfig
+
+ disappear: IAnimationConfig
+
+ }
+
+
+
+ class IAnimationSpec {
+
+ --Attributes--
+
+ animationAppear: boolean | IStateAnimateSpec | IMarkAnimateSpec
+
+ animationEnter: boolean | ICommonStateAnimateSpec | IMarkAnimateSpec
+
+ animationUpdate: boolean | ICommonStateAnimateSpec | IMarkAnimateSpec
+
+ animationExit: boolean | ICommonStateAnimateSpec | IMarkAnimateSpec
+
+ animationDisappear: boolean | ICommonStateAnimateSpec | IMarkAnimateSpec
+
+ animationState: boolean | IStateAnimationConfig
+
+ animationNormal: IMarkAnimateSpec
+
+ }
+
+
+
+ class IStateAnimateSpec {
+
+ --Attributes--
+
+ duration?: number
+
+ delay?: number
+
+ easing?: EasingType
+
+ oneByOne?: boolean
+
+ preset?: Preset | false
+
+ }
+
+
+
+ class ICommonStateAnimateSpec {
+
+ --Attributes--
+
+ duration?: number
+
+ delay?: number
+
+ easing?: EasingType
+
+ oneByOne?: boolean
+
+ }
+
+
+
+ class IMorphSeriesSpec {
+
+ --Attributes--
+
+ enable?: boolean
+
+ morphKey?: string
+
+ morphElementKey?: string
+
+ }
+
+
+
+ class IAnimateState {
+
+ --Attributes--
+
+ animationState: { callback: (datum: any, element: IElement) => AnimationStateEnum }
+
+ }
+
+
+
+ class IAnimationConfig {
+
+ --Attributes--
+
+ type?: string
+
+ channel?: string
+
+ custom?: Function
+
+ customParameters?: Function
+
+ oneByOne?: boolean | number
+
+ duration?: number
+
+ easing?: EasingType
+
+ delay?: number
+
+ delayAfter?: number
+
+ }
+
+
+
+ % Relationships
+
+ AnimationStateEnum "1" --|> "many" AnimateManager: Uses
+
+ AnimateManager "1" --|> "1" IAnimate: Implements
+
+ AnimateManager "1" -- "1" ICartesianGroupAnimationParams: Depends
+
+ IAnimationSpec "1" -- "many" spec.ts: Defined in
+
+ MarkAnimationSpec "1" -- "1" config.ts: Used by config.ts
+
+ IAnimationConfig "1" -- "many" utils.ts: Processed by utils.ts
+
+ IStateAnimateSpec "1" -- "1" ICommonStateAnimateSpec: Inherits
+
+ IAnimationSpec "1" -- "1" IStateAnimateSpec: Associates
+
+ IAnimationSpec "1" -- "1" IMorphSeriesSpec: Associates
+
+ IAnimateState "1" -- "1" AnimateManager: Internally used
+
+ IAnimationConfig "1" -- "1" ICommonStateAnimateSpec: Inherits
+
+
+
+#### 2. Animation Manager
+
+
+
+* **AnimateManager Class**: Inherits from `StateManager` and implements the `IAnimate` interface, responsible for managing the state of animations and providing methods to update animations based on the incoming state. It handles the update and retrieval of animation states and updates animation states based on different states.
+
+
+
+#### 3. Factory Pattern
+
+
+
+* **Factory Class**: Used to register new animation types, allowing custom animation logic to be added to chart components. Through the static method `registerAnimation`, specific types of animations can be associated with their configurations for easy subsequent calls.
+
+
+
+#### 4. Animation Configuration Generation
+
+
+
+* **animationConfig Function**: Generates the final animation configuration based on default and user-provided configurations. This function traverses all animation states (such as appear, enter, update, etc.) and constructs a complete animation configuration object based on user or default configurations.
+
+
+
+#### 5. Animation Task Interface
+
+
+
+* **IAnimationTask Interface**: Defines the data structure of an animation task, which is crucial for understanding complex animation sequences. Each task contains time offsets, action queues, and successor task lists, forming a chain-like animation execution mechanism.
+
+
+
+#### 6. Specific Implementation of Animation
+
+
+
+* Each specific chart series (such as bar chart, pie chart, scatter plot, etc.) has its own animation implementation files, which contain preset animation functions for that series. For example, a bar chart may have growth animations, fade-in animations, etc.; a pie chart may have sector expansion animations, etc.
+
+
+
+
+Through the above steps, we have completed a simple yet complete animation process creation. In this process, we utilized the modular design of the VChart animation system to handle chart configuration, animation registration, chart instantiation, data updates, and animation state management separately. This design not only makes the code clearer and more readable but also enhances the system's flexibility and maintainability. Developers can easily customize different types of animation effects according to actual needs, thereby enhancing user experience.
+
+
+
+To better understand and interpret these source files, it is recommended to read them in the following order:
+
+1. `**interface.ts**`
+
+* **Reason**: This file defines the core types and interfaces in the animation module, such as `AnimationStateEnum`, `IAnimateState`, and `IAnimate`. Understanding these types and interfaces is the foundation for subsequent code.
+
+* **Key Content**:
+
+* Animation state enumeration `AnimationStateEnum`
+
+* Animation state interface `IAnimateState`
+
+* Animation interface `IAnimate`
+
+1. `**spec.ts**`
+
+* **Reason**: This file defines the specifications for animation configuration, including `ICommonStateAnimateSpec`, `IStateAnimateSpec`, and `IAnimationSpec`. These specifications are used in actual animation configurations, so it is necessary to understand their structure first.
+
+* **Key Content**:
+
+* Common properties of animation configuration `ICommonStateAnimateSpec`
+
+* Animation state configuration `IStateAnimateSpec`
+
+* Animation specification `IAnimationSpec`
+
+1. `**config.ts**`
+
+* **Reason**: This file provides default animation configurations and some preset animation registration functions. Understanding these default configurations helps in understanding how to customize animation configurations.
+
+* **Key Content**:
+
+* Default animation configuration `DEFAULT_ANIMATION_CONFIG`
+
+* Preset animation registration functions (such as `registerScaleInOutAnimation`, `registerFadeInOutAnimation`, etc.)
+
+1. `**utils.ts**`
+
+* **Reason**: This file contains many utility functions for generating and processing animation configurations. Understanding how these functions work can help you better understand how animation configurations are applied.
+
+* **Key Content**:
+
+* Function to generate animation configuration `animationConfig`
+
+* Function to process user animation configuration `userAnimationConfig`
+
+* Utility functions (such as `produceOneByOne`, `shouldMarkDoMorph`, etc.)
+
+1. `**animate-manager.ts**`
+
+* **Reason**: This file implements the `AnimateManager` class, which is the core class for managing animations. Understanding the implementation of this class can let you know how animations are managed and updated.
+
+* **Key Content**:
+
+* Implementation of the `AnimateManager` class
+
+* Method to update animation state `updateAnimateState`
+
+* Method to get animation state signal name `getAnimationStateSignalName`
+
+### Summary
+
+Reading these files in the above order can gradually build an understanding of the entire animation module. Start from the basic types and interfaces, gradually delve into specific configurations and implementation details, and finally understand how animations are managed and applied.
+
+### Reading Order Summary
+
+* `**interface.ts**` Core types and interfaces
+
+* `**spec.ts**` Animation configuration specifications
+
+* `**config.ts**` Default configurations and preset animations
+
+* `**utils.ts**` Utility functions and configuration generation
+
+* `**animate-manager.ts**` Animation management class implementation
+
+ # This document was revised and organized by the following personnel
+ [玄魂](https://github.com/xuanhun)
\ No newline at end of file
diff --git a/docs/assets/contributing/en/sourcecode/10.2-global-morphing-animation.md b/docs/assets/contributing/en/sourcecode/10.2-global-morphing-animation.md
new file mode 100644
index 0000000000..faf75a122b
--- /dev/null
+++ b/docs/assets/contributing/en/sourcecode/10.2-global-morphing-animation.md
@@ -0,0 +1,556 @@
+---
+title: 10.2 Global Morphing Animation
+
+key words: VisActor,VChart,VTable,VStrory,VMind,VGrammar,VRender,Visualization,Chart,Data,Table,Graph,Gis,LLM
+---
+## 10.2 Global Morphing Animation
+
+Score: 8
+
+1. Global Animation:
+
+1. Code Entry: `packages/vchart/src/animation/`
+
+1. Key Points:
+
+1. Implementation of Global Animation
+
+1. Other Reference Documents:
+
+https://www.visactor.io/vchart/guide/tutorial_docs/Animation/Animation_Types
+
+https://www.visactor.io/vrender/guide/asd/Basic_Tutorial/Animate
+
+https://visactor.io/vgrammar/guide/guides/animation
+
+[Magic Frame (Part 1): The Principle of Animation Implementation in Front-end Chart Libraries - A vivid visualization work often involves animation. Whether it's various charts or narrative works, organizing the week - Juejin](https://juejin.cn/post/7275270809777520651)
+
+In 10.1, we initially learned about the design of the animation system in VChart and the creation examples of charts. This section continues to introduce the transition design when switching between different chart configurations in VChart.
+
+### Definition
+
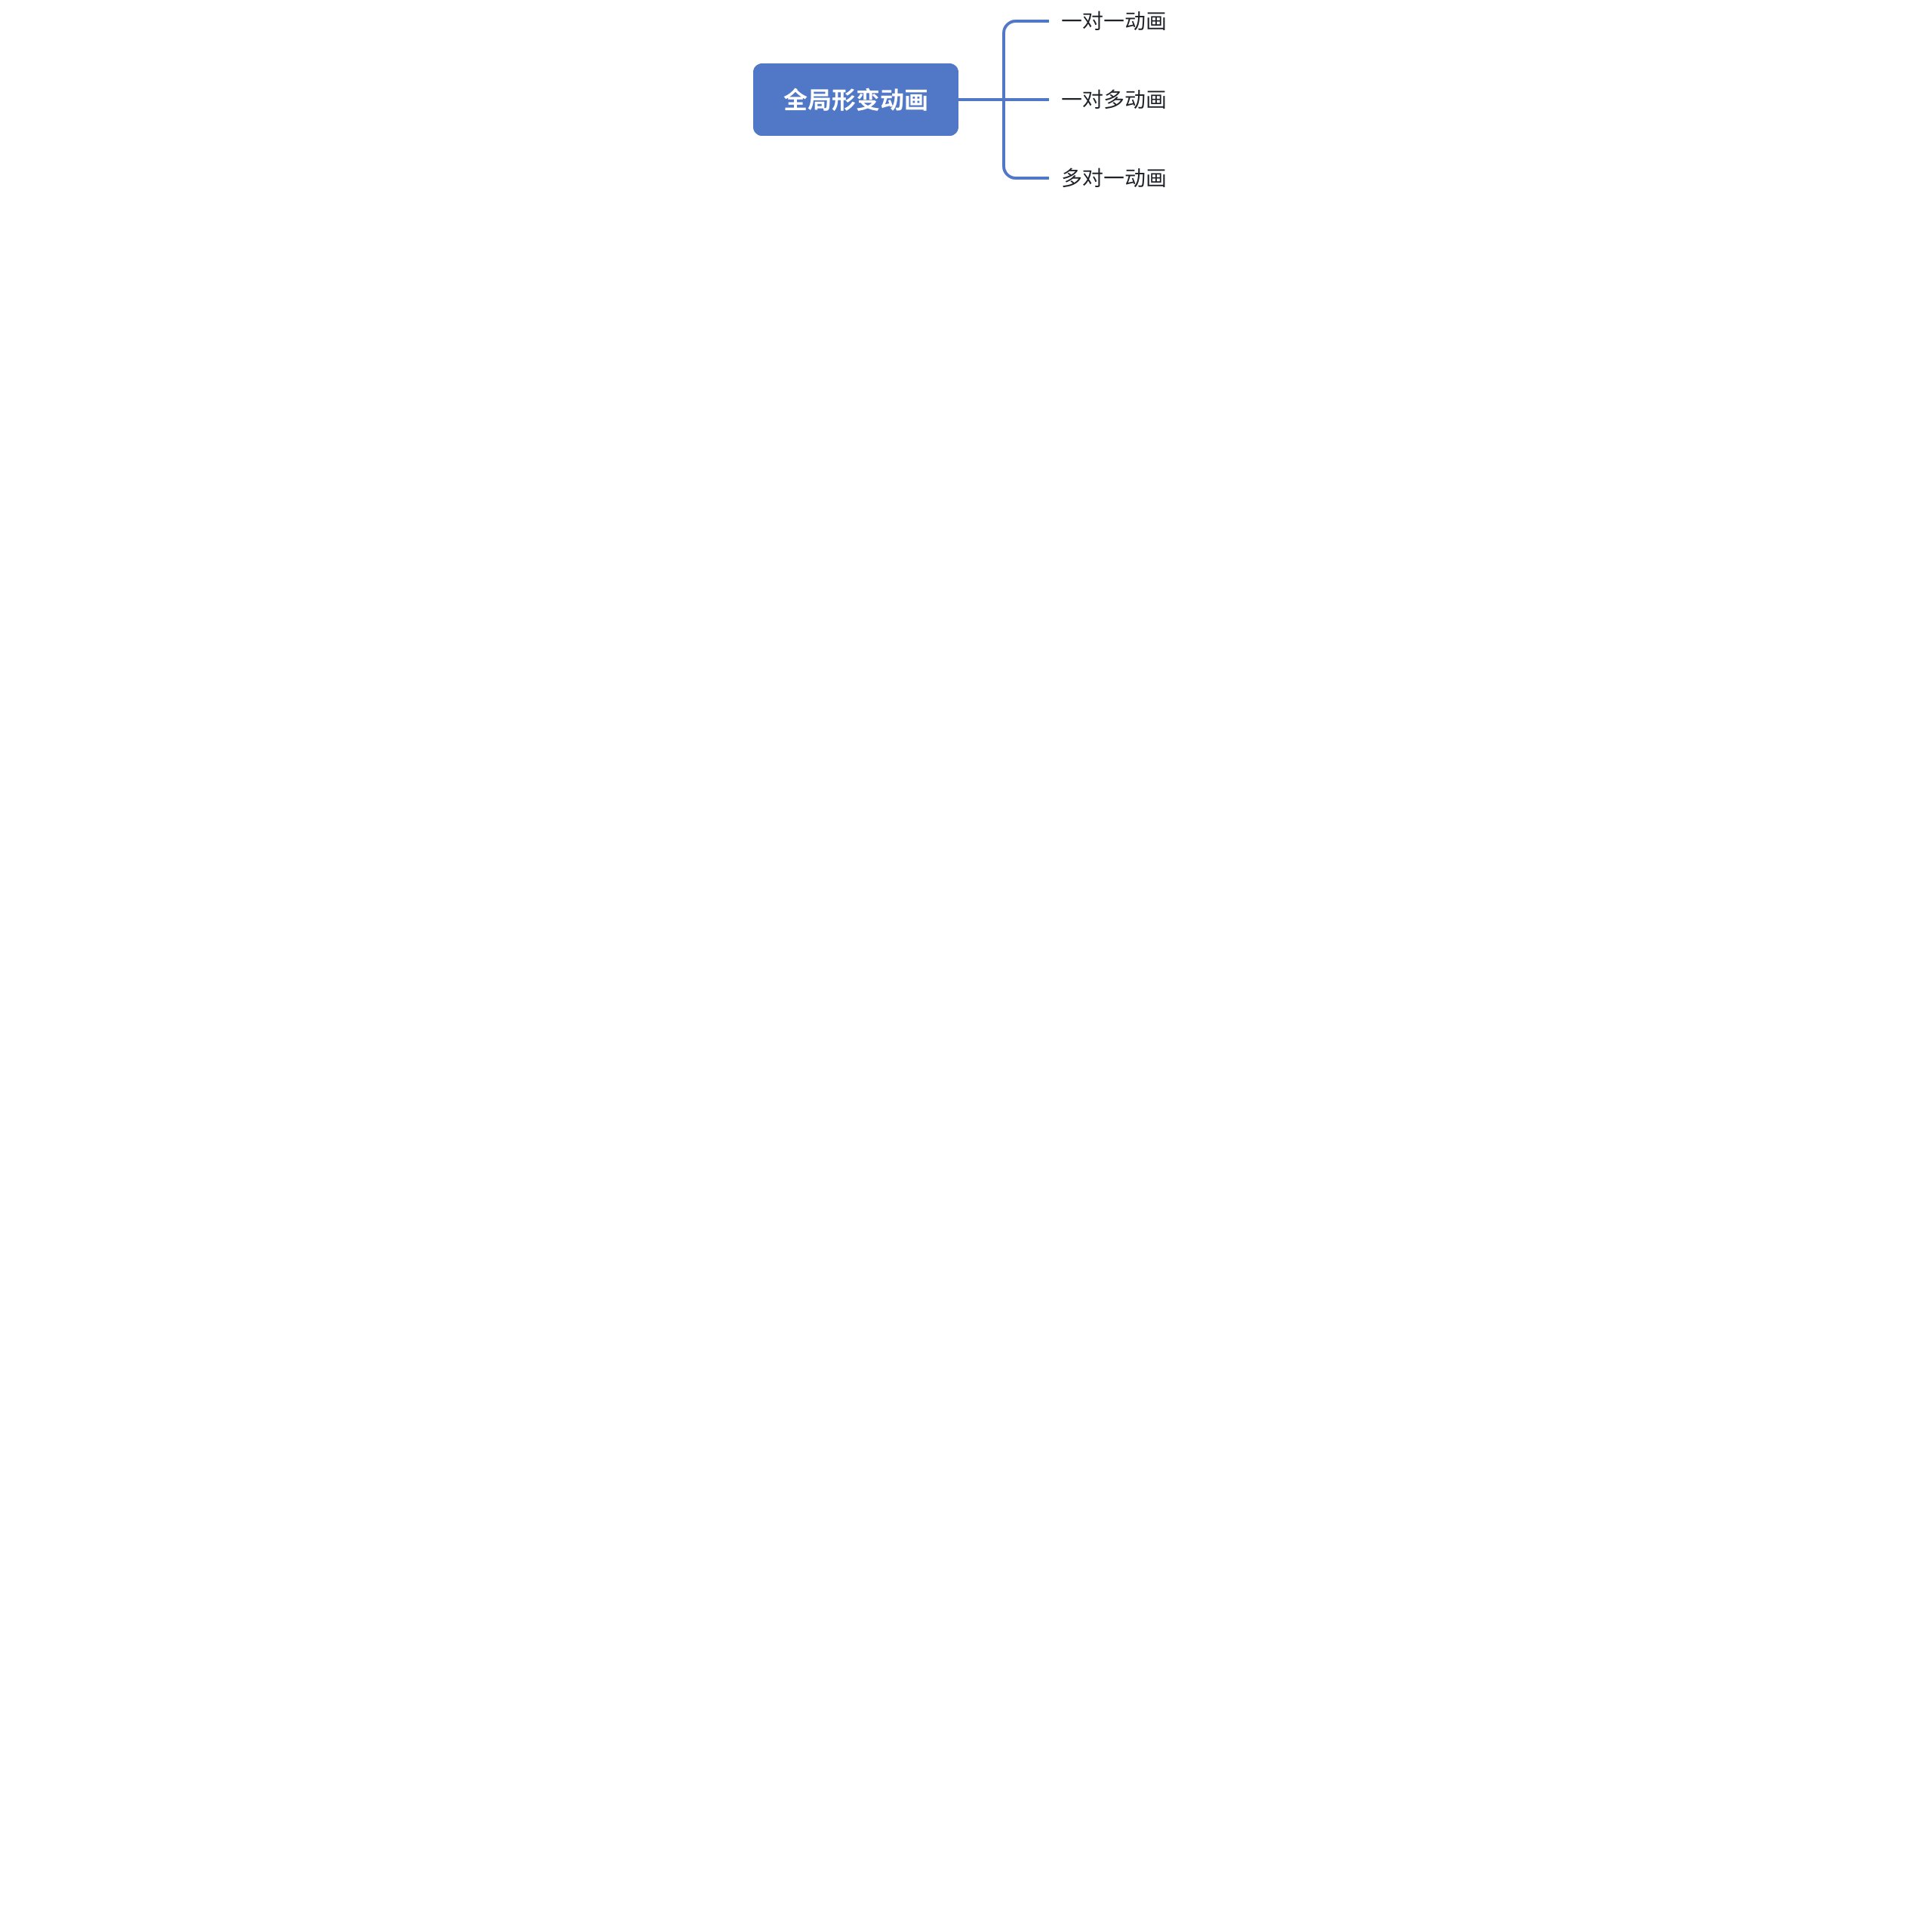
+VChart provides morphing animations for switching between related series, which we call **global morphing animations**.
+
+When updating the chart configuration through `updateSpec`, VChart will detect whether the two related series of the old and new charts meet the conditions for morphing animation, thereby executing dynamic transitions between **one-to-one, one-to-many, or many-to-one graphics**. Global morphing animations allow users to have a better visual experience when the type of chart being displayed changes, avoiding the feeling of instantaneous change. After all, visual comfort is an important factor we should focus on in the process of displaying and analyzing data.
+
+> https://visactor.com/vchart/api/API/vchart Reference API Documentation
+>
+
+```Typescript
+updateSpec
+异步spec 更新,会自动渲染图表不需要再调用 renderAsync() 等渲染方法。
+/**
+ * spec 更新
+ * @param spec
+ * @param forceMerge 是否强制合并,默认为 false
+ * @param morphConfig morph 动画配置
+ * @returns
+ */
+updateSpec: (spec: ISpec, forceMerge?: boolean, morphConfig?: IMorphConfig) => Promise;
+
+```
+
+
+
+### Example of Effects
+
+Below are two example configurations to illustrate the effects of this type of transition animation:
+
+#### One-to-One Animation
+
+One-to-one animation refers to the transition animation between two different graphics. For example, in the example below, it shows the global animation when switching between a pie chart and a bar chart:
+
+ +
+
+
+```xml
+/**
+ * 自1.12.0后,全局形变动画需要手动注册才能生效
+ *
+ * import { registerMorph } from '@visactor/vchart';
+ *
+ * registerMorph();
+ */
+
+VCHART_MODULE.registerMorph();
+
+const pieSpec = {
+ type: 'pie',
+ data: [
+ {
+ values: [
+ { type: '1', value: Math.random() },
+ { type: '2', value: Math.random() },
+ { type: '3', value: Math.random() }
+ ]
+ }
+ ],
+ outerRadius: 0.8,
+ innerRadius: 0.6,
+ valueField: 'value',
+ categoryField: 'type',
+ tooltip: false
+};
+
+const barSpec = Object.assign({}, pieSpec, {
+ type: 'bar',
+ xField: 'type',
+ yField: 'value',
+ seriesField: 'type'
+});
+
+const specs = [pieSpec, barSpec];
+
+const vchart = new VChart(specs[0], { dom: CONTAINER_ID });
+
+vchart.renderSync();
+let count = 1;
+setInterval(() => {
+ vchart.updateSpec(specs[count % 2]);
+ count++;
+}, 2000);
+
+
+```
+
+#### One-to-Many Animation
+
+One-to-many animation refers to the transition of a single graphic element into multiple graphic elements. For example, in the example below, a global animation is shown when switching between a bar chart and a scatter plot, where the animation of splitting a large bar into multiple scatter points is a one-to-many animation.
+
+
+
+
+
+```xml
+/**
+ * 自1.12.0后,全局形变动画需要手动注册才能生效
+ *
+ * import { registerMorph } from '@visactor/vchart';
+ *
+ * registerMorph();
+ */
+
+VCHART_MODULE.registerMorph();
+
+const pieSpec = {
+ type: 'pie',
+ data: [
+ {
+ values: [
+ { type: '1', value: Math.random() },
+ { type: '2', value: Math.random() },
+ { type: '3', value: Math.random() }
+ ]
+ }
+ ],
+ outerRadius: 0.8,
+ innerRadius: 0.6,
+ valueField: 'value',
+ categoryField: 'type',
+ tooltip: false
+};
+
+const barSpec = Object.assign({}, pieSpec, {
+ type: 'bar',
+ xField: 'type',
+ yField: 'value',
+ seriesField: 'type'
+});
+
+const specs = [pieSpec, barSpec];
+
+const vchart = new VChart(specs[0], { dom: CONTAINER_ID });
+
+vchart.renderSync();
+let count = 1;
+setInterval(() => {
+ vchart.updateSpec(specs[count % 2]);
+ count++;
+}, 2000);
+
+
+```
+
+#### One-to-Many Animation
+
+One-to-many animation refers to the transition of a single graphic element into multiple graphic elements. For example, in the example below, a global animation is shown when switching between a bar chart and a scatter plot, where the animation of splitting a large bar into multiple scatter points is a one-to-many animation.
+
+ +
+
+```javascript
+/**
+ * 自1.12.0后,全局形变动画需要手动注册才能生效
+ *
+ * import { registerMorph } from '@visactor/vchart';
+ *
+ * registerMorph();
+ */
+
+VCHART_MODULE.registerMorph();
+
+function calculateAverage(data, dim) {
+ let total = 0;
+ for (let i = 0; i < data.length; i++) {
+ total += data[i][dim];
+ }
+ return (total /= data.length);
+}
+
+function generateData(type) {
+ const data = [];
+ for (let i = 0; i < 10; i++) {
+ data.push({ x: i, y: Math.random(), type });
+ }
+ return data;
+}
+const DataA = generateData('A');
+
+const DataB = generateData('B');
+
+const barSpec = {
+ type: 'common',
+ series: [
+ {
+ type: 'bar',
+ data: { values: [{ value: calculateAverage(DataA, 'y'), type: 'A' }] },
+ xField: 'type',
+ yField: 'value',
+ morph: {
+ morphKey: 'A'
+ }
+ },
+ {
+ type: 'bar',
+ data: { values: [{ value: calculateAverage(DataB, 'y'), type: 'B' }] },
+ xField: 'type',
+ yField: 'value',
+ morph: {
+ morphKey: 'B'
+ }
+ }
+ ],
+ axes: [
+ { orient: 'left', type: 'linear', max: 1 },
+ { orient: 'bottom', type: 'band' }
+ ]
+};
+
+const scatterSpec = {
+ type: 'common',
+ series: [
+ {
+ type: 'scatter',
+ data: { values: DataA },
+ xField: 'x',
+ yField: 'y',
+ seriesField: 'type',
+ morph: {
+ morphKey: 'A',
+ morphElementKey: 'type'
+ }
+ },
+ {
+ type: 'scatter',
+ data: { values: DataB },
+ xField: 'x',
+ yField: 'y',
+ seriesField: 'type',
+ morph: {
+ morphKey: 'B',
+ morphElementKey: 'type'
+ }
+ }
+ ],
+ axes: [
+ { orient: 'left', type: 'linear', zero: false, max: 1 },
+ { orient: 'bottom', type: 'band' }
+ ]
+};
+
+const specs = [barSpec, scatterSpec];
+
+const vchart = new VChart(specs[0], { dom: CONTAINER_ID });
+
+vchart.renderSync();
+let count = 1;
+setInterval(() => {
+ vchart.updateSpec(specs[count % 2]);
+ count++;
+}, 3000);
+
+
+```
+#### Many-to-One Animation
+
+Many-to-one animation refers to multiple graphic elements transitioning into one element. For example, in the example above, we can have multiple points of a scatter series merge into one large column.
+
+### Interpretation of the Source Code Execution Process for Effect Implementation
+
+The transition between different charts can be explained by updating the configuration, and with morphing animation enabled, the transition effects of series elements are automatically recognized. Below is an explanation of the default effect settings.
+
+
+
+
+
+### Draft Interpretation of Global Animation Implementation
+
+Global animations refer to those animation effects that apply at the entire chart level. They can be applied to the overall entrance animation when the chart loads, the unified change animation when data updates, and the overall exit animation before the chart is destroyed. In VChart, the design and implementation of global animations rely on several core components and mechanisms, including the `Factory` class, `AnimateManager` class, `IAnimationSpec` interface, etc.
+
+
+
+#### 1. Animation Registration and Management
+
+
+
+**Factory Class**
+
+
+
+The `Factory` class is a key player in the animation system, responsible for managing and registering various types of animations. Through the static method `registerAnimation`, we can associate specific animation logic with a name for subsequent use.
+
+
+
+```xml
+class Factory {
+ static registerAnimation(key: string, animation: (params?: any, preset?: any) => MarkAnimationSpec) {
+ Factory._animations[key] = animation;
+ }
+}
+
+```
+
+
+When you need to add animation to a chart element, you can use `Factory.getAnimationInKey` to obtain a registered animation and apply it to the corresponding graphic or graphical element.
+
+
+
+#### 2. Animation Configuration Structure
+
+
+
+**IAnimationSpec Interface**
+
+
+
+The `IAnimationSpec` interface defines the basic structure of animation configuration, covering various states from entry (`animationAppear`) to exit (`animationDisappear`). Each state can accept a boolean value (enable/disable), a preset configuration object, or a custom configuration object as a parameter.
+
+
+
+```xml
+interface IAnimationSpec
+
+
+```javascript
+/**
+ * 自1.12.0后,全局形变动画需要手动注册才能生效
+ *
+ * import { registerMorph } from '@visactor/vchart';
+ *
+ * registerMorph();
+ */
+
+VCHART_MODULE.registerMorph();
+
+function calculateAverage(data, dim) {
+ let total = 0;
+ for (let i = 0; i < data.length; i++) {
+ total += data[i][dim];
+ }
+ return (total /= data.length);
+}
+
+function generateData(type) {
+ const data = [];
+ for (let i = 0; i < 10; i++) {
+ data.push({ x: i, y: Math.random(), type });
+ }
+ return data;
+}
+const DataA = generateData('A');
+
+const DataB = generateData('B');
+
+const barSpec = {
+ type: 'common',
+ series: [
+ {
+ type: 'bar',
+ data: { values: [{ value: calculateAverage(DataA, 'y'), type: 'A' }] },
+ xField: 'type',
+ yField: 'value',
+ morph: {
+ morphKey: 'A'
+ }
+ },
+ {
+ type: 'bar',
+ data: { values: [{ value: calculateAverage(DataB, 'y'), type: 'B' }] },
+ xField: 'type',
+ yField: 'value',
+ morph: {
+ morphKey: 'B'
+ }
+ }
+ ],
+ axes: [
+ { orient: 'left', type: 'linear', max: 1 },
+ { orient: 'bottom', type: 'band' }
+ ]
+};
+
+const scatterSpec = {
+ type: 'common',
+ series: [
+ {
+ type: 'scatter',
+ data: { values: DataA },
+ xField: 'x',
+ yField: 'y',
+ seriesField: 'type',
+ morph: {
+ morphKey: 'A',
+ morphElementKey: 'type'
+ }
+ },
+ {
+ type: 'scatter',
+ data: { values: DataB },
+ xField: 'x',
+ yField: 'y',
+ seriesField: 'type',
+ morph: {
+ morphKey: 'B',
+ morphElementKey: 'type'
+ }
+ }
+ ],
+ axes: [
+ { orient: 'left', type: 'linear', zero: false, max: 1 },
+ { orient: 'bottom', type: 'band' }
+ ]
+};
+
+const specs = [barSpec, scatterSpec];
+
+const vchart = new VChart(specs[0], { dom: CONTAINER_ID });
+
+vchart.renderSync();
+let count = 1;
+setInterval(() => {
+ vchart.updateSpec(specs[count % 2]);
+ count++;
+}, 3000);
+
+
+```
+#### Many-to-One Animation
+
+Many-to-one animation refers to multiple graphic elements transitioning into one element. For example, in the example above, we can have multiple points of a scatter series merge into one large column.
+
+### Interpretation of the Source Code Execution Process for Effect Implementation
+
+The transition between different charts can be explained by updating the configuration, and with morphing animation enabled, the transition effects of series elements are automatically recognized. Below is an explanation of the default effect settings.
+
+
+
+
+
+### Draft Interpretation of Global Animation Implementation
+
+Global animations refer to those animation effects that apply at the entire chart level. They can be applied to the overall entrance animation when the chart loads, the unified change animation when data updates, and the overall exit animation before the chart is destroyed. In VChart, the design and implementation of global animations rely on several core components and mechanisms, including the `Factory` class, `AnimateManager` class, `IAnimationSpec` interface, etc.
+
+
+
+#### 1. Animation Registration and Management
+
+
+
+**Factory Class**
+
+
+
+The `Factory` class is a key player in the animation system, responsible for managing and registering various types of animations. Through the static method `registerAnimation`, we can associate specific animation logic with a name for subsequent use.
+
+
+
+```xml
+class Factory {
+ static registerAnimation(key: string, animation: (params?: any, preset?: any) => MarkAnimationSpec) {
+ Factory._animations[key] = animation;
+ }
+}
+
+```
+
+
+When you need to add animation to a chart element, you can use `Factory.getAnimationInKey` to obtain a registered animation and apply it to the corresponding graphic or graphical element.
+
+
+
+#### 2. Animation Configuration Structure
+
+
+
+**IAnimationSpec Interface**
+
+
+
+The `IAnimationSpec` interface defines the basic structure of animation configuration, covering various states from entry (`animationAppear`) to exit (`animationDisappear`). Each state can accept a boolean value (enable/disable), a preset configuration object, or a custom configuration object as a parameter.
+
+
+
+```xml
+interface IAnimationSpec {
+ animationAppear?: boolean | IStateAnimateSpec | IMarkAnimateSpec;
+ animationEnter?: boolean | ICommonStateAnimateSpec | IMarkAnimateSpec;
+ animationUpdate?: boolean | ICommonStateAnimateSpec | IMarkAnimateSpec;
+ animationExit?: boolean | ICommonStateAnimateSpec | IMarkAnimateSpec;
+ animationDisappear?: boolean | ICommonStateAnimateSpec | IMarkAnimateSpec;
+ animationState?: boolean | IStateAnimationConfig;
+ animationNormal?: IMarkAnimateSpec;
+}
+
+```
+
+
+These configuration options allow developers to flexibly control the behavior of animations in different states, such as setting duration, easing functions, animation types, etc.
+
+
+
+#### 3. Animation State Management
+
+
+
+**AnimateManager Class**
+
+
+
+`AnimateManager` inherits from `StateManager` and implements the `IAnimate` interface, used to manage the state of animations. It provides methods to update animation states and trigger corresponding animation logic based on the current state.
+
+
+
+```xml
+class AnimateManager extends StateManager implements IAnimate {
+ updateAnimateState(state: AnimationStateEnum, noRender?: boolean) {
+ if (state === AnimationStateEnum.update) {
+ // 更新状态下的动画逻辑
+ } else if (state === AnimationStateEnum.appear) {
+ // 出现状态下的动画逻辑
+ } else {
+ // 其他状态下的动画逻辑
+ }
+ }
+}
+
+```
+
+
+In addition, `AnimateManager` is also responsible for generating unique identifiers (IDs) and signal names to ensure that each animation instance can be correctly identified and managed.
+
+
+
+#### 4. Animation Configuration Generation
+
+
+
+**animationConfig Function**
+
+
+
+To simplify the merging process between user configurations and default configurations, VChart provides a helper function called `animationConfig`. This function iterates through all possible animation states and constructs the final animation configuration object based on the user-provided configuration or the default configuration.
+
+
+
+```xml
+function animationConfig(
+ defaultConfig: MarkAnimationSpec = {},
+ userConfig?: Partial | IAnimationConfig | IAnimationConfig[]>>,
+ params?: { dataIndex: (datum: any, params: any) => number; dataCount: () => number; }
+): MarkAnimationSpec {
+ const config = {} as MarkAnimationSpec;
+
+ for (let i = 0; i < AnimationStates.length; i++) {
+ const state = AnimationStates[i];
+ const userStateConfig = userConfig ? userConfig[state] : undefined;
+
+ if (userStateConfig === false) continue;
+
+ if (state === 'normal') {
+ userStateConfig && (config.normal = userStateConfig as IAnimationTypeConfig);
+ continue;
+ }
+
+ let defaultStateConfig: IAnimationConfig[];
+ if (isArray(defaultConfig[state])) {
+ defaultStateConfig = defaultConfig[state] as IAnimationConfig[];
+ } else {
+ defaultStateConfig = [{ ...DEFAULT_ANIMATION_CONFIG[state], ...defaultConfig[state] } as any];
+ }
+
+ config[state] = defaultStateConfig;
+ }
+
+ return config;
+}
+
+```
+
+
+This function handles the merging of default configurations and user configurations, considering that certain states (such as `normal`) can directly use the user-provided configuration without additional processing.
+
+
+
+#### 5. Specific Implementation of Global Animation
+
+
+
+**Registration of Global Animation**
+
+
+
+Taking line charts or area charts as an example, the `registerVGrammarLineOrAreaAnimation` function demonstrates how to batch register a series of animation methods. These animations cover effects such as point growth, point movement, and clipping, and are applicable to both the X-axis and Y-axis directions.
+
+
+
+```xml
+const registerVGrammarLineOrAreaAnimation = () => {
+ View.useRegisters([
+ registerGrowPointsInAnimation,
+ registerGrowPointsOutAnimation,
+ registerGrowPointsXInAnimation,
+ registerGrowPointsXOutAnimation,
+ registerGrowPointsYInAnimation,
+ registerGrowPointsYOutAnimation,
+ registerClipInAnimation,
+ registerClipOutAnimation
+ ]);
+};
+
+```
+
+
+**Initialization of Global Animation**
+
+
+
+In the implementation files of specific series (such as bar charts, pie charts, etc.), the `initAnimation` method is usually called during the initialization phase to set up animation configurations. This method combines user-provided configurations with default configurations to generate the final animation configuration and applies it to the corresponding graphic elements or shapes.
+
+
+
+```xml
+initAnimation(): void {
+ const animationParams = getGroupAnimationParams(this);
+ const appearPreset = (this._spec?.animationAppear as IStateAnimateSpec)?.preset;
+ this._symbolMark.setAnimationConfig(
+ animationConfig(
+ Factory.getAnimationInKey('scatter')?.({}, appearPreset),
+ userAnimationConfig(SeriesMarkNameEnum.point, this._spec, this._markAttributeContext),
+ animationParams
+ )
+ );
+}
+
+```
+
+
+Here, the `animationConfig` function is used to merge default configurations and user configurations, while `userAnimationConfig` is responsible for extracting the animation configuration information provided by the user. Finally, the generated configuration is applied to specific graphic elements through the `setAnimationConfig` method.
+
+
+
+#### 6. Execution of Animation Tasks
+
+
+
+**IAnimationTask Interface**
+
+
+
+For complex animation sequences, VChart introduces the `IAnimationTask` interface to describe the data structure of animation tasks. Each task includes time offsets, action queues, and successor task lists, forming a chain-like animation execution mechanism.
+
+
+
+```xml
+interface IAnimationTask {
+ timeOffset: number;
+ actionList: Action[];
+ nextTaskList: IAnimationTask[];
+}
+
+```
+
+
+This design allows multiple animation tasks to be executed sequentially or concurrently, enabling more complex and delicate animation effects.
+
+
+
+#### 7. Example: Creating a Global Entrance Animation
+
+
+
+Suppose we want to add a global fade-in entrance animation to a newly created bar chart. Here are the detailed implementation steps:
+
+
+
+* **Define Animation Configuration**: First, specify `animationAppear` as `true` in the chart configuration to enable the entrance animation. Additionally, you can further customize the specific behavior of the animation, such as choosing a fade-in effect, setting the duration, and easing function.
+
+
+
+```xml
+const chartSpec = {
+ // ... 其他配置 ...
+ animationAppear: {
+ type: 'fadeIn',
+ duration: 1000,
+ easing: 'easeInOutQuad'
+ },
+ series: [
+ {
+ type: 'bar',
+ data: [/* 数据数组 */]
+ }
+ ]
+};
+
+```
+
+
+* **Register Fade-in Animation**: Next, we need to ensure that the fade-in animation has been correctly registered in the system. This step is usually completed at project startup or explicitly called where needed.
+
+
+
+```xml
+import { Factory } from '@visactor/vchart';
+import { Appear_FadeIn } from './series/bar/animation';
+
+Factory.registerAnimation('fadeIn', Appear_FadeIn);
+
+```
+
+
+* **Initialize the chart instance**: With the above configuration, we can initialize a `VChart` instance and pass the configuration to it. This will trigger the chart rendering process and apply the corresponding animation effects.
+
+
+
+```xml
+import { VChart } from '@visactor/vchart';
+
+const container = document.getElementById('chart-container');
+const chart = new VChart({
+ el: container,
+ spec: chartSpec,
+ options: {
+ animation: true, // 开启动画
+ theme: 'light' // 使用浅色主题
+ }
+});
+
+```
+
+
+* **Trigger Animation**: Once the chart is rendered, any changes in data will automatically trigger animations. For example, when the page first loads, all bars will gradually appear with a fade-in effect; when new data is added, new bars will enter in the same way.
+
+
+
+* **Manual Control of Animation**: If you need more precise control over the animation, such as pausing or resuming it, you can use the relevant methods provided by the `VChart` instance.
+
+
+
+```xml
+// 暂停所有正在进行的动画
+chart.pauseAnimation();
+
+// 恢复之前暂停的动画
+chart.resumeAnimation();
+
+```
+
+
+#### Summary
+
+
+
+Through the above steps, we have detailed the implementation principles of global animation in VChart. The animation system of VChart cleverly combines the factory pattern, state manager pattern, and modular animation configuration, providing not only a rich set of built-in animation effects but also supporting highly customizable needs. Developers can flexibly configure and combine different animations according to actual application scenarios to create visual effects that are both beautiful and practical.
+
+ # This document was revised and organized by the following personnel
+ [玄魂](https://github.com/xuanhun)
\ No newline at end of file
diff --git a/docs/assets/contributing/en/sourcecode/10.3-state-change-animation.md b/docs/assets/contributing/en/sourcecode/10.3-state-change-animation.md
new file mode 100644
index 0000000000..b501ef2702
--- /dev/null
+++ b/docs/assets/contributing/en/sourcecode/10.3-state-change-animation.md
@@ -0,0 +1,472 @@
+---
+title: 10.3 State Change Animation
+
+key words: VisActor,VChart,VTable,VStrory,VMind,VGrammar,VRender,Visualization,Chart,Data,Table,Graph,Gis,LLM
+---
+## 10.3 State Change Animation
+
+Score: 5
+
+1. State Animation:
+
+1. Code Entry: `packages/vchart/src/animation/`
+
+1. Key Points:
+
+1. Implementation of State Animation
+
+1. Other Reference Documents:
+
+https://www.visactor.io/vchart/guide/tutorial_docs/Animation/Animation_Types
+
+https://www.visactor.io/vrender/guide/asd/Basic_Tutorial/Animate
+
+https://visactor.io/vgrammar/guide/guides/animation
+
+[Magic Frame (Part 1): The Principle of Animation Implementation in Front-end Chart Libraries - A vivid visualization work often involves animation. Whether it's various charts or narrative works, organizing the week - Juejin](https://juejin.cn/post/7275270809777520651)
+
+Often when presenting charts, different graphical elements have their own meanings, and in information display, it is necessary to emphasize or compare certain elements. By switching the state of graphical elements to display data, this process also needs to focus on visual effects, providing a more natural visual experience when the state changes.
+
+### Interpretation of State Animation (including `normal` animation) Implementation
+
+state and normal
+
+
+
+**State Change Animation, Animation Triggered at Any Time**
+
+State animation refers to the animation effects triggered when chart elements change according to their current state. In VChart, the design of state animation allows developers to define specific animation behaviors for different states (such as enter, update, exit, etc.). Specifically, `normal` state animation refers to those animations that loop or persist, running continuously after the chart is rendered until explicitly stopped.
+
+
+
+#### 1. Animation Configuration Structure
+
+
+
+**IAnimationSpec Interface**
+
+
+
+The `IAnimationSpec` interface defines the basic structure of animation configuration, which includes animation settings for different states. For `normal` animations, it can be specified through the `animationNormal` property:
+
+
+
+
+```xml
+interface IAnimationSpec {
+ // ... 其他状态 ...
+ animationNormal?: IMarkAnimateSpec;
+}
+
+```
+
+
+Here, `IMarkAnimateSpec` is a generic interface used to describe the animation configuration of specific elements (such as each bar in a bar chart). In this way, developers can define personalized `normal` animation effects for each element.
+
+
+
+#### 2. Animation Manager
+
+
+
+**AnimateManager Class**
+
+
+
+The `AnimateManager` class is responsible for managing and coordinating the state of all animations. It implements the `IAnimate` interface and provides methods to update and retrieve animation states. For `normal` animations, the `AnimateManager` ensures that these animations automatically start after the chart rendering is complete and can be paused or resumed as needed.
+
+
+
+
+```xml
+class AnimateManager extends StateManager implements IAnimate {
+ updateAnimateState(state: AnimationStateEnum, noRender?: boolean) {
+ if (state === AnimationStateEnum.normal) {
+ this.updateState(
+ {
+ animationState: {
+ callback: (datum: any, element: IElement) => state
+ }
+ },
+ noRender
+ );
+ }
+ }
+}
+
+```
+
+
+When chart elements enter the `normal` state, the `updateAnimateState` method is called and the state is passed to the internal state management logic. This allows all eligible elements to perform the corresponding `normal` animation.
+
+
+
+#### 3. Animation Configuration Generation
+
+
+
+**animationConfig Function**
+
+
+
+To simplify the merging process between user configuration and default configuration, VChart provides a helper function called `animationConfig`. This function iterates over all possible animation states and constructs the final animation configuration object based on the user-provided configuration or the default configuration.
+
+
+
+
+```xml
+function animationConfig(
+ defaultConfig: MarkAnimationSpec = {},
+ userConfig?: Partial | IAnimationConfig | IAnimationConfig[]>>,
+ params?: { dataIndex: (datum: any, params: any) => number; dataCount: () => number; }
+): MarkAnimationSpec {
+ const config = {} as MarkAnimationSpec;
+
+ for (let i = 0; i < AnimationStates.length; i++) {
+ const state = AnimationStates[i];
+ const userStateConfig = userConfig ? userConfig[state] : undefined;
+
+ if (userStateConfig === false) continue;
+
+ if (state === 'normal') {
+ userStateConfig && (config.normal = userStateConfig as IAnimationTypeConfig);
+ continue;
+ }
+
+ let defaultStateConfig: IAnimationConfig[];
+ if (isArray(defaultConfig[state])) {
+ defaultStateConfig = defaultConfig[state] as IAnimationConfig[];
+ } else {
+ defaultStateConfig = [{ ...DEFAULT_ANIMATION_CONFIG[state], ...defaultConfig[state] } as any];
+ }
+
+ config[state] = defaultStateConfig;
+ }
+
+ return config;
+}
+
+```
+
+
+This function handles the animation configuration merging in the `normal` state, ensuring that the user-provided configuration can be correctly applied to specific graphic elements. If the user does not provide a custom `normal` animation configuration, the default configuration is used.
+
+
+
+#### 4. Specific Implementation of `normal` Animation
+
+
+
+Taking a scatter plot as an example, suppose we want to add a slight pulse effect to each data point as a `normal` animation. Here are the detailed implementation steps:
+
+
+
+* **Define Animation Configuration**: First, specify the `animationNormal` configuration for the scatter plot series in the chart configuration. Here we can choose the built-in `pulse` animation type and adjust its duration and easing function.
+
+
+
+
+```xml
+const chartSpec = {
+ series: [
+ {
+ type: 'scatter',
+ data: [/* 数据数组 */],
+ animationNormal: {
+ type: 'pulse', // 使用脉冲效果
+ duration: 800,
+ easing: 'easeInOutQuad'
+ }
+ }
+ ]
+};
+
+```
+
+
+* **Register Animation**: Next, we need to ensure that the `pulse` animation has been correctly registered in the system. This step is usually completed at project startup or explicitly called where needed.
+
+
+
+
+```xml
+import { Factory } from '@visactor/vchart';
+import { pulseAnimation } from './series/scatter/animation';
+
+Factory.registerAnimation('pulse', pulseAnimation);
+
+```
+
+
+ The `pulseAnimation` function here defines the specific logic of the pulse animation, such as how to change the transparency or size of graphic elements.
+
+
+
+* **Initialize the chart instance**: With the above configuration, we can initialize a `VChart` instance and pass the configuration to it. This will trigger the rendering process of the chart and apply the corresponding animation effects.
+
+
+
+
+```xml
+import { VChart } from '@visactor/vchart';
+
+const container = document.getElementById('chart-container');
+const chart = new VChart({
+ el: container,
+ spec: chartSpec,
+ options: {
+ animation: true, // 开启动画
+ theme: 'light' // 使用浅色主题
+ }
+});
+
+```
+
+
+* **Trigger Animation**: Once the chart is rendered, all data points will automatically start executing the `normal` animation. This animation will continuously loop while the chart exists, unless explicitly stopped.
+
+
+
+
+```xml
+// 如果需要暂停所有正在进行的 normal 动画
+chart.pauseAnimation();
+
+// 恢复之前暂停的 normal 动画
+chart.resumeAnimation();
+
+```
+
+
+#### 5. Execution of Animation Tasks
+
+
+
+**IAnimationTask Interface**
+
+
+
+For complex animation sequences, VChart introduces the `IAnimationTask` interface to describe the data structure of animation tasks. Each task includes a time offset, an action queue, and a list of successor tasks, forming a chain-like animation execution mechanism.
+
+
+
+
+```xml
+interface IAnimationTask {
+ timeOffset: number;
+ actionList: Action[];
+ nextTaskList: IAnimationTask[];
+}
+
+```
+
+
+This design allows multiple animation tasks to be executed sequentially or concurrently, achieving more complex and delicate animation effects. For `normal` animations, it can work as part of an independent task chain, collaborating with other animation tasks.
+
+
+
+#### 6. Example: Creating a Scatter Plot with `normal` Animation
+
+
+
+Below is an example of creating a scatter plot with `normal` animation, illustrating how to use VChart's state animation system to implement the basic process.
+
+
+
+##### Step 1: Define Animation Configuration
+
+
+
+First, we need to define the basic configuration of the scatter plot, including the data source and other visual attributes. At the same time, we will specify the `normal` animation configuration here to ensure that each data point can perform the pulse effect.
+
+
+
+
+```xml
+const chartSpec = {
+ series: [
+ {
+ type: 'scatter',
+ data: [
+ { x: 10, y: 20 },
+ { x: 20, y: 30 },
+ { x: 30, y: 40 }
+ ],
+ animationNormal: {
+ type: 'pulse',
+ duration: 800,
+ easing: 'easeInOutQuad'
+ }
+ }
+ ]
+};
+
+```
+
+
+##### Step 2: Register Animation
+
+
+
+Ensure that the required `pulse` animation has been correctly registered in the system. This step is usually completed at project startup or explicitly called where needed.
+
+
+
+
+```xml
+import { Factory } from '@visactor/vchart';
+import { pulseAnimation } from './series/scatter/animation';
+
+Factory.registerAnimation('pulse', pulseAnimation);
+
+```
+
+
+##### Step 3: Initialize the Chart Instance
+
+
+
+With the above configuration, we can initialize a `VChart` instance and pass the configuration to it. This step will trigger the chart rendering process and apply the corresponding animation effects.
+
+
+
+
+```xml
+import { VChart } from '@visactor/vchart';
+
+const container = document.getElementById('chart-container');
+const chart = new VChart({
+ el: container,
+ spec: chartSpec,
+ options: {
+ animation: true, // 开启动画
+ theme: 'light' // 使用浅色主题
+ }
+});
+
+```
+
+
+##### Step 4: Trigger `normal` Animation
+
+
+
+Once the chart is rendered, all data points will automatically start executing the `normal` animation. This animation will continue to loop as long as the chart exists, unless explicitly stopped.
+
+
+
+
+```xml
+// 如果需要暂停所有正在进行的 normal 动画
+chart.pauseAnimation();
+
+// 恢复之前暂停的 normal 动画
+chart.resumeAnimation();
+
+```
+
+
+##### Step 5: Dynamically Control Animation
+
+
+
+In some cases, you may want to dynamically control the behavior of the `normal` animation, such as changing the speed or style of the animation. VChart provides flexible methods to achieve this.
+
+
+
+
+```xml
+// 更新某个系列的 normal 动画配置
+chart.updateSeriesOptions(0, {
+ animationNormal: {
+ duration: 1200, // 更改持续时间
+ easing: 'linear' // 更改缓动函数
+ }
+});
+
+// 重新应用新的动画配置
+chart.render();
+
+```
+
+
+#### 7. Animation State Management
+
+
+
+**State Transition and Update**
+
+
+
+`AnimateManager` not only manages `normal` animations but also handles animation transitions in other states. For example, when new data is added, the animation in the `enter` state is triggered; when data is updated, the animation in the `update` state takes effect; and when data is removed, the animation in the `exit` state comes into play.
+
+
+
+
+```xml
+class AnimateManager extends StateManager implements IAnimate {
+ updateAnimateState(state: AnimationStateEnum, noRender?: boolean) {
+ if (state === AnimationStateEnum.update) {
+ // 更新状态下的动画逻辑
+ } else if (state === AnimationStateEnum.appear) {
+ // 出现状态下的动画逻辑
+ } else if (state === AnimationStateEnum.normal) {
+ // normal 状态下的动画逻辑
+ this.updateState(
+ {
+ animationState: {
+ callback: (datum: any, element: IElement) => state
+ }
+ },
+ noRender
+ );
+ }
+ }
+}
+
+```
+
+
+In this example, when the element enters the `normal` state, the `updateAnimateState` method will update the element's state and trigger the corresponding animation logic. This means that each data point will execute the animation according to the preset `normal` animation configuration until the state changes again.
+
+
+
+#### 8. Animation Lifecycle Management
+
+
+
+**Event Listeners and Hooks**
+
+
+
+To better manage the animation lifecycle, VChart provides a series of event listeners and hook functions. For example, the `VGRAMMAR_HOOK_EVENT.AFTER_DO_RENDER` event can be triggered after the chart is initially rendered, while the `VGRAMMAR_HOOK_EVENT.ANIMATION_END` will be triggered at the end of the animation.
+
+
+
+
+```xml
+this._event.on(VGRAMMAR_HOOK_EVENT.AFTER_DO_RENDER, () => {
+ this.runAnimationByState(AnimationStateEnum.normal);
+});
+
+this._event.on(VGRAMMAR_HOOK_EVENT.ANIMATION_END, ({ event }) => {
+ if (event.animationState === AnimationStateEnum.appear) {
+ this.runAnimationByState(AnimationStateEnum.normal);
+ }
+});
+
+```
+
+
+This code demonstrates how to start the `normal` animation immediately after the chart rendering is completed, and how to seamlessly switch to the `normal` animation after the entrance animation ends. This design ensures a smooth transition between animations, enhancing the user experience.
+
+
+
+### Summary
+
+
+
+Through the above steps, we have detailed the implementation principle of the `normal` state animation in VChart. The `normal` animation, as a type of state animation, is mainly used to describe the animation effect of chart elements continuously existing in a stable state. VChart ensures the flexibility and maintainability of the `normal` animation through modular design, factory pattern, state manager pattern, and event-driven mechanism. Developers can easily customize different types of `normal` animation effects according to actual needs, thereby enhancing the visual appeal and interactive experience of the chart.
+
+ # This document was revised and organized by the following personnel
+ [玄魂](https://github.com/xuanhun)
\ No newline at end of file
diff --git a/docs/assets/contributing/en/sourcecode/10.4-data-update-animation.md b/docs/assets/contributing/en/sourcecode/10.4-data-update-animation.md
new file mode 100644
index 0000000000..c58bc0d7a2
--- /dev/null
+++ b/docs/assets/contributing/en/sourcecode/10.4-data-update-animation.md
@@ -0,0 +1,608 @@
+---
+title: 10.4 Data Update Animation
+
+key words: VisActor,VChart,VTable,VStrory,VMind,VGrammar,VRender,Visualization,Chart,Data,Table,Graph,Gis,LLM
+---
+## 10.4 Data Update Animation
+
+Score: 8
+
+1. Update Animation:
+
+1. Code Entry: `packages/vchart/src/animation/`
+
+1. Key Points:
+
+1. Implementation of Update Animation
+
+1. Other Reference Documents:
+
+https://www.visactor.io/vchart/guide/tutorial_docs/Animation/Animation_Types
+
+https://www.visactor.io/vrender/guide/asd/Basic_Tutorial/Animate
+
+https://visactor.io/vgrammar/guide/guides/animation
+
+[Magic Frame (Part 1): The Principle of Animation Implementation in Front-end Chart Libraries - A vivid visualization work often involves animation. Whether it's various charts or narrative works, organizing the week - Juejin](https://juejin.cn/post/7275270809777520651)
+
+After understanding how to add change animation effects when specific chart element data changes, we can configure data update animations for series elements in a specific type of chart to meet animation effects in specific scenarios.
+
+### Interpretation of Data Update Animation Implementation
+
+
+
+Data update animation refers to the animation effect executed by chart elements based on the new data state when the chart data changes. In VChart, this animation is designed to be very flexible and can be applied to three scenarios: new data entry (`enter`), existing data update (`update`), and old data removal (`exit`). Below is a detailed interpretation of the implementation.
+
+
+
+#### 1. Animation Configuration Structure
+
+
+
+**IAnimationSpec Interface**
+
+
+
+The `IAnimationSpec` interface defines the basic structure of animation configuration, which includes animation settings for different states. For data update animations, it mainly involves the following three properties:
+
+
+
+* `animationEnter`: Describes the animation effect when new data is added.
+
+* `animationUpdate`: Describes the animation effect when existing data is updated.
+
+* `animationExit`: Describes the animation effect when old data is removed.
+
+
+
+
+```xml
+interface IAnimationSpec {
+ animationEnter?: boolean | ICommonStateAnimateSpec | IMarkAnimateSpec;
+ animationUpdate?: boolean | ICommonStateAnimateSpec | IMarkAnimateSpec;
+ animationExit?: boolean | ICommonStateAnimateSpec | IMarkAnimateSpec;
+}
+
+```
+
+
+Each attribute can accept a boolean value (enable/disable), a preset configuration object, or a custom configuration object as a parameter, providing developers with a high degree of customization possibilities.
+
+
+
+#### 2. Animation Manager
+
+
+
+**AnimateManager Class**
+
+
+
+The `AnimateManager` class is responsible for managing and coordinating the state of all animations. It implements the `IAnimate` interface and provides methods to update and retrieve animation states. For data update animations, the `AnimateManager` ensures that these animations are automatically triggered when data changes and can be paused or resumed as needed.
+
+
+
+
+```xml
+class AnimateManager extends StateManager implements IAnimate {
+ updateAnimateState(state: AnimationStateEnum, noRender?: boolean) {
+ if (state === AnimationStateEnum.update) {
+ this.updateState(
+ {
+ animationState: {
+ callback: (datum: any, element: IElement) => element.diffState
+ }
+ },
+ noRender
+ );
+ } else if (state === AnimationStateEnum.appear) {
+ // 出现状态下的动画逻辑
+ } else if (state === AnimationStateEnum.exit) {
+ // 退出状态下的动画逻辑
+ }
+ }
+}
+
+```
+
+
+When chart elements enter the `update`, `appear`, or `exit` states, the `updateAnimateState` method is called and passes the state to the internal state management logic. This allows all eligible elements to perform the corresponding animations.
+
+
+
+#### 3. Animation Configuration Generation
+
+
+
+**animationConfig Function**
+
+
+
+To simplify the merging process between user configurations and default configurations, VChart provides a helper function called `animationConfig`. This function iterates over all possible animation states and constructs the final animation configuration object based on the user-provided configuration or the default configuration.
+
+
+
+
+```xml
+function animationConfig(
+ defaultConfig: MarkAnimationSpec = {},
+ userConfig?: Partial | IAnimationConfig | IAnimationConfig[]>>,
+ params?: { dataIndex: (datum: any, params: any) => number; dataCount: () => number; }
+): MarkAnimationSpec {
+ const config = {} as MarkAnimationSpec;
+
+ for (let i = 0; i < AnimationStates.length; i++) {
+ const state = AnimationStates[i];
+ const userStateConfig = userConfig ? userConfig[state] : undefined;
+
+ if (userStateConfig === false) continue;
+
+ if (state === 'enter' || state === 'update' || state === 'exit') {
+ let defaultStateConfig: IAnimationConfig[];
+ if (isArray(defaultConfig[state])) {
+ defaultStateConfig = defaultConfig[state] as IAnimationConfig[];
+ } else {
+ defaultStateConfig = [{ ...DEFAULT_ANIMATION_CONFIG[state], ...defaultConfig[state] } as any];
+ }
+
+ config[state] = defaultStateConfig;
+ }
+ }
+
+ return config;
+}
+
+```
+
+
+This function handles the merging of animation configurations in `enter`, `update`, and `exit` states, ensuring that the configurations provided by the user are correctly applied to specific graphical elements. If the user does not provide custom animation configurations, the default configurations are used.
+
+
+
+#### 4. Specific Implementation of Data Update Animation
+
+
+
+Taking a bar chart as an example, suppose we want to add a fade-in effect for newly added data points, a scaling effect for updated data points, and a fade-out effect for removed data points. Here are the detailed implementation steps:
+
+
+
+* **Define Animation Configuration**: First, specify the `animationEnter`, `animationUpdate`, and `animationExit` configurations for the bar chart series in the chart configuration. Here, we can choose built-in animation types and adjust their duration and easing functions.
+
+
+
+```xml
+const chartSpec = {
+ series: [
+ {
+ type: 'bar',
+ data: [/* 初始数据数组 */],
+ animationEnter: {
+ type: 'fadeIn', // 新数据点淡入
+ duration: 800,
+ easing: 'easeInOutQuad'
+ },
+ animationUpdate: {
+ type: 'scaleIn', // 更新数据点缩放
+ duration: 500,
+ easing: 'easeInOutQuad'
+ },
+ animationExit: {
+ type: 'fadeOut', // 移除数据点淡出
+ duration: 600,
+ easing: 'easeInOutQuad'
+ }
+ }
+ ]
+};
+
+```
+
+
+* **Register Animation**: Next, we need to ensure that the required animations have been correctly registered in the system. This step is usually completed at project startup or explicitly called where needed.
+
+
+
+
+```xml
+import { Factory } from '@visactor/vchart';
+import { Appear_FadeIn, ScaleInOutAnimation, Appear_FadeOut } from './series/bar/animation';
+
+// 注册淡入动画
+Factory.registerAnimation('fadeIn', Appear_FadeIn);
+
+// 注册缩放动画
+Factory.registerAnimation('scaleIn', ScaleInOutAnimation);
+
+// 注册淡出动画
+Factory.registerAnimation('fadeOut', Appear_FadeOut);
+
+```
+
+
+ The `Appear_FadeIn`, `ScaleInOutAnimation`, and `Appear_FadeOut` functions here define the specific logic for fade-in, scale, and fade-out animations, such as how to change the transparency or size of graphic elements.
+
+
+
+* **Initialize the chart instance**: With the above configuration, we can initialize a `VChart` instance and pass the configuration to it. This will trigger the rendering process of the chart and apply the corresponding animation effects.
+
+
+
+
+```xml
+import { VChart } from '@visactor/vchart';
+
+const container = document.getElementById('chart-container');
+const chart = new VChart({
+ el: container,
+ spec: chartSpec,
+ options: {
+ animation: true, // 开启动画
+ theme: 'light' // 使用浅色主题
+ }
+});
+
+```
+
+
+* **Trigger Animation**: Once the chart is rendered, any change in data will automatically trigger animation. For example, when new data is added, the `animationEnter` configuration takes effect; when data is updated, the `animationUpdate` configuration is effective; and when data is removed, the `animationExit` configuration is applied.
+
+
+
+
+```xml
+// 假设一段时间后需要更新数据
+setTimeout(() => {
+ const newData = [/* 新的数据数组 */];
+ chart.updateSeriesData(newData);
+}, 5000);
+
+```
+
+
+#### 5. Execution of Animation Tasks
+
+
+
+**IAnimationTask Interface**
+
+
+
+For complex animation sequences, VChart introduces the `IAnimationTask` interface to describe the data structure of animation tasks. Each task includes a time offset, an action queue, and a list of successor tasks, forming a chain-like animation execution mechanism.
+
+
+
+
+```xml
+interface IAnimationTask {
+ timeOffset: number;
+ actionList: Action[];
+ nextTaskList: IAnimationTask[];
+}
+
+```
+
+
+This design allows multiple animation tasks to be executed sequentially or concurrently, enabling more complex and delicate animation effects. For data update animations, it can be part of an independent task chain, working in conjunction with other animation tasks.
+
+
+
+#### 6. Example: Creating a Bar Chart with Data Update Animation
+
+
+
+Below is an example of creating a bar chart with data update animation, illustrating how to use VChart's data update animation system to implement the basic process.
+
+
+
+##### Step 1: Define Animation Configuration
+
+
+
+First, we need to define the basic configuration of the bar chart, including the data source and other visual attributes. At the same time, we will also specify the `animationEnter`, `animationUpdate`, and `animationExit` configurations here to ensure that the corresponding animation effects can be triggered when the data changes.
+
+
+
+
+```xml
+const chartSpec = {
+ series: [
+ {
+ type: 'bar',
+ data: [
+ { value: 10 },
+ { value: 20 },
+ { value: 30 }
+ ],
+ animationEnter: {
+ type: 'fadeIn',
+ duration: 800,
+ easing: 'easeInOutQuad'
+ },
+ animationUpdate: {
+ type: 'scaleIn',
+ duration: 500,
+ easing: 'easeInOutQuad'
+ },
+ animationExit: {
+ type: 'fadeOut',
+ duration: 600,
+ easing: 'easeInOutQuad'
+ }
+ }
+ ]
+};
+
+```
+
+
+##### Step 2: Register Animation
+
+
+
+Ensure that the required animations have been correctly registered in the system. This step is usually completed at project startup or explicitly called where needed.
+
+
+
+
+```xml
+import { Factory } from '@visactor/vchart';
+import { Appear_FadeIn, ScaleInOutAnimation, Appear_FadeOut } from './series/bar/animation';
+
+Factory.registerAnimation('fadeIn', Appear_FadeIn);
+Factory.registerAnimation('scaleIn', ScaleInOutAnimation);
+Factory.registerAnimation('fadeOut', Appear_FadeOut);
+
+```
+
+
+##### Step 3: Initialize the Chart Instance
+
+
+
+With the above configuration, we can initialize a `VChart` instance and pass the configuration to it. This step will trigger the chart rendering process and apply the corresponding animation effects.
+
+
+
+
+```xml
+import { VChart } from '@visactor/vchart';
+
+const container = document.getElementById('chart-container');
+const chart = new VChart({
+ el: container,
+ spec: chartSpec,
+ options: {
+ animation: true, // 开启动画
+ theme: 'light' // 使用浅色主题
+ }
+});
+
+```
+
+
+##### Step 4: Trigger Data Update Animation
+
+
+
+Once the chart is rendered, any changes in the data will automatically trigger animations. For example, when new data is added, the `animationEnter` configuration will take effect; when data is updated, the `animationUpdate` configuration is effective; and when data is removed, the `animationExit` configuration is applied.
+
+
+
+
+```xml
+// 模拟数据更新
+setTimeout(() => {
+ const updatedData = [
+ { value: 15 }, // 更新第一个数据点
+ { value: 25 }, // 更新第二个数据点
+ { value: 35 }, // 更新第三个数据点
+ { value: 45 } // 添加一个新的数据点
+ ];
+
+ // 更新图表数据并触发动画
+ chart.updateSeriesData(updatedData);
+}, 5000);
+
+```
+
+
+In this example, the `updateSeriesData` method triggers a series of animations:
+
+* For newly added data points (the fourth data point), the `animationEnter` configuration makes it gradually appear with a fade-in effect.
+
+* For existing data points (the first three data points), the `animationUpdate` configuration adjusts their size based on the new data values and transitions them with a scaling effect.
+
+* If any data points are removed, the `animationExit` configuration makes them disappear with a fade-out effect.
+
+
+
+##### Step 5: Dynamically Control Animations
+
+
+
+In some cases, you may want to dynamically control the behavior of data update animations, such as changing the speed or style of the animation. VChart provides flexible methods to achieve this.
+
+
+
+
+```xml
+// 更新某个系列的数据更新动画配置
+chart.updateSeriesOptions(0, {
+ animationEnter: {
+ duration: 1000, // 更改淡入动画的持续时间
+ easing: 'linear' // 更改缓动函数
+ },
+ animationUpdate: {
+ duration: 700, // 更改缩放动画的持续时间
+ easing: 'easeInOutCubic' // 更改缓动函数
+ },
+ animationExit: {
+ duration: 900, // 更改淡出动画的持续时间
+ easing: 'easeInOutCubic' // 更改缓动函数
+ }
+});
+
+// 重新应用新的动画配置
+chart.render();
+
+```
+
+
+#### 7. Animation Lifecycle Management
+
+
+
+**Event Listeners and Hooks**
+
+
+
+To better manage the lifecycle of animations, VChart provides a series of event listeners and hook functions. For example, the `VGRAMMAR_HOOK_EVENT.AFTER_DO_RENDER` event can be triggered after the chart is initially rendered, while `VGRAMMAR_HOOK_EVENT.ANIMATION_END` will be triggered at the end of the animation.
+
+
+
+
+```xml
+this._event.on(VGRAMMAR_HOOK_EVENT.AFTER_DO_RENDER, () => {
+ // 图表首次渲染完成后的逻辑
+});
+
+this._event.on(VGRAMMAR_HOOK_EVENT.ANIMATION_END, ({ event }) => {
+ if (event.animationState === AnimationStateEnum.enter) {
+ // enter 动画结束后的逻辑
+ } else if (event.animationState === AnimationStateEnum.update) {
+ // update 动画结束后的逻辑
+ } else if (event.animationState === AnimationStateEnum.exit) {
+ // exit 动画结束后的逻辑
+ }
+});
+
+```
+
+
+This code demonstrates how to execute specific logic at different animation stages to ensure smooth transitions between animations and enhance user experience.
+
+
+
+#### 8. Difference Detection and Animation Trigger
+
+
+
+**Difference Detection**
+
+
+
+During the data update process, VChart automatically performs difference detection to identify which data points are new, updated, or removed. Based on this information, `AnimateManager` triggers the corresponding animations.
+
+
+
+
+```xml
+if (state === AnimationStateEnum.update) {
+ this.updateState(
+ {
+ animationState: {
+ callback: (datum: any, element: IElement) => element.diffState
+ }
+ },
+ noRender
+ );
+}
+
+```
+
+
+The `diffState` attribute here indicates the type of state change for the element, such as `enter`, `update`, or `exit`. The `AnimateManager` will decide which type of animation to apply based on this attribute.
+
+
+
+#### 9. Specific Implementation of Animation
+
+
+
+**Specific Animation Functions**
+
+
+
+Each specific animation function (such as `Appear_FadeIn`, `ScaleInOutAnimation`, and `Appear_FadeOut`) defines the specific behavior of the animation. For example, the `Appear_FadeIn` function might look like this:
+
+
+
+
+```xml
+export const Appear_FadeIn: IAnimationTypeConfig = {
+ type: 'fadeIn',
+ duration: 800,
+ easing: 'easeInOutQuad',
+ channel: {
+ opacity: { from: 0, to: 1 }
+ }
+};
+
+```
+
+
+This code defines a fade-in animation by adjusting the `opacity` attribute of a graphic element from 0 to 1 to achieve a visual fade-in effect.
+
+
+
+#### 10. Animation State Management
+
+
+
+**State Transition and Update**
+
+
+
+`AnimateManager` not only manages `normal` animations but also handles animation transitions in other states. For example, when new data is added, the animation in the `enter` state is triggered; when data is updated, the animation in the `update` state takes effect; and when data is removed, the animation in the `exit` state comes into play.
+
+
+
+
+```xml
+class AnimateManager extends StateManager implements IAnimate {
+ updateAnimateState(state: AnimationStateEnum, noRender?: boolean) {
+ if (state === AnimationStateEnum.update) {
+ this.updateState(
+ {
+ animationState: {
+ callback: (datum: any, element: IElement) => element.diffState
+ }
+ },
+ noRender
+ );
+ } else if (state === AnimationStateEnum.appear) {
+ // appear 状态下的动画逻辑
+ } else if (state === AnimationStateEnum.exit) {
+ // exit 状态下的动画逻辑
+ }
+ }
+}
+
+```
+
+
+When chart elements enter the `update`, `appear`, or `exit` states, the `updateAnimateState` method is called and passes the state to the internal state management logic. This allows all eligible elements to perform the corresponding animations.
+
+
+
+### Summary
+
+
+
+Through the above steps, we have detailed the implementation principles of data update animations in VChart. The data update animation system of VChart cleverly combines the factory pattern, state manager pattern, and modular animation configuration, providing not only a rich set of built-in animation effects but also supporting highly customizable needs. Developers can flexibly configure and combine different animations according to actual application scenarios to create visual effects that are both beautiful and practical. Specifically:
+
+
+
+* `**animationEnter**`: Suitable for entry animations of new data points, such as fade-in, growth, etc.
+
+* `**animationUpdate**`: Suitable for update animations of existing data points, such as scaling, color gradient, etc.
+
+* `**animationExit**`: Suitable for exit animations of old data points, such as fade-out, shrink, etc.
+
+
+
+This design ensures that when data changes, the chart can be presented to users in a smooth and intuitive manner, enhancing the interactive experience and visual appeal.
+
+ # This document was revised and organized by the following personnel
+ [Xuanhun](https://github.com/xuanhun)
\ No newline at end of file
diff --git a/docs/assets/contributing/en/sourcecode/10.5-animation-orchestration.md b/docs/assets/contributing/en/sourcecode/10.5-animation-orchestration.md
new file mode 100644
index 0000000000..05da0b67b5
--- /dev/null
+++ b/docs/assets/contributing/en/sourcecode/10.5-animation-orchestration.md
@@ -0,0 +1,2413 @@
+---
+title: 10.5 Animation Arrangement
+
+key words: VisActor,VChart,VTable,VStrory,VMind,VGrammar,VRender,Visualization,Chart,Data,Table,Graph,Gis,LLM
+---
+## 10.5 Animation Arrangement
+
+Score: 4
+
+1. Global Animation:
+
+1. Code Entry: `packages/vchart/src/animation/`
+
+1. Key Points Interpretation:
+
+1. Implementation of Animation Arrangement
+
+1. Other Reference Documents:
+
+https://www.visactor.io/vchart/guide/tutorial_docs/Animation/Animation_Types
+
+https://www.visactor.io/vrender/guide/asd/Basic_Tutorial/Animate
+
+https://visactor.io/vgrammar/guide/guides/animation
+
+[Magic Frame (Part 1): The Principle of Front-end Chart Library Animation Implementation A vivid visualization work often involves animation. Whether it's various charts or narrative works, organizing the week - Juejin](https://juejin.cn/post/7275270809777520651)
+
+The animation arrangement in VChart's source code mainly revolves around generating and configuring animations to achieve animation effects in different states. Below, we interpret its implementation from several key functions and type definitions:
+
+1. Type Definitions and Constants
+
+utils.ts
+
+Apply
+
+* // Import various types and constants
+import type { IAnimationConfig } from '@visactor/vgrammar-core';
+// ... other imports ...
+/**
+Define an array of animation states, including all keys in the default animation configuration and 'normal'
+ */
+export const AnimationStates = [...Object.keys(DEFAULT_ANIMATION_CONFIG), 'normal'];
+
+* Type Imports: Various types are imported from different modules, such as `IAnimationConfig`, `IElement`, etc., which are used to define animation configurations, elements, etc., ensuring type safety in the code.
+
+* `AnimationStates` Constant: Contains all possible animation states, including states in the default animation configuration and the 'normal' state, used for subsequent traversal and processing of animation configurations in different states.
+
+1. Generate Animation Configuration
+
+utils.ts
+
+
+```xml
+export function animationConfig(
+ defaultConfig: MarkAnimationSpec = {},
+ userConfig?: Partial<
+ Record | IAnimationConfig | IAnimationConfig[]>
+ >,
+ params?: {
+ dataIndex: (datum: any, params: any) => number;
+ dataCount: () => number;
+ }
+) {
+ // ... 函数实现 ...
+}
+
+```
+* Parameters:
+
+* `defaultConfig`: Default animation configuration.
+
+* `userConfig`: User-defined animation configuration, possibly for partial states.
+
+* `params`: Parameters containing data index and data count functions.
+
+* Implementation logic:
+
+1. Create an empty object `config` to store the final animation configuration.
+
+1. Iterate over the `AnimationStates` array to process the configuration of each animation state.
+
+1. Merge or override the animation configuration of the corresponding state based on user configuration and default configuration.
+
+1. For the `exit` state, set the control option `stopWhenStateChange: true`.
+
+1. Handle the `oneByOne` option in the user configuration to generate an animation configuration that executes one by one.
+
+1. Return the final animation configuration.
+
+1. Generate user animation configuration
+
+utils.ts
+
+```xml
+export function userAnimationConfig(
+ markName: SeriesMarkNameEnum | string,
+ spec: IAnimationSpec,
+ ctx: IModelMarkAttributeContext
+) {
+ // ... 函数实现 ...
+}
+
+```
+* Parameters:
+
+* `markName`: Mark name.
+
+* `spec`: Animation specification.
+
+* `ctx`: Model mark attribute context.
+
+* Implementation logic:
+
+1. Create an empty object `userConfig` to store user animation configurations.
+
+1. Assign the corresponding configuration to `userConfig` based on different animation configurations in `spec` (such as `animationAppear`, `animationDisappear`, etc.).
+
+1. Call the `uniformAnimationConfig` function to unify animation configurations.
+
+1. Return the generated user animation configuration.
+
+1. Execute animation configurations one by one
+
+utils.ts
+
+```xml
+function produceOneByOne(
+ stateConfig: IAnimationTypeConfig,
+ dataIndex: (datum: any, params: any) => number,
+ dataCount?: () => number
+) {
+ // ... 函数实现 ...
+}
+
+```
+* Parameters:
+
+* `stateConfig`: Configuration object for the animation type.
+
+* `dataIndex`: Function that returns the index of the data item in the animation sequence.
+
+* `dataCount`: Optional function that returns the total number of data items.
+
+* Implementation logic:
+
+1. Destructure `oneByOne`, `duration`, `delay`, and `delayAfter` configurations from `stateConfig`.
+
+1. Configure the delay time `delay` before the element appears, calculate the delay time based on the data item index and animation parameters.
+
+1. Configure the delay time `delayAfter` after the element appears, also calculate the delay time based on the data item index and animation parameters.
+
+1. Remove the no longer needed `oneByOne` parameter.
+
+1. Return the updated animation configuration object.
+
+1. Other auxiliary functions
+
+* `defaultDataIndex`: Get the default data index based on the data item or animation parameters.
+
+* `shouldMarkDoMorph`: Determine whether the specified mark should perform morphing animation.
+
+* `isTimeLineAnimation` and `isChannelAnimation`: Determine whether the animation configuration is a timeline animation or a channel animation.
+
+* `uniformAnimationConfig`: Unify the animation configuration, process and convert functions in the configuration.
+
+* `traverseSpec`: Traverse and transform the given object or array, applying the provided transformation function.
+
+* `isAnimationEnabledForSeries`: Determine whether the series has animation enabled, check based on series specifications, area animation properties, and data volume.
+
+### Summary
+
+The animation orchestration implementation of VChart mainly merges and processes default configurations and user configurations through a series of functions and type definitions to generate the final animation configuration. At the same time, it provides functions such as executing animations one by one, morphing animations, and logic to determine whether animations are enabled, ensuring flexibility and configurability of animations in different scenarios.
+
+
+
+### Interpretation of Animation Orchestration Implementation
+
+
+
+Animation orchestration refers to combining multiple animation tasks in a certain order or condition to form a coherent and complex animation sequence. In VChart, the design of animation orchestration allows developers to create multi-stage, multi-element collaborative animation effects, thereby enhancing the visual expressiveness and user experience of the chart. The following is a detailed interpretation of the implementation.
+
+
+
+#### 1. Concept of Animation Orchestration
+
+
+
+**Animation Orchestration** is to enhance the effect of data visualization through carefully designed animation sequences. It is not just simple animation stacking, but also considers the coordination between animations, timeline management, and state transitions. VChart provides flexible tools to achieve animation orchestration, including but not limited to:
+
+
+
+* **Chained Animation**: Multiple animations are executed sequentially.
+
+* **Parallel Animation**: Multiple animations are executed simultaneously.
+
+* **Conditional Trigger**: Certain animations are triggered based on specific conditions.
+
+* **Event Driven**: Animations are triggered based on user interactions or other events.
+
+
+
+#### 2. Animation Configuration Structure
+
+
+
+**IAnimationSpec Interface**
+
+
+
+The `IAnimationSpec` interface defines the basic structure of animation configuration, which includes animation settings for different states. For animation orchestration, it mainly involves the following properties:
+
+
+
+* `animationState`: Used to describe state transition animations, can be used to build complex animation sequences.
+
+* `animationNormal`: Used to describe persistent loop animations, can be used as background animations in animation orchestration.
+
+
+
+
+```xml
+interface IAnimationSpec {
+ animationState?: boolean | IStateAnimationConfig;
+ animationNormal?: IMarkAnimateSpec;
+}
+
+```
+
+
+Each attribute can accept a boolean value (enable/disable), a preset configuration object, or a custom configuration object as a parameter, providing developers with a high degree of customization possibilities.
+
+
+
+#### 3. Animation Task Interface
+
+
+
+**IAnimationTask Interface**
+
+
+
+To support complex animation orchestration, VChart introduces the `IAnimationTask` interface to describe the data structure of animation tasks. Each task includes a time offset, an action queue, and a list of successor tasks, forming a chain-like animation execution mechanism.
+
+
+
+
+```xml
+interface IAnimationTask {
+ timeOffset: number; // 时间偏移量,表示该任务相对于前一个任务的延迟时间
+ actionList: Action[]; // 动作队列,包含一系列动画操作
+ nextTaskList: IAnimationTask[]; // 后继任务列表,表示后续要执行的任务
+}
+
+```
+
+
+This design allows multiple animation tasks to be executed sequentially or concurrently, achieving more complex and delicate animation effects.
+
+
+
+#### 4. Specific Implementation of Animation Orchestration
+
+
+
+Taking the creation of a bar chart with animation orchestration as an example, suppose we want to achieve the following effects:
+
+* When the page loads, all bars grow from the bottom up;
+
+* After the bars finish growing, a pulse effect is added to the top to attract the user's attention;
+
+* If new data is added, new bars fade in, and existing bars slightly scale to indicate changes.
+
+
+
+##### Step 1: Define Animation Configuration
+
+
+
+First, specify `animationAppear`, `animationEnter`, `animationUpdate`, etc., in the chart configuration for the bar chart series. Here we can choose built-in animation types and adjust their duration and easing functions.
+
+
+
+
+```xml
+const chartSpec = {
+ series: [
+ {
+ type: 'bar',
+ data: [/* 初始数据数组 */],
+ animationAppear: {
+ type: 'growCenterIn', // 柱子从中心向外生长
+ duration: 1000,
+ easing: 'easeInOutQuad'
+ },
+ animationNormal: {
+ type: 'pulse', // 生长完成后顶部添加脉冲效果
+ duration: 800,
+ easing: 'easeInOutQuad'
+ },
+ animationEnter: {
+ type: 'fadeIn', // 新数据点淡入
+ duration: 800,
+ easing: 'easeInOutQuad'
+ },
+ animationUpdate: {
+ type: 'scaleIn', // 更新数据点缩放
+ duration: 500,
+ easing: 'easeInOutQuad'
+ }
+ }
+ ]
+};
+
+```
+
+
+##### Step 2: Register Animation
+
+
+
+Ensure that the required animations have been correctly registered in the system. This step is usually completed at project startup or explicitly called where needed.
+
+
+
+
+```xml
+import { Factory } from '@visactor/vchart';
+import { Appear_Grow, pulseAnimation, Appear_FadeIn, ScaleInOutAnimation } from './series/bar/animation';
+
+// 注册柱子生长动画
+Factory.registerAnimation('growCenterIn', Appear_Grow);
+
+// 注册脉冲动画
+Factory.registerAnimation('pulse', pulseAnimation);
+
+// 注册淡入动画
+Factory.registerAnimation('fadeIn', Appear_FadeIn);
+
+// 注册缩放动画
+Factory.registerAnimation('scaleIn', ScaleInOutAnimation);
+
+```
+
+
+##### Step 3: Initialize the Chart Instance
+
+
+
+With the above configuration, we can initialize a `VChart` instance and pass the configuration to it. This will trigger the chart rendering process and apply the corresponding animation effects.
+
+
+
+
+```xml
+import { VChart } from '@visactor/vchart';
+
+const container = document.getElementById('chart-container');
+const chart = new VChart({
+ el: container,
+ spec: chartSpec,
+ options: {
+ animation: true, // 开启动画
+ theme: 'light' // 使用浅色主题
+ }
+});
+
+```
+
+
+##### Step 4: Build Animation Choreography
+
+
+
+To achieve animation choreography, we need to construct a task chain that includes multiple animation tasks. Each task can be a single animation or a composite animation (i.e., containing multiple subtasks). Here are the specific implementation steps:
+
+
+
+* **Define Animation Tasks**: First, define each individual animation task, including their time offsets, action queues, and successor task lists.
+
+
+
+
+```xml
+const appearTask: IAnimationTask = {
+ timeOffset: 0,
+ actionList: [{ type: 'growCenterIn', duration: 1000 }],
+ nextTaskList: [normalTask]
+};
+
+const normalTask: IAnimationTask = {
+ timeOffset: 0,
+ actionList: [{ type: 'pulse', duration: 800, loop: true }],
+ nextTaskList: []
+};
+
+const enterTask: IAnimationTask = {
+ timeOffset: 0,
+ actionList: [{ type: 'fadeIn', duration: 800 }],
+ nextTaskList: []
+};
+
+const updateTask: IAnimationTask = {
+ timeOffset: 0,
+ actionList: [{ type: 'scaleIn', duration: 500 }],
+ nextTaskList: []
+};
+
+```
+
+
+* **Composite Animation Tasks**: Next, combine these tasks into a complete animation choreography. For example, we can create a task chain that includes entrance animations and animations in the normal state.
+
+
+
+
+```xml
+const animationArrangement: IAnimationTask = {
+ timeOffset: 0,
+ actionList: [],
+ nextTaskList: [appearTask, normalTask]
+};
+
+```
+
+
+##### Step 5: Trigger Data Update Animation
+
+
+
+Once the chart is rendered, any changes in the data will automatically trigger animations. For example, when new data is added, the `enter` task will be triggered; when data is updated, the `update` task takes effect; and when data is removed, the `exit` task comes into play.
+
+
+
+
+```xml
+// 模拟数据更新
+setTimeout(() => {
+ const updatedData = [
+ { value: 15 }, // 更新第一个数据点
+ { value: 25 }, // 更新第二个数据点
+ { value: 35 }, // 更新第三个数据点
+ { value: 45 } // 添加一个新的数据点
+ ];
+
+ // 更新图表数据并触发动画
+ chart.updateSeriesData(updatedData);
+}, 5000);
+
+```
+
+
+In this example, the `updateSeriesData` method triggers a series of animations:
+
+* For newly added data points (the fourth data point), the `enter` task will make it gradually appear with a fade-in effect.
+
+* For existing data points (the first three data points), the `update` task will adjust their size based on the new data values and transition with a scaling effect.
+
+
+
+##### Step 6: Dynamically Control Animation Orchestration
+
+
+
+In some cases, you may want to dynamically control the behavior of animation orchestration, such as changing the speed or style of the animation. VChart provides flexible methods to achieve this.
+
+
+
+
+```xml
+// 更新某个系列的动画编排配置
+chart.updateSeriesOptions(0, {
+ animationAppear: {
+ type: 'growCenterIn',
+ duration: 1200, // 更改持续时间
+ easing: 'linear' // 更改缓动函数
+ },
+ animationNormal: {
+ type: 'pulse',
+ duration: 1000, // 更改持续时间
+ easing: 'easeInOutCubic' // 更改缓动函数
+ }
+});
+
+// 重新应用新的动画配置
+chart.render();
+
+```
+
+
+#### 5. Internal Implementation of Animation Orchestration
+
+
+
+**AnimateManager Class**
+
+
+
+The `AnimateManager` class is responsible for managing and coordinating the state of all animations. It implements the `IAnimate` interface and provides methods to update and retrieve animation states. For animation orchestration, `AnimateManager` ensures that these animation tasks are executed in a predetermined order or condition.
+
+
+
+
+```xml
+class AnimateManager extends StateManager implements IAnimate {
+ updateAnimateState(state: AnimationStateEnum, noRender?: boolean) {
+ if (state === AnimationStateEnum.appear) {
+ this.updateState(
+ {
+ animationState: {
+ callback: (datum: any, element: IElement) => state
+ }
+ },
+ noRender
+ );
+ } else if (state === AnimationStateEnum.normal) {
+ this.updateState(
+ {
+ animationState: {
+ callback: (datum: any, element: IElement) => state
+ }
+ },
+ noRender
+ );
+ }
+ }
+
+ // 动画编排逻辑
+ arrangeAnimations(tasks: IAnimationTask[]) {
+ tasks.forEach(task => {
+ // 执行当前任务的动作队列
+ task.actionList.forEach(action => {
+ this.executeAction(action);
+ });
+
+ // 如果存在后继任务,则递归执行
+ if (task.nextTaskList && task.nextTaskList.length > 0) {
+ setTimeout(() => {
+ this.arrangeAnimations(task.nextTaskList);
+ }, task.timeOffset);
+ }
+ });
+ }
+
+ private executeAction(action: Action) {
+ // 根据action.type获取对应的动画配置
+ const animationConfig = Factory.getAnimationInKey(action.type);
+
+ // 应用动画配置到目标元素
+ this.applyAnimation(animationConfig, action.duration, action.easing);
+ }
+
+ private applyAnimation(config: MarkAnimationSpec, duration: number, easing: string) {
+ // 实际应用动画的逻辑
+ }
+}
+
+```
+
+
+This code demonstrates how to execute a set of animation tasks using the `arrangeAnimations` method. The action queue in each task will be executed one by one, and then subsequent tasks will be recursively processed according to the `timeOffset` attribute. This allows for the construction of an ordered animation sequence, achieving complex animation orchestration effects.
+
+
+
+#### 6. Advanced Features of Animation Orchestration
+
+
+
+**Conditional Triggering and Event Listening**
+
+
+
+To increase the flexibility of animation orchestration, VChart also provides conditional triggering and event listening features. For example, animations can be triggered by listening to user interaction events (such as clicks, hovers), or dynamically adjust animation behavior based on specific conditions (such as data thresholds).
+
+
+
+
+```xml
+// 监听用户交互事件
+chart.on('element:click', (event) => {
+ const element = event.detail.element;
+ if (element) {
+ // 根据点击事件触发动画
+ this.triggerCustomAnimation(element);
+ }
+});
+
+// 条件触发动画
+if (someCondition) {
+ // 触发特定条件下的动画
+ this.triggerConditionalAnimation();
+}
+
+```
+
+
+**Parallel Animation**
+
+
+
+Sometimes, we want multiple animations to occur simultaneously rather than waiting for each to finish in sequence. VChart supports parallel animations, allowing developers to define multiple animation tasks to start executing at the same time.
+
+
+
+
+```xml
+const parallelTasks: IAnimationTask[] = [
+ {
+ timeOffset: 0,
+ actionList: [{ type: 'growCenterIn', duration: 1000 }],
+ nextTaskList: []
+ },
+ {
+ timeOffset: 0,
+ actionList: [{ type: 'pulse', duration: 800, loop: true }],
+ nextTaskList: []
+ }
+];
+
+this.arrangeAnimations(parallelTasks);
+
+```
+
+
+**Delay and Interval**
+
+
+
+By setting the `timeOffset` property, you can control the delay time between animation tasks. Additionally, you can use `setInterval` or `setTimeout` to achieve more complex timing logic.
+
+
+
+
+```xml
+// 设置延时
+const delayedTask: IAnimationTask = {
+ timeOffset: 500, // 延迟500毫秒后执行
+ actionList: [{ type: 'pulse', duration: 800, loop: true }],
+ nextTaskList: []
+};
+
+this.arrangeAnimations([delayedTask]);
+
+// 使用 setInterval 实现周期性动画
+setInterval(() => {
+ this.triggerPeriodicAnimation();
+}, 2000); // 每2秒触发一次
+
+```
+
+
+#### 7. Example: Creating a Bar Chart with Animation Orchestration
+
+
+
+Below is an example of creating a bar chart with animation orchestration, illustrating how to use VChart's animation orchestration system to achieve the basic process.
+
+### Example: Creating a Bar Chart with Animation Orchestration
+
+
+
+In VChart, animation orchestration refers to the combination and sequencing of multiple animation effects to achieve complex and coordinated visual effects. Through proper animation orchestration, the interactivity and user experience of the chart can be significantly enhanced. Below we will demonstrate in detail how to create a bar chart with animation orchestration, including the entrance animation for new data points, the update animation for existing data points, and the exit animation for old data points.
+
+
+
+#### 1. Define Animation Configuration
+
+
+
+First, we need to define the basic configuration of the bar chart and specify specific animation effects for each animation state (`enter`, `update`, `exit`). To achieve complex animation orchestration, we can use chained animation tasks to define the specific animation sequence for each state.
+
+
+
+
+```xml
+const chartSpec = {
+ series: [
+ {
+ type: 'bar',
+ data: [
+ { category: 'A', value: 10 },
+ { category: 'B', value: 20 },
+ { category: 'C', value: 30 }
+ ],
+ animationEnter: {
+ type: 'fadeIn',
+ duration: 800,
+ easing: 'easeInOutQuad',
+ nextTaskList: [
+ {
+ timeOffset: 800,
+ actionList: [
+ { type: 'growCenterIn', duration: 500, easing: 'easeInOutQuad' }
+ ],
+ nextTaskList: [
+ {
+ timeOffset: 500,
+ actionList: [
+ { type: 'pulse', duration: 300, easing: 'easeInOutQuad' }
+ ]
+ }
+ ]
+ }
+ ]
+ },
+ animationUpdate: {
+ type: 'scaleIn',
+ duration: 500,
+ easing: 'easeInOutQuad'
+ },
+ animationExit: {
+ type: 'fadeOut',
+ duration: 600,
+ easing: 'easeInOutQuad'
+ }
+ }
+ ]
+};
+
+```
+
+
+In this configuration:
+
+* `**animationEnter**`: New data points first fade in (`fadeIn`), then grow outward from the center (`growCenterIn`), and finally pulse slightly (`pulse`).
+
+* `**animationUpdate**`: Existing data points transition with scaling when updated.
+
+* `**animationExit**`: Old data points disappear by fading out.
+
+
+
+#### 2. Register Animation
+
+
+
+Next, we need to ensure that the required animations have been correctly registered in the system. This step is usually completed at project startup or explicitly called where needed.
+
+
+
+
+```xml
+import { Factory } from '@visactor/vchart';
+import { Appear_FadeIn, ScaleInOutAnimation, Appear_FadeOut, growCenterIn, pulseAnimation } from './series/bar/animation';
+
+// 注册淡入动画
+Factory.registerAnimation('fadeIn', Appear_FadeIn);
+
+// 注册缩放动画
+Factory.registerAnimation('scaleIn', ScaleInOutAnimation);
+
+// 注册淡出动画
+Factory.registerAnimation('fadeOut', Appear_FadeOut);
+
+// 注册中心生长动画
+Factory.registerAnimation('growCenterIn', growCenterIn);
+
+// 注册脉冲动画
+Factory.registerAnimation('pulse', pulseAnimation);
+
+```
+
+
+These animation functions define the specific logic for fade-in, zoom, fade-out, center growth, and pulse animations respectively. For example, the `Appear_FadeIn` function might look like this:
+
+
+
+```xml
+export const Appear_FadeIn: IAnimationTypeConfig = {
+ type: 'fadeIn',
+ duration: 800,
+ easing: 'easeInOutQuad',
+ channel: {
+ opacity: { from: 0, to: 1 }
+ }
+};
+
+export const growCenterIn: IAnimationTypeConfig = {
+ type: 'growCenterIn',
+ duration: 500,
+ easing: 'easeInOutQuad',
+ channel: {
+ width: { from: 0, to: '100%' },
+ height: { from: 0, to: '100%' }
+ }
+};
+
+export const pulseAnimation: IAnimationTypeConfig = {
+ type: 'pulse',
+ duration: 300,
+ easing: 'easeInOutQuad',
+ channel: {
+ scale: { from: 1, to: 1.1, toBack: 1 }
+ }
+};
+
+```
+
+
+#### 3. Initialize Chart Instance
+
+
+
+With the above configuration, we can initialize a `VChart` instance and pass the configuration to it. This will trigger the chart rendering process and apply the corresponding animation effects.
+
+
+
+
+```xml
+import { VChart } from '@visactor/vchart';
+
+const container = document.getElementById('chart-container');
+const chart = new VChart({
+ el: container,
+ spec: chartSpec,
+ options: {
+ animation: true, // 开启动画
+ theme: 'light' // 使用浅色主题
+ }
+});
+
+```
+
+
+#### 4. Trigger Animation
+
+
+
+Once the chart is rendered, any changes in the data will automatically trigger animations. For example, when new data is added, the `animationEnter` configuration will take effect; when data is updated, the `animationUpdate` configuration is effective; and when data is removed, the `animationExit` configuration comes into play.
+
+
+
+
+```xml
+// 模拟数据更新
+setTimeout(() => {
+ const updatedData = [
+ { category: 'A', value: 15 }, // 更新第一个数据点
+ { category: 'B', value: 25 }, // 更新第二个数据点
+ { category: 'C', value: 35 }, // 更新第三个数据点
+ { category: 'D', value: 45 } // 添加一个新的数据点
+ ];
+
+ // 更新图表数据并触发动画
+ chart.updateSeriesData(updatedData);
+}, 5000);
+
+```
+
+
+In this example, the `updateSeriesData` method will trigger a series of animations:
+
+* **New Data Points (D)**:
+
+1. Fade In (`fadeIn`): Gradually change from opacity 0 to 1.
+
+1. Grow Center In (`growCenterIn`): Grow outward from the center, with width and height changing from 0 to the final value.
+
+1. Pulse (`pulse`): Slightly enlarge and then return to the original state to attract the user's attention.
+
+* **Existing Data Points (A, B, C)**:
+
+* Scale In (`scaleIn`): Adjust the height of the columns according to the new data values for a smooth transition.
+
+
+
+#### 5. Detailed Implementation of Animation Orchestration
+
+
+
+**Chained Animation Tasks**
+
+
+
+To achieve complex animation orchestration, we can use the `IAnimationTask` interface to define a sequence of animation tasks for each state. Each task includes time offset, action queue, and a list of successor tasks, forming a chained animation execution mechanism.
+
+
+
+
+```xml
+interface IAnimationTask {
+ timeOffset: number;
+ actionList: Action[];
+ nextTaskList: IAnimationTask[];
+}
+
+```
+
+
+**Example: Defining a Chained Animation Task**
+
+
+
+Suppose we want to define a complex chained animation task for new data points in a bar chart, starting with a fade-in, followed by a center growth, and finally a slight pulse effect.
+
+
+
+
+```xml
+const enterAnimationTasks: IAnimationTask[] = [
+ {
+ timeOffset: 0,
+ actionList: [
+ { type: 'fadeIn', duration: 800, easing: 'easeInOutQuad' }
+ ],
+ nextTaskList: [
+ {
+ timeOffset: 800,
+ actionList: [
+ { type: 'growCenterIn', duration: 500, easing: 'easeInOutQuad' }
+ ],
+ nextTaskList: [
+ {
+ timeOffset: 500,
+ actionList: [
+ { type: 'pulse', duration: 300, easing: 'easeInOutQuad' }
+ ]
+ }
+ ]
+ }
+ ]
+ }
+];
+
+```
+
+
+**Using Chained Animation Tasks in Chart Configuration**
+
+
+
+Integrate the defined chained animation tasks into the chart configuration to ensure that new data points execute animations in the expected order and effect.
+
+
+
+
+```xml
+const chartSpec = {
+ series: [
+ {
+ type: 'bar',
+ data: [
+ { category: 'A', value: 10 },
+ { category: 'B', value: 20 },
+ { category: 'C', value: 30 }
+ ],
+ animationEnter: enterAnimationTasks,
+ animationUpdate: {
+ type: 'scaleIn',
+ duration: 500,
+ easing: 'easeInOutQuad'
+ },
+ animationExit: {
+ type: 'fadeOut',
+ duration: 600,
+ easing: 'easeInOutQuad'
+ }
+ }
+ ]
+};
+
+```
+
+
+#### 6. Execution of Animation Tasks
+
+
+
+**Parsing and Execution of Animation Tasks**
+
+
+
+VChart internally parses the animation tasks in `animationEnter`, `animationUpdate`, and `animationExit`, and executes the corresponding animations according to the defined order and time offset. Below is a simplified example showing how to parse and execute chained animation tasks.
+
+
+
+
+```xml
+class AnimateManager extends StateManager implements IAnimate {
+ updateAnimateState(state: AnimationStateEnum, noRender?: boolean) {
+ if (state === AnimationStateEnum.update) {
+ this.updateState(
+ {
+ animationState: {
+ callback: (datum: any, element: IElement) => element.diffState
+ }
+ },
+ noRender
+ );
+ } else if (state === AnimationStateEnum.appear) {
+ // 处理新数据点的入场动画
+ this.handleAnimationTasks(element, element.animationConfig.enter);
+ } else if (state === AnimationStateEnum.exit) {
+ // 处理旧数据点的退场动画
+ this.handleAnimationTasks(element, element.animationConfig.exit);
+ }
+ }
+
+ private handleAnimationTasks(element: IElement, tasks: IAnimationTask[]) {
+ tasks.forEach(task => {
+ setTimeout(() => {
+ task.actionList.forEach(action => {
+ element.startAnimation(action.type, action.duration, action.easing);
+ });
+ if (task.nextTaskList) {
+ this.handleAnimationTasks(element, task.nextTaskList);
+ }
+ }, task.timeOffset);
+ });
+ }
+}
+
+```
+
+
+In this example, the `handleAnimationTasks` method recursively parses and executes each animation task, ensuring that the corresponding animations are triggered in the defined order and time offset.
+
+
+
+#### 7. Specific Implementation of Animations
+
+
+
+**Definition of Animation Functions**
+
+
+
+Each specific animation function (such as `Appear_FadeIn`, `ScaleInOutAnimation`, `Appear_FadeOut`, `growCenterIn`, and `pulseAnimation`) defines the specific behavior of the animation. Here are some examples of specific animation functions:
+
+
+
+
+```xml
+// 淡入动画
+export const Appear_FadeIn: IAnimationTypeConfig = {
+ type: 'fadeIn',
+ duration: 800,
+ easing: 'easeInOutQuad',
+ channel: {
+ opacity: { from: 0, to: 1 }
+ }
+};
+
+// 缩放动画
+export const ScaleInOutAnimation: IAnimationTypeConfig = {
+ type: 'scaleIn',
+ duration: 500,
+ easing: 'easeInOutQuad',
+ channel: {
+ scale: { from: 0.8, to: 1 }
+ }
+};
+
+// 淡出动画
+export const Appear_FadeOut: IAnimationTypeConfig = {
+ type: 'fadeOut',
+ duration: 600,
+ easing: 'easeInOutQuad',
+ channel: {
+ opacity: { from: 1, to: 0 }
+ }
+};
+
+// 中心生长动画
+export const growCenterIn: IAnimationTypeConfig = {
+ type: 'growCenterIn',
+ duration: 500,
+ easing: 'easeInOutQuad',
+ channel: {
+ width: { from: 0, to: '100%' },
+ height: { from: 0, to: '100%' }
+ }
+};
+
+// 脉冲动画
+export const pulseAnimation: IAnimationTypeConfig = {
+ type: 'pulse',
+ duration: 300,
+ easing: 'easeInOutQuad',
+ channel: {
+ scale: { from: 1, to: 1.1, toBack: 1 }
+ }
+};
+
+```
+
+
+**Registration of Animation Functions**
+
+
+
+Ensure that these animation functions have been correctly registered in the system so that they can be called when needed.
+
+
+
+
+```xml
+import { Factory } from '@visactor/vchart';
+import { Appear_FadeIn, ScaleInOutAnimation, Appear_FadeOut, growCenterIn, pulseAnimation } from './series/bar/animation';
+
+Factory.registerAnimation('fadeIn', Appear_FadeIn);
+Factory.registerAnimation('scaleIn', ScaleInOutAnimation);
+Factory.registerAnimation('fadeOut', Appear_FadeOut);
+Factory.registerAnimation('growCenterIn', growCenterIn);
+Factory.registerAnimation('pulse', pulseAnimation);
+
+```
+
+
+#### 8. Complete Example Code
+
+
+
+Below is a complete example code demonstrating how to create a bar chart with complex animation choreography.
+
+
+
+
+```xml
+// 导入必要的模块
+import { VChart } from '@visactor/vchart';
+import { Factory } from '@visactor/vchart';
+import { IElement, IAnimationTypeConfig } from '@visactor/vgrammar-core';
+
+// 定义动画函数
+export const Appear_FadeIn: IAnimationTypeConfig = {
+ type: 'fadeIn',
+ duration: 800,
+ easing: 'easeInOutQuad',
+ channel: {
+ opacity: { from: 0, to: 1 }
+ }
+};
+
+export const ScaleInOutAnimation: IAnimationTypeConfig = {
+ type: 'scaleIn',
+ duration: 500,
+ easing: 'easeInOutQuad',
+ channel: {
+ scale: { from: 0.8, to: 1 }
+ }
+};
+
+export const Appear_FadeOut: IAnimationTypeConfig = {
+ type: 'fadeOut',
+ duration: 600,
+ easing: 'easeInOutQuad',
+ channel: {
+ opacity: { from: 1, to: 0 }
+ }
+};
+
+export const growCenterIn: IAnimationTypeConfig = {
+ type: 'growCenterIn',
+ duration: 500,
+ easing: 'easeInOutQuad',
+ channel: {
+ width: { from: 0, to: '100%' },
+ height: { from: 0, to: '100%' }
+ }
+};
+
+export const pulseAnimation: IAnimationTypeConfig = {
+ type: 'pulse',
+ duration: 300,
+ easing: 'easeInOutQuad',
+ channel: {
+ scale: { from: 1, to: 1.1, toBack: 1 }
+ }
+};
+
+// 注册动画
+Factory.registerAnimation('fadeIn', Appear_FadeIn);
+Factory.registerAnimation('scaleIn', ScaleInOutAnimation);
+Factory.registerAnimation('fadeOut', Appear_FadeOut);
+Factory.registerAnimation('growCenterIn', growCenterIn);
+Factory.registerAnimation('pulse', pulseAnimation);
+
+// 定义链式动画任务
+const enterAnimationTasks: IAnimationTask[] = [
+ {
+ timeOffset: 0,
+ actionList: [
+ { type: 'fadeIn', duration: 800, easing: 'easeInOutQuad' }
+ ],
+ nextTaskList: [
+ {
+ timeOffset: 800,
+ actionList: [
+ { type: 'growCenterIn', duration: 500, easing: 'easeInOutQuad' }
+ ],
+ nextTaskList: [
+ {
+ timeOffset: 500,
+ actionList: [
+ { type: 'pulse', duration: 300, easing: 'easeInOutQuad' }
+ ]
+ }
+ ]
+ }
+ ]
+ }
+];
+
+// 定义图表配置
+const chartSpec = {
+ series: [
+ {
+ type: 'bar',
+ data: [
+ { category: 'A', value: 10 },
+ { category: 'B', value: 20 },
+ { category: 'C', value: 30 }
+ ],
+ animationEnter: enterAnimationTasks,
+ animationUpdate: {
+ type: 'scaleIn',
+ duration: 500,
+ easing: 'easeInOutQuad'
+ },
+ animationExit: {
+ type: 'fadeOut',
+ duration: 600,
+ easing: 'easeInOutQuad'
+ }
+ }
+ ]
+};
+
+// 初始化图表实例
+const container = document.getElementById('chart-container');
+const chart = new VChart({
+ el: container,
+ spec: chartSpec,
+ options: {
+ animation: true, // 开启动画
+ theme: 'light' // 使用浅色主题
+ }
+});
+
+// 模拟数据更新
+setTimeout(() => {
+ const updatedData = [
+ { category: 'A', value: 15 }, // 更新第一个数据点
+ { category: 'B', value: 25 }, // 更新第二个数据点
+ { category: 'C', value: 35 }, // 更新第三个数据点
+ { category: 'D', value: 45 } // 添加一个新的数据点
+ ];
+
+ // 更新图表数据并触发动画
+ chart.updateSeriesData(updatedData);
+}, 5000);
+
+```
+
+
+#### 9. Advanced Usage of Animation Orchestration
+
+
+
+**Conditional Animation Configuration**
+
+
+
+**Conditional Animation Configuration** allows dynamically selecting different animation effects based on specific attributes of data points. For example, when a data value exceeds a certain threshold, a special animation is used; otherwise, the default animation is used. VChart allows you to embed logical judgments in the configuration to achieve such requirements.
+
+
+
+
+```xml
+const chartSpec = {
+ series: [
+ {
+ type: 'bar',
+ data: [
+ { category: 'A', value: 10 },
+ { category: 'B', value: 60 },
+ { category: 'C', value: 30 }
+ ],
+ animationEnter: (datum: any) => {
+ if (datum.value > 50) {
+ return {
+ type: 'specialGrowth', // 特殊的生长动画
+ duration: 1000,
+ easing: 'easeInOutQuad'
+ };
+ } else {
+ return {
+ type: 'fadeIn', // 默认的淡入动画
+ duration: 800,
+ easing: 'easeInOutQuad'
+ };
+ }
+ },
+ animationUpdate: {
+ type: 'scaleIn',
+ duration: 500,
+ easing: 'easeInOutQuad'
+ },
+ animationExit: {
+ type: 'fadeOut',
+ duration: 600,
+ easing: 'easeInOutQuad'
+ }
+ }
+ ]
+};
+
+```
+
+
+In this example, the `animationEnter` configuration accepts a function as a parameter, which can return different animation configuration objects based on the specific attributes of the data points. Specifically:
+
+* **Data point B has a value of 60**, which is greater than the threshold of 50, so the `specialGrowth` animation is used.
+
+* **Data points A and C have values of 10 and 30 respectively**, which are less than the threshold of 50, so the `fadeIn` animation is used.
+
+
+
+**Custom Animation Types**
+
+
+
+In addition to using built-in animation types, VChart also supports developers in customizing animation logic. You can create new animation effects by inheriting or extending existing animation classes and register them into the system.
+
+
+
+
+```xml
+// 定义一个新的动画类型
+function specialGrowthAnimation(params: any): IAnimationTypeConfig {
+ return {
+ type: 'specialGrowth',
+ duration: 1000,
+ easing: 'easeInOutQuad',
+ channel: {
+ width: { from: 0, to: params.width },
+ height: { from: 0, to: params.height },
+ opacity: { from: 0, to: 1 }
+ }
+ };
+}
+
+// 注册自定义动画
+Factory.registerAnimation('specialGrowth', specialGrowthAnimation);
+
+// 在图表配置中使用自定义动画
+const chartSpec = {
+ series: [
+ {
+ type: 'bar',
+ data: [
+ { category: 'A', value: 10 },
+ { category: 'B', value: 60 },
+ { category: 'C', value: 30 }
+ ],
+ animationEnter: (datum: any) => {
+ if (datum.value > 50) {
+ return {
+ type: 'specialGrowth',
+ duration: 1000,
+ easing: 'easeInOutQuad'
+ };
+ } else {
+ return {
+ type: 'fadeIn',
+ duration: 800,
+ easing: 'easeInOutQuad'
+ };
+ }
+ },
+ animationUpdate: {
+ type: 'scaleIn',
+ duration: 500,
+ easing: 'easeInOutQuad'
+ },
+ animationExit: {
+ type: 'fadeOut',
+ duration: 600,
+ easing: 'easeInOutQuad'
+ }
+ }
+ ]
+};
+
+```
+
+
+In this example, we define a custom animation named `specialGrowth` and register it into the system. Then, in the `animationEnter` configuration, we dynamically choose to use either the `specialGrowth` or `fadeIn` animation based on the value of the data point.
+
+
+
+#### 10. Advanced Usage of Animation Tasks
+
+
+
+**Nested Animation Tasks**
+
+
+
+In addition to simple chained animation tasks, VChart also supports nested animation tasks, making animation orchestration more flexible and complex. Through nested tasks, more precise animation control can be achieved.
+
+
+
+**Example: Nested Animation Tasks**
+
+
+
+Suppose we want to create a more complex animation sequence for newly added data points, starting with a fade-in, followed by a center growth, then a slight pulse effect, and finally a highlight.
+
+
+
+
+```xml
+const enterAnimationTasks: IAnimationTask[] = [
+ {
+ timeOffset: 0,
+ actionList: [
+ { type: 'fadeIn', duration: 800, easing: 'easeInOutQuad' }
+ ],
+ nextTaskList: [
+ {
+ timeOffset: 800,
+ actionList: [
+ { type: 'growCenterIn', duration: 500, easing: 'easeInOutQuad' }
+ ],
+ nextTaskList: [
+ {
+ timeOffset: 500,
+ actionList: [
+ { type: 'pulse', duration: 300, easing: 'easeInOutQuad' }
+ ],
+ nextTaskList: [
+ {
+ timeOffset: 300,
+ actionList: [
+ { type: 'highlight', duration: 500, easing: 'easeInOutQuad' }
+ ]
+ }
+ ]
+ }
+ ]
+ }
+ ]
+ }
+];
+
+```
+
+
+In this nested animation task:
+
+1. **Fade In (**`**fadeIn**`**)**: Gradually changes from opacity 0 to 1.
+
+1. **Grow Center In (**`**growCenterIn**`**)**: Grows outward from the center, with width and height changing from 0 to the final value.
+
+1. **Pulse (**`**pulse**`**)**: Slightly enlarges and then returns to its original state to attract the user's attention.
+
+1. **Highlight (**`**highlight**`**)**: Adds a highlight effect to the data point after the animation ends.
+
+
+
+**Define Highlight Animation**
+
+
+
+First, define and register the highlight animation.
+
+
+
+
+```xml
+export const highlightAnimation: IAnimationTypeConfig = {
+ type: 'highlight',
+ duration: 500,
+ easing: 'easeInOutQuad',
+ channel: {
+ fill: { from: 'blue', to: 'red', toBack: 'blue' }
+ }
+};
+
+// 注册高亮显示动画
+Factory.registerAnimation('highlight', highlightAnimation);
+
+```
+
+
+**Use Nested Animation Tasks in Chart Configuration**
+
+
+
+Integrate the defined nested animation tasks into the chart configuration.
+
+
+
+
+```xml
+const chartSpec = {
+ series: [
+ {
+ type: 'bar',
+ data: [
+ { category: 'A', value: 10 },
+ { category: 'B', value: 20 },
+ { category: 'C', value: 30 }
+ ],
+ animationEnter: enterAnimationTasks,
+ animationUpdate: {
+ type: 'scaleIn',
+ duration: 500,
+ easing: 'easeInOutQuad'
+ },
+ animationExit: {
+ type: 'fadeOut',
+ duration: 600,
+ easing: 'easeInOutQuad'
+ }
+ }
+ ]
+};
+
+```
+
+
+#### 11. Execution Mechanism of Animation Tasks
+
+
+
+**Parsing and Execution of Animation Tasks**
+
+
+
+VChart internally parses the animation tasks in `animationEnter`, `animationUpdate`, and `animationExit`, and executes the corresponding animations according to the defined order and time offset. Below is a simplified example showing how to parse and execute chained animation tasks.
+
+
+
+
+```xml
+class AnimateManager extends StateManager implements IAnimate {
+ updateAnimateState(state: AnimationStateEnum, noRender?: boolean) {
+ if (state === AnimationStateEnum.update) {
+ this.updateState(
+ {
+ animationState: {
+ callback: (datum: any, element: IElement) => element.diffState
+ }
+ },
+ noRender
+ );
+ } else if (state === AnimationStateEnum.appear) {
+ // 处理新数据点的入场动画
+ this.handleAnimationTasks(element, element.animationConfig.enter);
+ } else if (state === AnimationStateEnum.exit) {
+ // 处理旧数据点的退场动画
+ this.handleAnimationTasks(element, element.animationConfig.exit);
+ }
+ }
+
+ private handleAnimationTasks(element: IElement, tasks: IAnimationTask[]) {
+ tasks.forEach(task => {
+ setTimeout(() => {
+ task.actionList.forEach(action => {
+ element.startAnimation(action.type, action.duration, action.easing);
+ });
+ if (task.nextTaskList) {
+ this.handleAnimationTasks(element, task.nextTaskList);
+ }
+ }, task.timeOffset);
+ });
+ }
+}
+
+```
+
+
+In this example, the `handleAnimationTasks` method recursively parses and executes each animation task, ensuring that the corresponding animations are triggered in the defined order and time offset.
+
+
+
+**Timing of Animation Task Triggering**
+
+
+
+To ensure animations are triggered at the appropriate time, VChart provides a series of hook functions, such as `VGRAMMAR_HOOK_EVENT.AFTER_DO_RENDER` and `VGRAMMAR_HOOK_EVENT.ANIMATION_END`. These hooks can help us execute specific logic when the chart is first rendered or when the animation ends.
+
+
+
+
+```xml
+this._event.on(VGRAMMAR_HOOK_EVENT.AFTER_DO_RENDER, () => {
+ // 图表首次渲染完成后的逻辑
+ console.log('图表首次渲染完成');
+});
+
+this._event.on(VGRAMMAR_HOOK_EVENT.ANIMATION_END, ({ event }) => {
+ if (event.animationState === AnimationStateEnum.enter) {
+ // enter 动画结束后的逻辑
+ console.log('新数据点入场动画结束');
+ } else if (event.animationState === AnimationStateEnum.update) {
+ // update 动画结束后的逻辑
+ console.log('现有数据点更新动画结束');
+ } else if (event.animationState === AnimationStateEnum.exit) {
+ // exit 动画结束后的逻辑
+ console.log('旧数据点退场动画结束');
+ }
+});
+
+```
+
+
+#### 12. Best Practices for Animation Coordination
+
+
+
+**Batch Update Data**
+
+
+
+To improve performance, it is recommended to minimize frequent data update operations. If you need to update a large amount of data, consider merging these updates into a single batch operation to reduce unnecessary rendering times.
+
+
+
+
+```xml
+// 不推荐的做法:逐个更新数据点
+data.forEach((item, index) => {
+ setTimeout(() => {
+ chart.updateSeriesData([/* 更新后的数据 */]);
+ }, index * 100); // 每隔100毫秒更新一个数据点
+});
+
+// 推荐的做法:一次性批量更新所有数据
+setTimeout(() => {
+ const updatedData = data.map(item => /* 更新后的数据 */);
+ chart.updateSeriesData(updatedData);
+}, 1000); // 1秒后一次性更新所有数据
+
+```
+
+
+**Lazy Load Animation**
+
+
+
+For scenarios with large charts or a large number of data points, lazy loading can be used to delay loading animations until user interaction or specific conditions are met. This helps improve initial loading speed and overall performance.
+
+
+
+
+```xml
+// 懒加载动画配置
+const chartSpec = {
+ series: [
+ {
+ type: 'bar',
+ data: [/* 大量数据数组 */],
+ animationEnter: {
+ type: 'lazyFadeIn',
+ duration: 800,
+ easing: 'easeInOutQuad',
+ lazyLoad: true // 启用懒加载
+ }
+ }
+ ]
+};
+
+// 当用户滚动到视口内时触发懒加载动画
+window.addEventListener('scroll', () => {
+ if (isInViewPort(chartContainer)) {
+ chart.startLazyAnimations();
+ }
+});
+
+```
+
+
+**Cache Animation Results**
+
+
+
+For those animation effects with high computational cost, consider caching their results to avoid repeated calculations. For example, for complex path animations, you can pre-calculate the keyframes of the path and reuse these keyframes in subsequent rendering.
+
+
+
+
+```xml
+class PathAnimator {
+ private cachedFrames: KeyFrame[];
+
+ constructor(private pathData: PathData) {
+ this.cachedFrames = this.computeKeyFrames(pathData);
+ }
+
+ private computeKeyFrames(data: PathData): KeyFrame[] {
+ // 计算路径的关键帧并返回
+ }
+
+ public animate(element: IElement): void {
+ // 使用缓存的关键帧进行动画
+ this.applyCachedFrames(element);
+ }
+}
+
+```
+
+
+**Event Throttling and Debouncing**
+
+
+
+To avoid performance issues caused by frequent event triggering, you can apply throttling or debouncing techniques to event listeners. For example, when handling mouse hover events, you can limit the frequency of animation triggers.
+
+
+
+
+```xml
+import throttle from 'lodash/throttle';
+
+// 对鼠标悬停事件应用节流
+chart.on('element:hover', throttle((event) => {
+ // 触发悬停动画
+}, 200)); // 每200毫秒最多触发一次
+
+```
+
+
+**Dynamic Control of Animation**
+
+
+
+In some cases, you may want to dynamically control the behavior of animations, such as changing the speed or style of the animation. VChart provides flexible methods to achieve this.
+
+
+
+
+```xml
+// 更新某个系列的动画配置
+chart.updateSeriesOptions(0, {
+ animationEnter: {
+ duration: 1000, // 更改淡入动画的持续时间
+ easing: 'linear' // 更改缓动函数
+ },
+ animationUpdate: {
+ duration: 700, // 更改缩放动画的持续时间
+ easing: 'easeInOutCubic' // 更改缓动函数
+ },
+ animationExit: {
+ duration: 900, // 更改淡出动画的持续时间
+ easing: 'easeInOutCubic' // 更改缓动函数
+ }
+});
+
+// 重新应用新的动画配置
+chart.render();
+
+```
+
+
+#### 13. Complete Example Code
+
+
+
+Below is a complete example code demonstrating how to create a bar chart with complex animation choreography, implementing conditional animation configuration and custom animation types.
+
+
+
+
+```xml
+// 导入必要的模块
+import { VChart } from '@visactor/vchart';
+import { Factory } from '@visactor/vchart';
+import { IElement, IAnimationTypeConfig } from '@visactor/vgrammar-core';
+
+// 定义动画函数
+export const Appear_FadeIn: IAnimationTypeConfig = {
+ type: 'fadeIn',
+ duration: 800,
+ easing: 'easeInOutQuad',
+ channel: {
+ opacity: { from: 0, to: 1 }
+ }
+};
+
+export const ScaleInOutAnimation: IAnimationTypeConfig = {
+ type: 'scaleIn',
+ duration: 500,
+ easing: 'easeInOutQuad',
+ channel: {
+ scale: { from: 0.8, to: 1 }
+ }
+};
+
+export const Appear_FadeOut: IAnimationTypeConfig = {
+ type: 'fadeOut',
+ duration: 600,
+ easing: 'easeInOutQuad',
+ channel: {
+ opacity: { from: 1, to: 0 }
+ }
+};
+
+export const growCenterIn: IAnimationTypeConfig = {
+ type: 'growCenterIn',
+ duration: 500,
+ easing: 'easeInOutQuad',
+ channel: {
+ width: { from: 0, to: '100%' },
+ height: { from: 0, to: '100%' }
+ }
+};
+
+export const pulseAnimation: IAnimationTypeConfig = {
+ type: 'pulse',
+ duration: 300,
+ easing: 'easeInOutQuad',
+ channel: {
+ scale: { from: 1, to: 1.1, toBack: 1 }
+ }
+};
+
+export const highlightAnimation: IAnimationTypeConfig = {
+ type: 'highlight',
+ duration: 500,
+ easing: 'easeInOutQuad',
+ channel: {
+ fill: { from: 'blue', to: 'red', toBack: 'blue' }
+ }
+};
+
+// 注册动画
+Factory.registerAnimation('fadeIn', Appear_FadeIn);
+Factory.registerAnimation('scaleIn', ScaleInOutAnimation);
+Factory.registerAnimation('fadeOut', Appear_FadeOut);
+Factory.registerAnimation('growCenterIn', growCenterIn);
+Factory.registerAnimation('pulse', pulseAnimation);
+Factory.registerAnimation('highlight', highlightAnimation);
+
+// 定义链式动画任务
+const enterAnimationTasks: IAnimationTask[] = [
+ {
+ timeOffset: 0,
+ actionList: [
+ { type: 'fadeIn', duration: 800, easing: 'easeInOutQuad' }
+ ],
+ nextTaskList: [
+ {
+ timeOffset: 800,
+ actionList: [
+ { type: 'growCenterIn', duration: 500, easing: 'easeInOutQuad' }
+ ],
+ nextTaskList: [
+ {
+ timeOffset: 500,
+ actionList: [
+ { type: 'pulse', duration: 300, easing: 'easeInOutQuad' }
+ ],
+ nextTaskList: [
+ {
+ timeOffset: 300,
+ actionList: [
+ { type: 'highlight', duration: 500, easing: 'easeInOutQuad' }
+ ]
+ }
+ ]
+ }
+ ]
+ }
+ ]
+ }
+];
+
+// 定义图表配置
+const chartSpec = {
+ series: [
+ {
+ type: 'bar',
+ data: [
+ { category: 'A', value: 10 },
+ { category: 'B', value: 20 },
+ { category: 'C', value: 30 }
+ ],
+ animationEnter: enterAnimationTasks,
+ animationUpdate: {
+ type: 'scaleIn',
+ duration: 500,
+ easing: 'easeInOutQuad'
+ },
+ animationExit: {
+ type: 'fadeOut',
+ duration: 600,
+ easing: 'easeInOutQuad'
+ }
+ }
+ ]
+};
+
+// 初始化图表实例
+const container = document.getElementById('chart-container');
+const chart = new VChart({
+ el: container,
+ spec: chartSpec,
+ options: {
+ animation: true, // 开启动画
+ theme: 'light' // 使用浅色主题
+ }
+});
+
+// 模拟数据更新
+setTimeout(() => {
+ const updatedData = [
+ { category: 'A', value: 15 }, // 更新第一个数据点
+ { category: 'B', value: 25 }, // 更新第二个数据点
+ { category: 'C', value: 35 }, // 更新第三个数据点
+ { category: 'D', value: 65
+
+```
+
+
+In this example, the `animationEnter` configuration accepts a function as a parameter, which can return different values based on the specific attributes of the data points.
+
+### Continuing to Interpret the Implementation of Data Update Animation
+
+
+
+In the previous section, we have detailed the basic concepts and implementation methods of data update animation in VChart. Next, we will delve into some more specific details, including how to handle complex animation sequences, advanced usage of animation configuration, and best practices for optimizing performance.
+
+
+
+#### 1. Handling Complex Animation Sequences
+
+
+
+**Chained Animation Tasks**
+
+
+
+For complex animation sequences, VChart introduces the `IAnimationTask` interface to describe the data structure of animation tasks. Each task includes a time offset, an action queue, and a list of successor tasks, forming a chained animation execution mechanism.
+
+
+
+
+```xml
+interface IAnimationTask {
+ timeOffset: number;
+ actionList: Action[];
+ nextTaskList: IAnimationTask[];
+}
+
+```
+
+
+This design allows multiple animation tasks to be executed sequentially or concurrently, achieving more complex and subtle animation effects. For example, in a bar chart, we can define a series of consecutive animation tasks, first letting the newly added data points fade in, then gradually grow to the final height, and finally add some decorative animations (such as highlighting).
+
+
+
+**Example: Creating Chained Animations**
+
+
+
+Suppose we want to create a chained entry animation for new data points in a bar chart, starting with a fade-in, followed by growth, and finally a slight pulse effect to attract the user's attention.
+
+
+
+
+```xml
+const enterAnimationTasks: IAnimationTask[] = [
+ {
+ timeOffset: 0,
+ actionList: [
+ { type: 'fadeIn', duration: 800, easing: 'easeInOutQuad' }
+ ],
+ nextTaskList: [
+ {
+ timeOffset: 800,
+ actionList: [
+ { type: 'growCenterIn', duration: 500, easing: 'easeInOutQuad' }
+ ],
+ nextTaskList: [
+ {
+ timeOffset: 500,
+ actionList: [
+ { type: 'pulse', duration: 300, easing: 'easeInOutQuad' }
+ ]
+ }
+ ]
+ }
+ ]
+ }
+];
+
+```
+
+
+In this example, we use the `enterAnimationTasks` array to define a series of animation tasks, each with its own time offset, action queue, and list of successor tasks. In this way, very rich visual effects can be achieved.
+
+
+
+#### 2. Advanced Usage of Animation Configuration
+
+
+
+**Conditional Animation Configuration**
+
+
+
+Sometimes, you may want to dynamically choose different animation effects based on certain conditions. For example, when a data value exceeds a certain threshold, use a special animation; otherwise, use the default animation. VChart allows you to embed logical judgments in the configuration to achieve such requirements.
+
+
+
+
+```xml
+const chartSpec = {
+ series: [
+ {
+ type: 'bar',
+ data: [/* 数据数组 */],
+ animationEnter: (datum: any) => {
+ if (datum.value > 50) {
+ return {
+ type: 'specialGrowth', // 特殊的生长动画
+ duration: 1000,
+ easing: 'easeInOutQuad'
+ };
+ } else {
+ return {
+ type: 'fadeIn', // 默认的淡入动画
+ duration: 800,
+ easing: 'easeInOutQuad'
+ };
+ }
+ },
+ animationUpdate: {
+ type: 'scaleIn',
+ duration: 500,
+ easing: 'easeInOutQuad'
+ },
+ animationExit: {
+ type: 'fadeOut',
+ duration: 600,
+ easing: 'easeInOutQuad'
+ }
+ }
+ ]
+};
+
+```
+
+
+In this example, the `animationEnter` configuration accepts a function as a parameter, which can return different animation configuration objects based on the specific attributes of the data points. This allows the animation behavior to be dynamically adjusted according to the actual data, enhancing the expressiveness of the chart.
+
+
+
+**Custom Animation Types**
+
+
+
+In addition to using built-in animation types, VChart also supports developers in customizing animation logic. You can create new animation effects by inheriting or extending existing animation classes and registering them into the system.
+
+
+
+```xml
+import { Factory } from '@visactor/vchart';
+import { IElement, IAnimationTypeConfig } from '@visactor/vgrammar-core';
+
+// 定义一个新的动画类型
+function customGrowAnimation(params: any): IAnimationTypeConfig {
+ return {
+ type: 'customGrow',
+ duration: 1000,
+ easing: 'easeInOutQuad',
+ channel: {
+ width: { from: 0, to: params.width },
+ height: { from: 0, to: params.height }
+ }
+ };
+}
+
+// 注册自定义动画
+Factory.registerAnimation('customGrow', customGrowAnimation);
+
+// 在图表配置中使用自定义动画
+const chartSpec = {
+ series: [
+ {
+ type: 'bar',
+ data: [/* 数据数组 */],
+ animationEnter: {
+ type: 'customGrow',
+ width: 50,
+ height: 100
+ }
+ }
+ ]
+};
+
+```
+
+
+This code demonstrates how to define and register a custom animation named `customGrow`, which adjusts the width and height of graphic elements based on the parameters passed. Then, this custom animation can be directly used in the chart configuration.
+
+
+
+#### 3. Performance Optimization and Best Practices
+
+
+
+**Batch Update Data**
+
+
+
+To improve performance, it is recommended to minimize frequent data update operations. If you need to update a large amount of data, consider merging these updates into a single batch operation to reduce unnecessary rendering times.
+
+
+
+
+```xml
+// 不推荐的做法:逐个更新数据点
+data.forEach((item, index) => {
+ setTimeout(() => {
+ chart.updateSeriesData([/* 更新后的数据 */]);
+ }, index * 100); // 每隔100毫秒更新一个数据点
+});
+
+// 推荐的做法:一次性批量更新所有数据
+setTimeout(() => {
+ const updatedData = data.map(item => /* 更新后的数据 */);
+ chart.updateSeriesData(updatedData);
+}, 1000); // 1秒后一次性更新所有数据
+
+```
+
+
+**Lazy Load Animation**
+
+
+
+For scenarios with large charts or a large number of data points, lazy loading can be used to delay the animation until user interaction or specific conditions are met. This helps improve initial loading speed and overall performance.
+
+
+
+
+```xml
+// 懒加载动画配置
+const chartSpec = {
+ series: [
+ {
+ type: 'bar',
+ data: [/* 大量数据数组 */],
+ animationEnter: {
+ type: 'lazyFadeIn',
+ duration: 800,
+ easing: 'easeInOutQuad',
+ lazyLoad: true // 启用懒加载
+ }
+ }
+ ]
+};
+
+// 当用户滚动到视口内时触发懒加载动画
+window.addEventListener('scroll', () => {
+ if (isInViewPort(chartContainer)) {
+ chart.startLazyAnimations();
+ }
+});
+
+```
+
+
+**Cache Animation Results**
+
+
+
+For those animation effects with high computational cost, consider caching their results to avoid repeated calculations. For example, for complex path animations, you can pre-calculate the keyframes of the path and reuse these keyframes in subsequent renderings.
+
+
+
+
+```xml
+class PathAnimator {
+ private cachedFrames: KeyFrame[];
+
+ constructor(private pathData: PathData) {
+ this.cachedFrames = this.computeKeyFrames(pathData);
+ }
+
+ private computeKeyFrames(data: PathData): KeyFrame[] {
+ // 计算路径的关键帧并返回
+ }
+
+ public animate(element: IElement): void {
+ // 使用缓存的关键帧进行动画
+ this.applyCachedFrames(element);
+ }
+}
+
+```
+
+
+**Event Throttling and Debouncing**
+
+
+
+To avoid performance issues caused by frequent event triggering, you can apply throttling or debouncing techniques to event listeners. For example, when handling mouse hover events, you can limit the frequency of animation triggers.
+
+
+
+
+```xml
+import throttle from 'lodash/throttle';
+
+// 对鼠标悬停事件应用节流
+chart.on('element:hover', throttle((event) => {
+ // 触发悬停动画
+}, 200)); // 每200毫秒最多触发一次
+
+```
+
+
+#### 4. Case Study
+
+
+
+**Case: Dynamic Bar Chart**
+
+
+
+Suppose we are developing a dynamic bar chart that updates in real-time, with a new batch of data added to the chart every second. We need to ensure that each time the data is updated, the newly added data points are presented to the user in a smooth and engaging manner, while the existing data points remain stable.
+
+
+
+##### Step 1: Define Basic Configuration
+
+
+
+First, define the basic configuration of the bar chart, including initial data and other visual attributes. At the same time, specify `animationEnter`, `animationUpdate`, and `animationExit` configurations to ensure animations are triggered when data changes.
+
+
+
+
+```xml
+const chartSpec = {
+ series: [
+ {
+ type: 'bar',
+ data: [/* 初始数据数组 */],
+ animationEnter: {
+ type: 'fadeIn',
+ duration: 800,
+ easing: 'easeInOutQuad'
+ },
+ animationUpdate: {
+ type: 'scaleIn',
+ duration: 500,
+ easing: 'easeInOutQuad'
+ },
+ animationExit: {
+ type: 'fadeOut',
+ duration: 600,
+ easing: 'easeInOutQuad'
+ }
+ }
+ ]
+};
+
+```
+
+
+##### Step 2: Implement Data Update Logic
+
+
+
+Next, implement a timer that adds a batch of new data to the chart every second and triggers the corresponding animation.
+
+
+
+
+```xml
+setInterval(() => {
+ const newDataBatch = generateNewData(); // 生成新的数据批次
+ const updatedData = [...chart.getData(), ...newDataBatch];
+
+ // 更新图表数据并触发动画
+ chart.updateSeriesData(updatedData);
+}, 1000);
+
+```
+
+
+##### Step 3: Optimize Performance
+
+
+
+Considering that a new batch of data is added every second, it may impact performance. Therefore, we can take the following optimization measures:
+
+
+
+* **Batch update data**: Update all new data to the chart at once, instead of adding them one by one.
+
+* **Lazy load animations**: Enable lazy load animations for newly added data points, so that animations only start playing when they enter the viewport.
+
+* **Event throttling**: Apply throttling techniques to interaction events such as mouse hover to prevent unnecessary animations from being triggered frequently.
+
+
+
+
+```xml
+// 批量更新数据
+setTimeout(() => {
+ const updatedData = generateAllNewData(); // 生成所有新的数据
+ chart.updateSeriesData(updatedData);
+}, 1000);
+
+// 懒加载动画配置
+const chartSpec = {
+ series: [
+ {
+ type: 'bar',
+ data: [/* 数据数组 */],
+ animationEnter: {
+ type: 'lazyFadeIn',
+ duration: 800,
+ easing: 'easeInOutQuad',
+ lazyLoad: true
+ }
+ }
+ ]
+};
+
+// 对鼠标悬停事件应用节流
+chart.on('element:hover', throttle((event) => {
+ // 触发悬停动画
+}, 200));
+
+```
+
+
+##### Step 4: Enhance User Experience
+
+
+
+To make the charts more vivid and interesting, you can add additional decorative animations to the newly added data points, such as highlighting or tooltip labels. This not only enhances visual appeal but also helps users better understand the changes in the data.
+
+
+
+
+```xml
+// 添加高亮显示动画
+const chartSpec = {
+ series: [
+ {
+ type: 'bar',
+ data: [/* 数据数组 */],
+ animationEnter: {
+ type: 'fadeIn',
+ duration: 800,
+ easing: 'easeInOutQuad',
+ onEnd: (element: IElement) => {
+ element.addHighlight(); // 添加高亮效果
+ }
+ }
+ }
+ ]
+};
+
+// 添加标签提示动画
+chart.on('element:hover', (event) => {
+ const element = event.detail.element;
+ if (element) {
+ element.showTooltip(); // 显示标签提示
+ }
+});
+
+```
+
+
+#### 5. Dynamic Control of Animation
+
+
+
+**Dynamically Adjust Animation Parameters**
+
+
+
+In some cases, you may want to dynamically adjust animation parameters such as duration, easing functions, etc., based on user input or other external factors. VChart provides flexible methods to achieve this.
+
+
+
+
+```xml
+// 根据用户选择动态调整动画参数
+const updateAnimationParams = (seriesIndex: number, newParams: Partial) => {
+ chart.updateSeriesOptions(seriesIndex, {
+ animationEnter: {
+ ...chart.getSeriesOptions(seriesIndex).animationEnter,
+ ...newParams
+ }
+ });
+
+ // 重新应用新的动画配置
+ chart.render();
+};
+
+// 用户选择更快的动画速度
+updateAnimationParams(0, { duration: 500 });
+
+```
+
+
+**Pause and Resume Animation**
+
+
+
+ # This document was revised and organized by the following person
+ [玄魂](https://github.com/xuanhun)
\ No newline at end of file
diff --git a/docs/assets/contributing/en/sourcecode/11.1-theme-configuration-parsing-logic.md b/docs/assets/contributing/en/sourcecode/11.1-theme-configuration-parsing-logic.md
new file mode 100644
index 0000000000..55aacd1960
--- /dev/null
+++ b/docs/assets/contributing/en/sourcecode/11.1-theme-configuration-parsing-logic.md
@@ -0,0 +1,436 @@
+---
+title: 11.1 Theme Configuration Parsing Logic
+
+key words: VisActor,VChart,VTable,VStrory,VMind,VGrammar,VRender,Visualization,Chart,Data,Table,Graph,Gis,LLM
+---
+# VChart Theme Related Concepts
+
+The theme module of VChart is a powerful and flexible chart style configuration system. It allows users to customize the visual appearance of charts in a unified and reusable way. Users can easily define comprehensive style configurations for the entire chart or specific chart types, including colors, fonts, layouts, component styles, etc. By using predefined themes, users can quickly achieve a consistent design style without having to repeatedly configure styles for each chart, greatly simplifying the chart development process and ensuring visual consistency and professionalism across different scenarios. In simple terms, the theme of VChart is like a "design template" for charts, allowing users to quickly create beautiful and professional data visualization charts by simply selecting or customizing a theme.
+
+Theme concept related documents: [VisActor/VChart tutorial documents](https://www.visactor.io/vchart/guide/tutorial_docs/Theme/Theme_Concept_and_Design_Rules)
+
+## Theme Related Source Code Location and Content
+
+* package/vchart/scr/util/theme: A folder of utility classes related to themes, including tools for theme merging, parsing, preprocessing (color palettes, token semantics), and converting string themes to objects.
+
+* package/vchart/scr/core/vchart.ts: Defines the core class VChart, including a series of hooks throughout the chart lifecycle such as theme initialization, registration, updating, switching, and destruction. VChart is a specific chart instance responsible for application and rendering, closely related to theme configuration and updates.
+
+* package/vchart/src/theme: This folder contains special concepts related to themes: color palettes (color-theme), tokenMap, theme manager class (theme-manager), and other data structures.
+
+## Core Classes and Their Relationships
+
+* VChart: Responsible for specific rendering, instantiation, and lifecycle management of charts
+
+* ThemeManager: Responsible for global registration, management, and switching of themes
+
+`ThemeManager` is exposed as a static class of VChart, allowing users to manage themes using commands like
+
+`VChart.ThemeManager.registerTheme('myTheme', { ... });` or `VChart.ThemeManager.setCurrentTheme('myTheme');`
+
+```xml
+export class VChart implements IVChart {
+ static readonly ThemeManager = ThemeManager;
+}
+
+```
+However, essentially, `ThemeManager` is still an independent class, but it provides a more convenient way to access it through this method. This design pattern of exposing static properties achieves the decoupling of theme management and chart rendering.
+
+# **Theme Configuration Parsing Logic**
+
+VChart provides two ways to configure chart themes:
+
+* Through chart `spec` configuration
+
+* By registering themes through `ThemeManager`
+
+## **Theme Configuration Retrieval and Priority Comparison (core/vchart.ts)**
+
+
+
+Both configurations can be set up with a `ITheme` type theme object, but what is the priority of these two configurations? This priority issue is handled in the updateCurrentTheme method:
+
+
+
+ **Note**: Strictly speaking, there are three sources of themes:
+
+> * `currentTheme`: The global default theme registered through `ThemeManager`
+> * `optionTheme`: The theme passed in the options of the VChart constructor
+> * `specTheme`: The theme specified in the chart specification (spec)
+>
+> Their priority from low to high is:
+> * `currentTheme` < `optionTheme` < `specTheme`
+
+
+
+In `src/core/vchart.ts`, the following properties are used to obtain the theme content configured by the user:
+
+
+
+* `_spec.theme`: The theme specified by the user in the chart spec object configuration
+
+* `_currentThemeName`: The current global theme name registered through `VChart.ThemeManager.registerTheme`
+
+### **Brief Analysis of Theme Merging Logic (util/theme/merge-theme.ts)**
+
+#### **mergeTheme Function**
+
+```xml
+export function mergeTheme(target: Maybe, ...sources: Maybe[]): Maybe {
+ return mergeSpec(transformThemeToMerge(target), ...sources.map(transformThemeToMerge));
+}
+
+```
+* It is the basis for merging themes, a simple layer of encapsulation. Simply put, it is the overriding of object properties.
+
+* The result is that the later appearing `sources` will override the earlier appearing `theme`.
+
+**Example**
+
+```xml
+const baseTheme = { color: 'blue', fontSize: 12 };
+const optionTheme = { color: 'red' };
+const specTheme = { fontSize: 14 };
+
+const finalTheme = mergeTheme({}, baseTheme, optionTheme, specTheme);
+// 结果:{ color: 'red', fontSize: 14 }
+
+```
+#### transformThemeToMerge function
+
+
+```xml
+ function transformThemeToMerge(theme?: Maybe): Maybe {
+ if (!theme) {
+ return theme;
+ }
+ // 将色板转化为标准形式
+ const colorScheme = transformColorSchemeToMerge(theme.colorScheme);
+
+ return Object.assign({}, theme, {
+ colorScheme,
+ token: theme.token ?? {},
+ series: Object.assign({}, theme.series)
+ } as Partial);
+}
+
+/** 将色板转化为标准形式 */
+export function transformColorSchemeToMerge(colorScheme?: Maybe): Maybe {
+ if (colorScheme) {
+ colorScheme = Object.keys(colorScheme).reduce((scheme, key) => {
+ const value = colorScheme[key];
+ scheme[key] = transformColorSchemeToStandardStruct(value);
+ return scheme;
+ }, {} as IThemeColorScheme);
+ }
+ return colorScheme;
+}
+
+```
+`transformThemeToMerge` generally serves to standardize and normalize the theme object, addressing the following:
+
+* Colors are always in array form
+
+* Always have `token` and `series` attributes
+
+This ensures that regardless of the theme configuration provided by the user, it can be transformed into a structurally complete, consistent, and predictable theme object, providing a standardized data structure for subsequent theme merging and application.
+
+#### **processThemeByChartType Function**
+
+```xml
+const processThemeByChartType = (type: string, theme: ITheme) => {
+ if (theme.chart?.[type]) {
+ theme = mergeTheme({}, theme, theme.chart[type]);
+ }
+ return theme;
+};
+
+```
+`processThemeByChartType` is a key function in the VChart theme system that implements chart type personalization. It achieves the ability to provide customized styles for different chart types while maintaining global theme consistency through conditional merging and `mergeTheme`.
+
+### **Parsing and Processing of String Themes and Object Themes**
+
+When configuring themes, users can easily and conveniently pass in string themes (usually themes exported from third-party theme packages), for example:
+
+```xml
+import vScreenVolcanoBlue from '@visactor/vchart-theme/public/vScreenVolcanoBlue.json';
+import VChart from '@visactor/vchart';
+
+VChart.ThemeManager.registerTheme('vScreenVolcanoBlue', vScreenVolcanoBlue);
+
+VChart.ThemeManager.setCurrentTheme('vScreenVolcanoBlue');
+
+```
+You can also pass in a custom theme with detailed configuration, for example:
+
+```xml
+const chart = new VChart({
+ theme: {
+ color: { primary: 'red' },
+ fontSize: 14,
+ chart: {
+ bar: {
+ color: 'blue'
+ }
+ }
+ }
+});
+
+```
+The core of handling both in the source code is to determine the type in \_updateCurrentTheme and convert it through `getThemeObject()`, uniformly processing it into an object theme for parsing. This is a simple logic, yet it provides flexibility and convenience for VChart's configuration.
+
+Ultimately, after layers of priority comparison, merging of table types (`processThemeByChartType`), and theme merging processing logic, the `currentTheme` attribute mounted on the VChart object is finally obtained.
+
+## **Preprocessing of Theme Configuration**
+
+When the theme configuration is merged, it enters the preprocessing stage. Theme preprocessing is a key step in the VChart theme system, converting abstract theme descriptions into specific style configurations, providing developers with intuitive configuration capabilities.
+
+Mainly accomplishes the following tasks:
+
+1. Semantic color conversion
+
+* Convert color semantics like `{ color: 'brand.primary' }` into specific color values
+
+1. Token replacement
+
+* Convert token semantics like `{ fontSize: 'size.m' }` into specific font sizes
+
+1. Recursive processing of nested objects
+
+**Preprocessing Flow**:
+
+
+```xml
+this._currentTheme = preprocessTheme(processThemeByChartType(chartType, finalTheme));
+
+```
+## **Preprocessing and Parsing of Themes**
+
+```xml
+export function preprocessTheme(
+ obj: any, //主题对象
+ colorScheme?: IThemeColorScheme, // 颜色方案
+ tokenMap?: TokenMap, // 标记映射
+ seriesSpec?: ISeriesSpec // 系列规格
+);
+
+```
+这里涉及了 VChart 主题配置的重要概念:
+
+* `colorScheme`: Color scheme
+
+* `tokenMap`: Token mapping
+
+```xml
+VChart.ThemeManager.registerTheme('dataVizTheme', {
+ colorScheme: {
+ brand: { primary: '#3A8DFF' },
+ data: {
+ positive: '#48BB78',
+ negative: '#F56565'
+ }
+ },
+ tokenMap: {
+ typography: {
+ fontSize: {
+ small: 12,
+ medium: 14,
+ large: 16
+ }
+ }
+ }
+});
+
+```
+
+
+Developers can use the `registerTheme` method during registration to register a complex theme configuration based on these two concepts, as shown in the example above. In actual use, developers can reference these definitions through { color: 'data.positive' } or { fontSize: { token: 'typography.fontSize.medium' } }. Here, let's discuss how VChart parses this complex object.
+
+
+
+First, analyze layer by layer, the key algorithm of this processing function processTheme is to recursively traverse the object:
+
+```xml
+Object.keys(obj).forEach(key => {
+ const value = obj[key];
+ if (IGNORE_KEYS.includes(key)) {
+ newObj[key] = value;
+ }
+ // 处理颜色语义化转换、Token 语义化转换
+ else if (isPlainObject(value)) {
+ if (isColorKey(value)) {
+ newObj[key] = getActualColor(value, colorScheme, seriesSpec);
+ } else if (isTokenKey(value)) {
+ newObj[key] = queryToken(tokenMap, value);
+ }
+ // 这里使用了递归处理嵌套对象,使得能够处理任意深度的嵌套对象
+ else {
+ newObj[key] = preprocessTheme(value, colorScheme, tokenMap, seriesSpec);
+ }
+ }
+ // 非对象类型直接赋值
+ else {
+ newObj[key] = value;
+ }
+});
+
+```
+
+
+Next, analyze the specific handling and parsing of color semantics and token semantics
+
+#### **getActualColor Color Semantics**
+
+```xml
+/** 查询语义化颜色 */
+export const getActualColor = (value: any, colorScheme?: IThemeColorScheme, seriesSpec?: ISeriesSpec) => {
+ if (colorScheme && isColorKey(value)) {
+ const color = queryColorFromColorScheme(colorScheme, value, seriesSpec);
+ if (color) {
+ return color;
+ }
+ }
+ return value;
+};
+
+export function queryColorFromColorScheme(
+ colorScheme: IThemeColorScheme,
+ colorKey: IColorKey,
+ seriesSpec?: ISeriesSpec
+): ColorSchemeItem | undefined {
+ const scheme = getColorSchemeBySeries(colorScheme, seriesSpec);
+ if (!scheme) {
+ return undefined;
+ }
+ let color;
+ const { palette } = scheme as IColorSchemeStruct;
+ if (isObject(palette)) {
+ color = getUpgradedTokenValue(palette, colorKey.key) ?? colorKey.default;
+ }
+ if (!color) {
+ return undefined;
+ }
+ if ((isNil(colorKey.a) && isNil(colorKey.l)) || !isString(color)) {
+ return color;
+ }
+ let c = new Color(color);
+ if (isValid(colorKey.l)) {
+ const { r, g, b } = c.color;
+ const { h, s } = rgbToHsl(r, g, b);
+ const rgb = hslToRgb(h, s, colorKey.l);
+ const newColor = new Color(`rgb(${rgb.r}, ${rgb.g}, ${rgb.b})`);
+ newColor.setOpacity(c.color.opacity);
+ c = newColor;
+ }
+ if (isValid(colorKey.a)) {
+ c.setOpacity(colorKey.a);
+ }
+ return c.toRGBA();
+}
+
+```
+
+
+queryColorFromColorScheme is the core function for color processing in the VChart theme system. It receives a color scheme (colorScheme), a color key (colorKey), and an optional series specification (seriesSpec). Through a series of complex color lookup and conversion algorithms, it achieves precise localization and dynamic enhancement of semantic colors.
+
+
+
+The core logic of the function is: first, obtain a specific color scheme based on the series specification, and then look up the corresponding color from the palette.
+
+
+```xml
+export function getColorSchemeBySeries(
+ colorScheme?: IThemeColorScheme,
+ seriesSpec?: ISeriesSpec
+): ColorScheme | undefined {
+ const { type: seriesType } = seriesSpec ?? {};
+ let scheme: ColorScheme | undefined;
+ if (!seriesSpec || isNil(seriesType)) {
+ scheme = colorScheme?.default;
+ } else {
+ const direction = getDirectionFromSeriesSpec(seriesSpec);
+ scheme = colorScheme?.[`${seriesType}_${direction}`] ?? colorScheme?.[seriesType] ?? colorScheme?.default;
+ }
+ return scheme;
+}
+
+```
+This algorithm prioritizes matching the color scheme of a specific `seriesType_direction`, then matches the general `seriesType` color scheme, and finally matches the default color scheme.
+
+It is worth mentioning that this function also provides two advanced color processing capabilities, dynamically handling color characteristics based on the `l` or `a` attributes in `colorKey`:
+
+1. **Dynamic adjustment of color brightness through HSL color space conversion**
+
+ **Algorithm Principle**
+
+ Color space conversion: RGB → HSL → RGB
+
+ **Core code for HSL brightness adjustment**
+
+```xml
+ if (isValid(colorKey.l)) {
+ const { r, g, b } = c.color;
+ const { h, s } = rgbToHsl(r, g, b);
+ const rgb = hslToRgb(h, s, colorKey.l);
+ const newColor = new Color(rgb(${rgb.r}, ${rgb.g}, ${rgb.b}));
+ newColor.setOpacity(c.color.opacity);
+ c = newColor;
+ }
+
+```
+Simply put, it is to adjust the brightness level (L) of the color while maintaining the original hue (H) and saturation (S). The conversion algorithm between hsl and rgb formats is not the focus of the topic analysis, so it is briefly mentioned:
+
+(tokenMap: TokenMap, tokenKey: ITokenKey): T | undefined {
+ if (tokenMap && tokenKey.key in tokenMap) {
+ return tokenMap[tokenKey.key];
+ }
+ return tokenKey.default;
+}
+
+```
+This function is used to query the corresponding token value based on tokenMap and tokenKey. If the corresponding token exists in tokenMap, it returns the corresponding value; otherwise, it returns the default value.
+
+
+
+---
+# This document is provided by the following personnel
+
+Dundun (https://github.com/Shabi-x)
+
+
+
+ # This document is revised and organized by the following personnel
+ [Xuanhun](https://github.com/xuanhun)
\ No newline at end of file
diff --git a/docs/assets/contributing/en/sourcecode/11.2-theme-update-source-code-analysis.md b/docs/assets/contributing/en/sourcecode/11.2-theme-update-source-code-analysis.md
new file mode 100644
index 0000000000..1e7cfe2ed5
--- /dev/null
+++ b/docs/assets/contributing/en/sourcecode/11.2-theme-update-source-code-analysis.md
@@ -0,0 +1,300 @@
+---
+title: 11.2 Source Code Interpretation of Theme Updates
+
+key words: VisActor,VChart,VTable,VStrory,VMind,VGrammar,VRender,Visualization,Chart,Data,Table,Graph,Gis,LLM
+---
+# Basic Concepts of Theme Updates
+
+VChart theme switching is a common operation: for example, according to different seasons, holidays, or internationalization, personalized color schemes, and the common night mode. Users can manually or listen to the user's system to switch different styles of themes to adapt to different usage environments.
+
+## Theme Update Examples
+
+For example, registration and switching of night mode:
+
+```xml
+VChart.ThemeManager.registerTheme('darkTheme', { ... });
+VChart.ThemeManager.registerTheme('lightTheme', { ... });
+
+function toggleTheme(isDarkMode) {
+ const themeName = isDarkMode ? 'darkTheme' : 'lightTheme';
+ VChart.ThemeManager.setCurrentTheme(themeName);
+}
+
+```
+Style switching for different application scenarios:
+
+
+```xml
+// 不同风格的主题配置
+const themes = {
+ 'finance': { ... },
+ 'medical': { ... },
+ 'technology': { ... }
+};
+
+Object.keys(themes).forEach(key => {
+ VChart.ThemeManager.registerTheme(key + 'Theme', themes[key]);
+});
+
+function switchDashboardTheme(businessType) {
+ const themeName = businessType + 'Theme';
+ VChart.ThemeManager.setCurrentTheme(themeName);
+}
+
+```
+# Source Code Location and Content Related to Themes
+
+* package/vchart/scr/core/**vchart.ts**: The theme updater for a single chart instance, implementing the specific theme application logic, transforming the global theme into actual style changes for the chart. The main update logic of the chart is here.
+
+* package/vchart/src/core/instance-manager.ts: The central hub for chart instance registration and management, providing the infrastructure for traversing and locating theme instance updates, ensuring that each chart can receive theme updates.
+
+* package/vchart/src/theme/theme-manager.ts: The global theme scheduling center, responsible for theme registration, retrieval, and global updates, providing a unified theme management entry and coordination mechanism.
+
+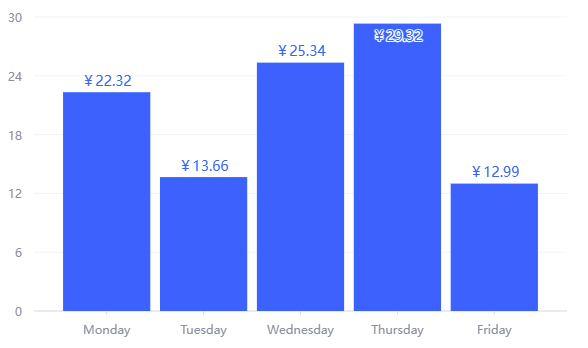 +> The formatting effect is shown in the image
+
+
+
+### media-query
+
+The media-query plugin module implements media query functionality. To facilitate understanding, a demo from the official website can be used to explain:
+
+```Typescript
+const getSpec = () => ({
+ type: 'pie',
+ data: [
+ //...
+ ],
+ //query-media配置流程
+ media: [
+ {
+ query: {
+ maxHeight: 200
+ },
+ action: [
+ {
+ filterType: 'legends',
+ filter: [{ orient: 'top' }, { orient: 'bottom' }],
+ spec: { orient: 'left', padding: 0 }
+ },
+ {
+ filterType: 'title',
+ spec: { visible: false }
+ },
+ {
+ filterType: 'chart',
+ spec: { padding: 10 }
+ }
+ ]
+ }
+ ]
+});
+
+```
+
+> The formatting effect is shown in the image
+
+
+
+### media-query
+
+The media-query plugin module implements media query functionality. To facilitate understanding, a demo from the official website can be used to explain:
+
+```Typescript
+const getSpec = () => ({
+ type: 'pie',
+ data: [
+ //...
+ ],
+ //query-media配置流程
+ media: [
+ {
+ query: {
+ maxHeight: 200
+ },
+ action: [
+ {
+ filterType: 'legends',
+ filter: [{ orient: 'top' }, { orient: 'bottom' }],
+ spec: { orient: 'left', padding: 0 }
+ },
+ {
+ filterType: 'title',
+ spec: { visible: false }
+ },
+ {
+ filterType: 'chart',
+ spec: { padding: 10 }
+ }
+ ]
+ }
+ ]
+});
+
+```
+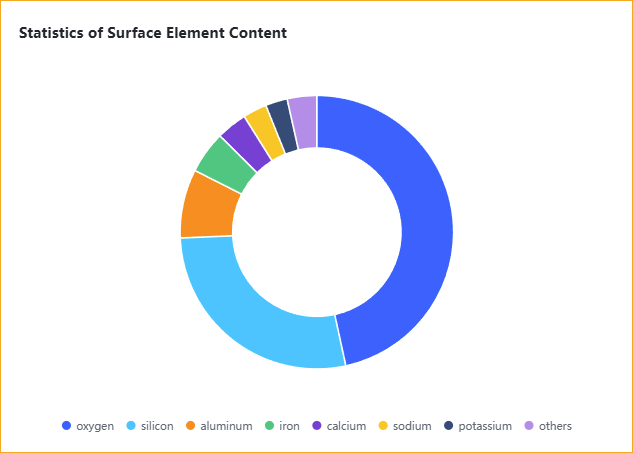 +
+
+
+
+
+
+
+ +
+
+
+Observing this example, it is not difficult to find that under the effect of media queries, by declaring media query logic, the style changes of the chart's dynamic layout at different heights are achieved:
+
+* When the chart height ≤ 200px:
+
+* The legend direction changes to the left side, with padding of 0.
+
+* The title is hidden.
+
+* The chart padding is 10.
+
+* When the chart height > 200px:
+
+* Restore default styles.
+
+
+
+Simply put, the media-query plugin of VChart supports us in triggering actions to rearrange the chart layout, achieving responsive design of the chart, enhancing user experience and development efficiency.
+
+
+
+
+
+In the next chapter, I will provide a deeper interpretation of the specific implementation mechanism of the plugin:
+
+
+ # This document was revised and organized by the following personnel
+ [Xuanhun](https://github.com/xuanhun)
\ No newline at end of file
diff --git a/docs/assets/contributing/en/sourcecode/12.2-vchart-plugin-feature-source-code-analysis.md b/docs/assets/contributing/en/sourcecode/12.2-vchart-plugin-feature-source-code-analysis.md
new file mode 100644
index 0000000000..8df10b2bcd
--- /dev/null
+++ b/docs/assets/contributing/en/sourcecode/12.2-vchart-plugin-feature-source-code-analysis.md
@@ -0,0 +1,103 @@
+---
+title: 12.2 VChart Plugin Functionality Source Code Explanation
+
+key words: VisActor,VChart,VTable,VStrory,VMind,VGrammar,VRender,Visualization,Chart,Data,Table,Graph,Gis,LLM
+---
+In the previous section (#12.1 VChart Plugin Mechanism), the basic usage of plugins in VChart was introduced. In this section, I will delve into the source code to explore the implementation logic of various plugins in depth;
+
+## Relevant Source Code Locations
+
+* ` packages/vchart/src/plugin/chart/formatter/` : Core implementation of the formatting plugin
+
+* ` packages/vchart/src/plugin/chart/media-query/` : Core implementation of the media query plugin
+
+## Formatting Plugin
+
+### Numerical Text Formatting
+
+
+```xml
+ protected _formatSingleText(text: string | number, formatter: string): string | number {
+ const isNumeric = numberSpecifierReg.test(formatter);
+ if (isNumeric && this._numericFormatter) {
+ // 内置的 formatter 逻辑,可以进行缓存性能优化
+ let numericFormat;
+ if (this._numericFormatterCache && this._numericSpecifier) {
+ if (this._numericFormatterCache.get(formatter)) {
+ numericFormat = this._numericFormatterCache.get(formatter);
+ } else {
+ numericFormat = this._numericSpecifier(formatter) as any;
+ this._numericFormatterCache.set(formatter, numericFormat);
+ }
+ return numericFormat(Number(text));
+ }
+ return this._numericFormatter(formatter, Number(text));
+ } else if (formatter.includes('%') && this._timeFormatter) {
+ return this._timeFormatter(formatter, text);
+ }
+ return text;
+ }
+
+
+```
+### Time Text Formatting
+
+VChart for time format conversion in
+
+
+```xml
+private readonly _timeModeFormat = {
+ utc: TimeUtil.getInstance().timeUTCFormat,
+ local: TimeUtil.getInstance().timeFormat
+};
+
+// 在 onInit 中设置时间格式化器
+onInit(service: IChartPluginService, chartSpec: any) {
+ const { timeMode, timeFormatter } = this._spec;
+
+ if (isFunction(timeFormatter)) {
+ // 使用自定义时间格式化函数
+ this._timeFormatter = timeFormatter;
+ } else if (timeMode && this._timeModeFormat[timeMode]) {
+ // 使用内置的 UTC 或本地时间格式化
+ this._timeFormatter = this._timeModeFormat[timeMode];
+ }
+}
+
+// 在 _formatSingleText 中处理时间格式化
+protected _formatSingleText(text: string | number, formatter: string): string | number {
+ // 数值格式化逻辑...
+
+ // 时间格式化逻辑
+ else if (formatter.includes('%') && this._timeFormatter) {
+ return this._timeFormatter(formatter, text);
+ }
+
+ return text;
+}
+
+```
+### Data Variable Replacement
+
+1. **Template Parsing**:
+
+* Use regular expression `/\{([^}]\u002B)\}/g` to match curly brace templates
+
+* Support nested format definitions (e.g., `{field:format}`)
+
+1. **Field Extraction**:
+
+* Split field name and format specification with a colon (`field:format`)
+
+1. **Dynamic Replacement**:
+
+* Extract corresponding field values from the data object `datum`
+
+* Recursively apply format specifications for secondary formatting
+
+## Media-query Plugin
+
+
+
+ # This document was revised and organized by the following person
+ [玄魂](https://github.com/xuanhun)
\ No newline at end of file
diff --git a/docs/assets/contributing/en/sourcecode/13.1-vchart-on-demand-loading-mechanism.md b/docs/assets/contributing/en/sourcecode/13.1-vchart-on-demand-loading-mechanism.md
new file mode 100644
index 0000000000..d5ee627d78
--- /dev/null
+++ b/docs/assets/contributing/en/sourcecode/13.1-vchart-on-demand-loading-mechanism.md
@@ -0,0 +1,147 @@
+---
+title: 13.1 VChart On-Demand Loading Mechanism
+
+key words: VisActor,VChart,VTable,VStrory,VMind,VGrammar,VRender,Visualization,Chart,Data,Table,Graph,Gis,LLM
+---
+VChart is a ready-to-use chart library that provides 20+ chart types by default. As the number of chart types increases and features become richer, package size is a major concern for everyone. Therefore, VChart uses an on-demand loading mechanism to meet various needs for VChart in different scenarios. Before introducing the specific design, we need to understand two prerequisite concepts:
+
+* VChart chart composition
+
+* What is tree-shaking
+
+This article will introduce the principle of VChart's on-demand loading from these two perspectives.
+
+## VChart Chart Composition
+
+### Terminology Definition
+
+Before delving into the composition of VChart charts, we need to understand the following terms:
+
+* `series` - The main body of the chart, also known as a series, contains a set of graphic elements and their corresponding chart logic.
+
+* `mark` - Basic graphic elements, also known as basic graphics, such as points, lines, etc.
+
+* `region` - Spatial information element, associated with one or more series, helps in spatial positioning.
+
+* `component` - Components that assist in reading and interacting with the chart, such as legends, axes, tooltips, etc.
+
+* `layout` - Layout, manages the spatial distribution of chart elements.
+
+* `chart` - An abstract concept of a chart, the manager that integrates and manages data, graphic elements, components, and layout elements.
+
+### Chart Definition
+
+#### Logical Layer Chart Elements
+
+We break down the logical layer elements of a chart into the following four parts:
+
+* series is the main body of the chart, containing a set of graphic elements and the corresponding type of chart logic. For example, in a line chart, series refers to the collection of points and lines and all the logic of the line chart.
+
+* component provides auxiliary capabilities, helping with reading and interacting with the chart, such as legends, axes, tooltips, dataZoom, etc.
+
+* region is a spatial information element that can associate with one or more series, helping series with spatial positioning, and is also a minimum combination unit.
+
+* chart is an abstract concept, the manager that integrates and manages various elements of the chart, and is the core context of the chart's logical layer.
+
+##### Simple Chart
+
+A simple chart consists of a region, a series of a determined type, a component, and a chart that manages the chart logic. Taking a common line chart as an example, its composition is as follows
+
+
+
+
+
+Observing this example, it is not difficult to find that under the effect of media queries, by declaring media query logic, the style changes of the chart's dynamic layout at different heights are achieved:
+
+* When the chart height ≤ 200px:
+
+* The legend direction changes to the left side, with padding of 0.
+
+* The title is hidden.
+
+* The chart padding is 10.
+
+* When the chart height > 200px:
+
+* Restore default styles.
+
+
+
+Simply put, the media-query plugin of VChart supports us in triggering actions to rearrange the chart layout, achieving responsive design of the chart, enhancing user experience and development efficiency.
+
+
+
+
+
+In the next chapter, I will provide a deeper interpretation of the specific implementation mechanism of the plugin:
+
+
+ # This document was revised and organized by the following personnel
+ [Xuanhun](https://github.com/xuanhun)
\ No newline at end of file
diff --git a/docs/assets/contributing/en/sourcecode/12.2-vchart-plugin-feature-source-code-analysis.md b/docs/assets/contributing/en/sourcecode/12.2-vchart-plugin-feature-source-code-analysis.md
new file mode 100644
index 0000000000..8df10b2bcd
--- /dev/null
+++ b/docs/assets/contributing/en/sourcecode/12.2-vchart-plugin-feature-source-code-analysis.md
@@ -0,0 +1,103 @@
+---
+title: 12.2 VChart Plugin Functionality Source Code Explanation
+
+key words: VisActor,VChart,VTable,VStrory,VMind,VGrammar,VRender,Visualization,Chart,Data,Table,Graph,Gis,LLM
+---
+In the previous section (#12.1 VChart Plugin Mechanism), the basic usage of plugins in VChart was introduced. In this section, I will delve into the source code to explore the implementation logic of various plugins in depth;
+
+## Relevant Source Code Locations
+
+* ` packages/vchart/src/plugin/chart/formatter/` : Core implementation of the formatting plugin
+
+* ` packages/vchart/src/plugin/chart/media-query/` : Core implementation of the media query plugin
+
+## Formatting Plugin
+
+### Numerical Text Formatting
+
+
+```xml
+ protected _formatSingleText(text: string | number, formatter: string): string | number {
+ const isNumeric = numberSpecifierReg.test(formatter);
+ if (isNumeric && this._numericFormatter) {
+ // 内置的 formatter 逻辑,可以进行缓存性能优化
+ let numericFormat;
+ if (this._numericFormatterCache && this._numericSpecifier) {
+ if (this._numericFormatterCache.get(formatter)) {
+ numericFormat = this._numericFormatterCache.get(formatter);
+ } else {
+ numericFormat = this._numericSpecifier(formatter) as any;
+ this._numericFormatterCache.set(formatter, numericFormat);
+ }
+ return numericFormat(Number(text));
+ }
+ return this._numericFormatter(formatter, Number(text));
+ } else if (formatter.includes('%') && this._timeFormatter) {
+ return this._timeFormatter(formatter, text);
+ }
+ return text;
+ }
+
+
+```
+### Time Text Formatting
+
+VChart for time format conversion in
+
+
+```xml
+private readonly _timeModeFormat = {
+ utc: TimeUtil.getInstance().timeUTCFormat,
+ local: TimeUtil.getInstance().timeFormat
+};
+
+// 在 onInit 中设置时间格式化器
+onInit(service: IChartPluginService, chartSpec: any) {
+ const { timeMode, timeFormatter } = this._spec;
+
+ if (isFunction(timeFormatter)) {
+ // 使用自定义时间格式化函数
+ this._timeFormatter = timeFormatter;
+ } else if (timeMode && this._timeModeFormat[timeMode]) {
+ // 使用内置的 UTC 或本地时间格式化
+ this._timeFormatter = this._timeModeFormat[timeMode];
+ }
+}
+
+// 在 _formatSingleText 中处理时间格式化
+protected _formatSingleText(text: string | number, formatter: string): string | number {
+ // 数值格式化逻辑...
+
+ // 时间格式化逻辑
+ else if (formatter.includes('%') && this._timeFormatter) {
+ return this._timeFormatter(formatter, text);
+ }
+
+ return text;
+}
+
+```
+### Data Variable Replacement
+
+1. **Template Parsing**:
+
+* Use regular expression `/\{([^}]\u002B)\}/g` to match curly brace templates
+
+* Support nested format definitions (e.g., `{field:format}`)
+
+1. **Field Extraction**:
+
+* Split field name and format specification with a colon (`field:format`)
+
+1. **Dynamic Replacement**:
+
+* Extract corresponding field values from the data object `datum`
+
+* Recursively apply format specifications for secondary formatting
+
+## Media-query Plugin
+
+
+
+ # This document was revised and organized by the following person
+ [玄魂](https://github.com/xuanhun)
\ No newline at end of file
diff --git a/docs/assets/contributing/en/sourcecode/13.1-vchart-on-demand-loading-mechanism.md b/docs/assets/contributing/en/sourcecode/13.1-vchart-on-demand-loading-mechanism.md
new file mode 100644
index 0000000000..d5ee627d78
--- /dev/null
+++ b/docs/assets/contributing/en/sourcecode/13.1-vchart-on-demand-loading-mechanism.md
@@ -0,0 +1,147 @@
+---
+title: 13.1 VChart On-Demand Loading Mechanism
+
+key words: VisActor,VChart,VTable,VStrory,VMind,VGrammar,VRender,Visualization,Chart,Data,Table,Graph,Gis,LLM
+---
+VChart is a ready-to-use chart library that provides 20+ chart types by default. As the number of chart types increases and features become richer, package size is a major concern for everyone. Therefore, VChart uses an on-demand loading mechanism to meet various needs for VChart in different scenarios. Before introducing the specific design, we need to understand two prerequisite concepts:
+
+* VChart chart composition
+
+* What is tree-shaking
+
+This article will introduce the principle of VChart's on-demand loading from these two perspectives.
+
+## VChart Chart Composition
+
+### Terminology Definition
+
+Before delving into the composition of VChart charts, we need to understand the following terms:
+
+* `series` - The main body of the chart, also known as a series, contains a set of graphic elements and their corresponding chart logic.
+
+* `mark` - Basic graphic elements, also known as basic graphics, such as points, lines, etc.
+
+* `region` - Spatial information element, associated with one or more series, helps in spatial positioning.
+
+* `component` - Components that assist in reading and interacting with the chart, such as legends, axes, tooltips, etc.
+
+* `layout` - Layout, manages the spatial distribution of chart elements.
+
+* `chart` - An abstract concept of a chart, the manager that integrates and manages data, graphic elements, components, and layout elements.
+
+### Chart Definition
+
+#### Logical Layer Chart Elements
+
+We break down the logical layer elements of a chart into the following four parts:
+
+* series is the main body of the chart, containing a set of graphic elements and the corresponding type of chart logic. For example, in a line chart, series refers to the collection of points and lines and all the logic of the line chart.
+
+* component provides auxiliary capabilities, helping with reading and interacting with the chart, such as legends, axes, tooltips, dataZoom, etc.
+
+* region is a spatial information element that can associate with one or more series, helping series with spatial positioning, and is also a minimum combination unit.
+
+* chart is an abstract concept, the manager that integrates and manages various elements of the chart, and is the core context of the chart's logical layer.
+
+##### Simple Chart
+
+A simple chart consists of a region, a series of a determined type, a component, and a chart that manages the chart logic. Taking a common line chart as an example, its composition is as follows
+
+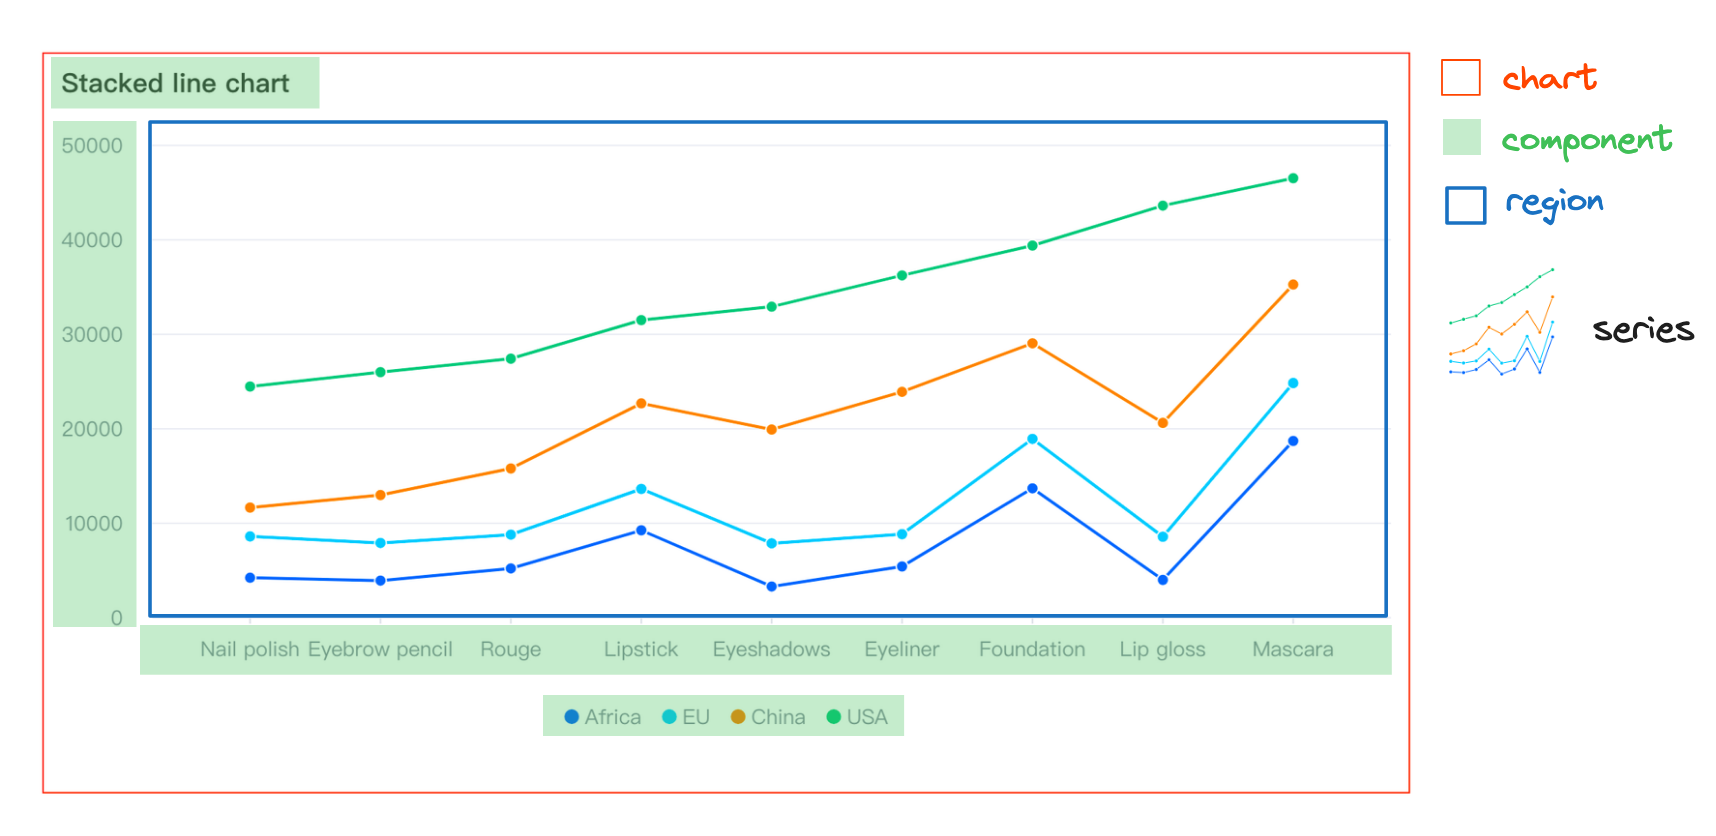 +
+##### Combination Chart
+
+We define a combination chart as consisting of multiple regions, multiple series of determined types, components, and a chart that manages the chart logic. Here, we encapsulate the chart as a combination chart with `type: 'common'`.
+
+In a combination chart, several different types of sub-charts can be defined. Each sub-chart can independently configure its own data and components, and all sub-charts are by default associated with the same region. At this point, each sub-chart overlaps on the region. We take the common bar-line dual-axis chart as an example to introduce the combination chart in detail:
+
+* First, if we need to create a combination chart, we need to declare `type: 'common'`, indicating that the type of chart we need to create is a combination chart.
+
+* As mentioned above, the chart is the manager that integrates and manages data, graphic elements, components, and layout elements. Logically, it consists of region + series + layout, and the bar and line correspond to the 'bar' and 'line' series types, respectively. By default, all series are associated with the same region, so we do not need to configure the region here.
+
+* Each series can have its own data source, or the data source can be directly configured on the chart. In the series, it is associated through `fromDataId` or `fromDataIndex`. In the current example, we choose to configure it on the chart.
+
+
+
+##### Combination Chart
+
+We define a combination chart as consisting of multiple regions, multiple series of determined types, components, and a chart that manages the chart logic. Here, we encapsulate the chart as a combination chart with `type: 'common'`.
+
+In a combination chart, several different types of sub-charts can be defined. Each sub-chart can independently configure its own data and components, and all sub-charts are by default associated with the same region. At this point, each sub-chart overlaps on the region. We take the common bar-line dual-axis chart as an example to introduce the combination chart in detail:
+
+* First, if we need to create a combination chart, we need to declare `type: 'common'`, indicating that the type of chart we need to create is a combination chart.
+
+* As mentioned above, the chart is the manager that integrates and manages data, graphic elements, components, and layout elements. Logically, it consists of region + series + layout, and the bar and line correspond to the 'bar' and 'line' series types, respectively. By default, all series are associated with the same region, so we do not need to configure the region here.
+
+* Each series can have its own data source, or the data source can be directly configured on the chart. In the series, it is associated through `fromDataId` or `fromDataIndex`. In the current example, we choose to configure it on the chart.
+
+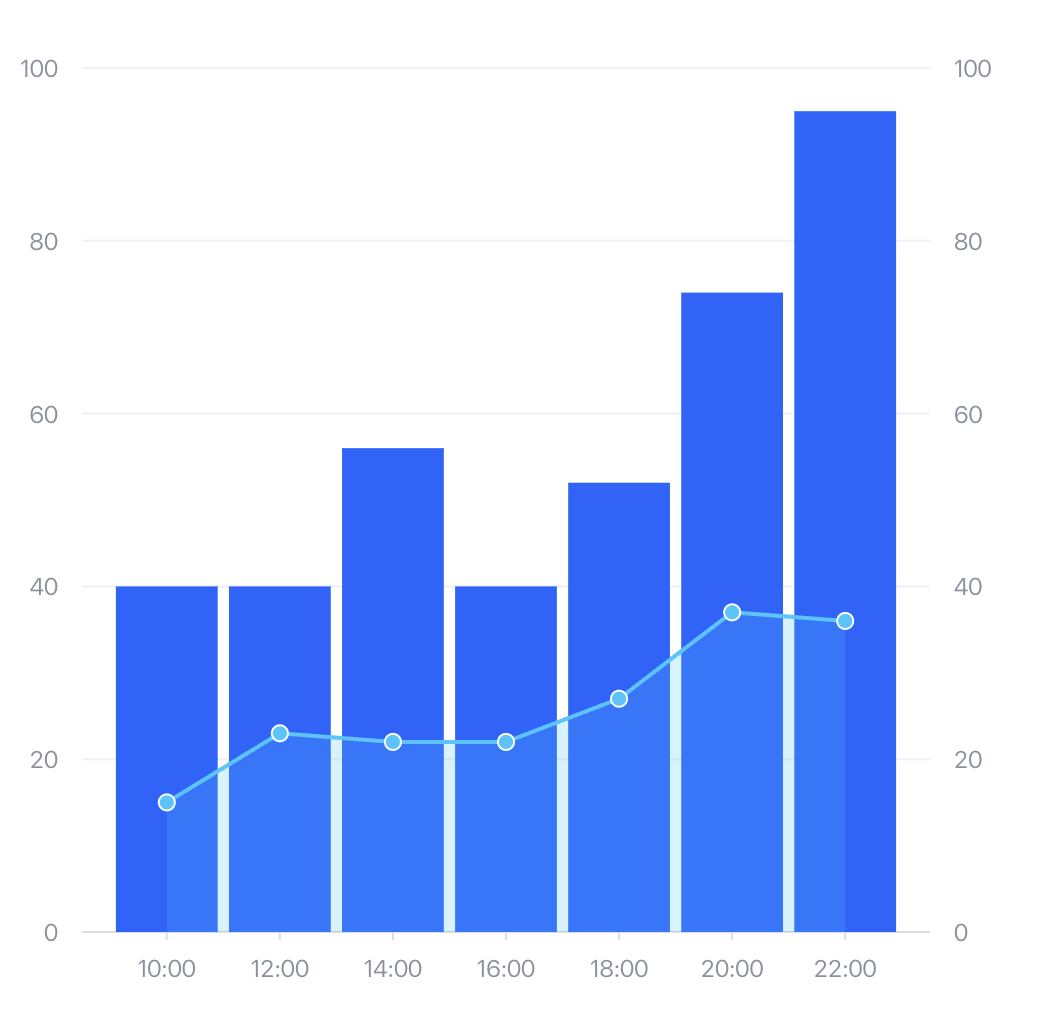 +
+As mentioned earlier, a region is a spatial information element that can be used in conjunction with layouts to divide the canvas into spatial sections using multiple differently positioned regions. At the same time, components can also specify relationships associated with regions. When a component is associated with multiple regions, it will by default collect the data dimensions of all subgraphs under the regions for display, as shown in the following example:
+
+
+
+As mentioned earlier, a region is a spatial information element that can be used in conjunction with layouts to divide the canvas into spatial sections using multiple differently positioned regions. At the same time, components can also specify relationships associated with regions. When a component is associated with multiple regions, it will by default collect the data dimensions of all subgraphs under the regions for display, as shown in the following example:
+
+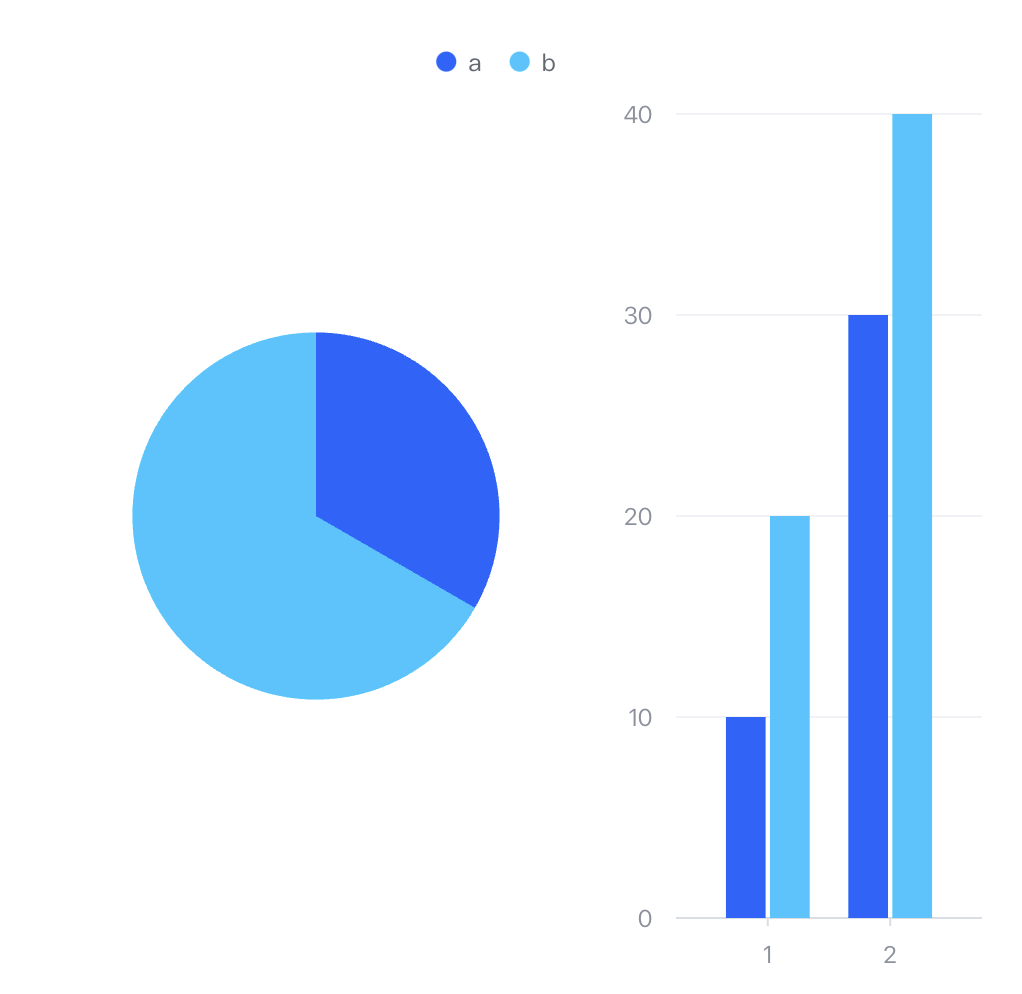 +
+### Primitive mark
+
+Primitives are the definition of graphics in the chart view layer. VChart defines primitives in charts, including basic primitives and composite primitives.
+
+Basic primitives include: symbol, rect, line, rule, arc, area, text, path, image, 3D rect, 3D arc, polygon, etc.
+
+Composite primitives are formed by combining multiple basic primitives. We collectively refer to basic primitives and composite primitives as primitives.
+
+Logical layer elements (such as series) are composed of several primitives. For example, the area chart (`'area'`) series includes points, lines, and areas, corresponding to the basic primitives: symbol, line, area.
+
+
+
+## What is tree-shaking
+
+
+
+Tree Shaking is a code optimization technique used to remove unused code (dead code) in JavaScript. This concept was first proposed by Rollup and later widely adopted by build tools such as Webpack.
+
+
+
+The implementation of Tree Shaking mainly relies on these features of ES Module:
+
+* Import and export statements can only be at the top level of the module
+
+* The names of imported and exported modules cannot be dynamic
+
+* Imported modules are immutable
+
+
+
+
+```javascript
+// 1. 导入导出语句只能在模块顶层
+import { foo } from './foo';
+export const bar = () => {};
+
+// 2. 导入导出的模块名字不能是动态的
+import { 'f' + 'oo' }; // 错误
+
+// 3. 导入的模块是不可变的
+import { foo } from './foo';
+foo = 'bar'; // 错误
+
+```
+The packaging tool constructs a module dependency graph during the marking phase based on the dependencies between files, analyzes import and export relationships, and removes unused exports during the packaging phase, retaining only the used code.
+
+
+
+
+```javascript
+// 1. 标记阶段
+// module.js
+export const foo = () => console.log('foo');
+export const bar = () => console.log('bar');
+
+// main.js
+import { foo } from './module';
+foo(); // foo被标记为使用
+// bar未被使用,标记为dead code
+
+// 2. 删除阶段
+// 打包后,bar函数被删除
+const foo = () => console.log('foo');
+foo();
+
+```
+When using Tree Shaking, the `sideEffects` configuration plays a crucial role in ensuring that unused code is correctly removed. In the project's `package.json` file, the `sideEffects` field is used to inform the bundler which files or modules have side effects, meaning they perform actions other than exporting values (such as modifying global state, executing initialization code, etc.). If a module has no side effects, the bundler can safely remove unreferenced parts.
+
+## The Principle of VChart On-Demand Loading
+
+Based on the above understanding of VChart chart composition and the concept of Tree Shaking, the core idea of VChart on-demand loading is to use Tree Shaking technology to only bundle the chart types, components, and graphic elements that the user actually uses, thereby reducing the package size. In the next chapter, we will detail some implementation specifics.
+
+
+
+
+
+# This document was revised and organized by the following personnel
+[玄魂](https://github.com/xuanhun)
\ No newline at end of file
diff --git a/docs/assets/contributing/en/sourcecode/13.2-vchart-on-demand-loading-source-code-analysis.md b/docs/assets/contributing/en/sourcecode/13.2-vchart-on-demand-loading-source-code-analysis.md
new file mode 100644
index 0000000000..8d39fd61ae
--- /dev/null
+++ b/docs/assets/contributing/en/sourcecode/13.2-vchart-on-demand-loading-source-code-analysis.md
@@ -0,0 +1,191 @@
+---
+title: 13.2 VChart On-Demand Loading Source Code Explanation
+
+key words: VisActor,VChart,VTable,VStrory,VMind,VGrammar,VRender,Visualization,Chart,Data,Table,Graph,Gis,LLM
+---
+Based on the previous articles, we have introduced the composition of VChart and the concept of Tree Shaking. Based on these two preliminary concepts, we will now elaborate on the specific implementation of VChart's on-demand loading.
+
+## Core Creation Process of VChart Charts
+
+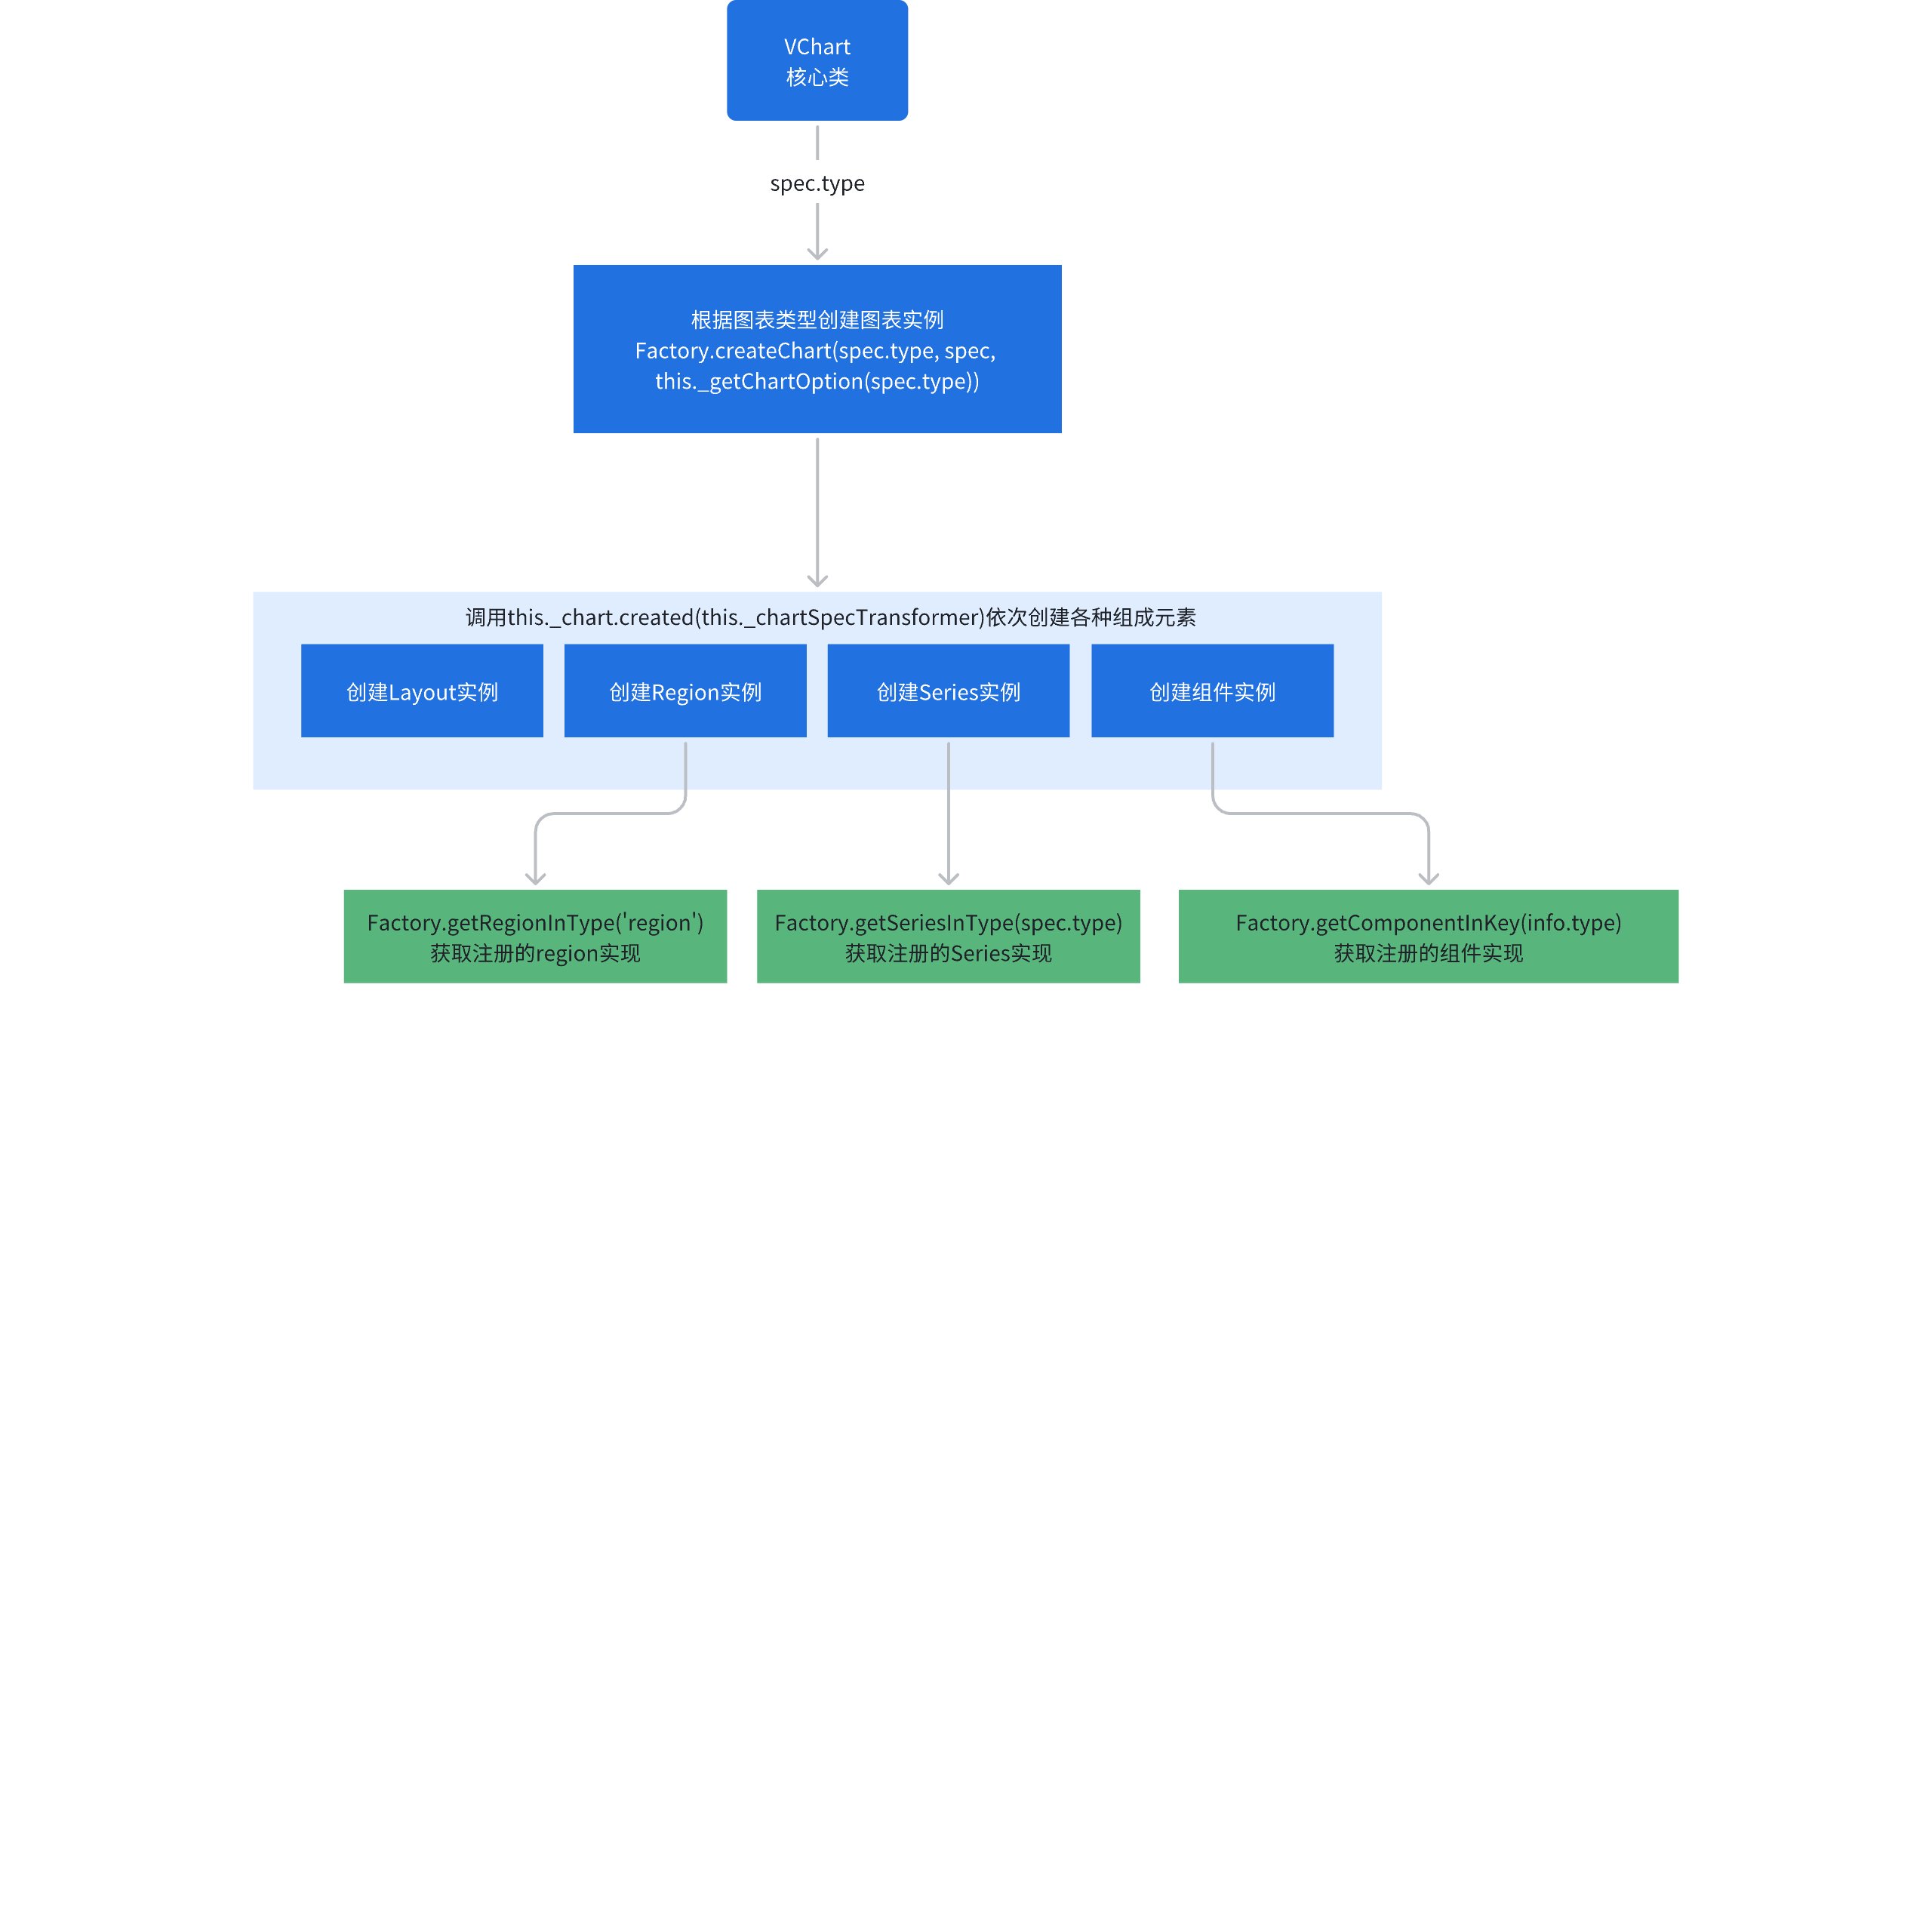
+
+
+
+## Factory
+
+The on-demand loading of VChart mainly relies on the `Factory` class to achieve this. This class plays an important role, responsible for registering and creating various charts, series, components, graphics, Regions, layouts, and plugins. Below, we will conduct an in-depth analysis from the aspects of the registration mechanism, creation mechanism, and on-demand registration of charts.
+
+### Registration Mechanism
+
+The `Factory` class provides a series of static methods for registering different types of modules. Through these methods, modules are registered into the static properties of `Factory`, thereby forming a registry. The specific code is as follows:
+
+```xml
+static registerChart(key: string, chart: IChartConstructor) {
+ Factory._charts[key] = chart;
+}
+static registerSeries(key: string, series: ISeriesConstructor) {
+ Factory._series[key] = series;
+}
+static registerComponent(key: string, cmp: IComponentConstructor, alwaysCheck?: boolean) {
+ Factory._components[key] = { cmp, alwaysCheck };
+}
+// 其他注册方法...
+
+```
+### Creation Mechanism
+
+The `Factory` class also provides a series of static methods for creating module instances as needed. These methods look up the corresponding constructor from the registry based on the type and create an instance. The sample code is as follows:
+
+
+```xml
+static createChart(chartType: string, spec: any, options: IChartOption): IChart | null {
+ if (!Factory._charts[chartType]) {
+ return null;
+ }
+ const ChartConstructor = Factory._charts[chartType];
+ return new ChartConstructor(spec, options);
+}
+static createSeries(seriesType: string, spec: any, options: ISeriesOption) {
+ if (!Factory._series[seriesType]) {
+ return null;
+ }
+ const SeriesConstructor = Factory._series[seriesType];
+ return new SeriesConstructor(spec, options);
+}
+// 其他创建方法...
+
+```
+### On-Demand Registration of Charts
+
+Taking the line chart as an example, let's look at the specific implementation of on-demand registration. In `packages/vchart/src/chart/line/line.ts`, there is the following code:
+
+
+```javascript
+export const registerLineChart = () => {
+ registerLineSeries();
+ Factory.registerChart(LineChart.type, LineChart);
+};
+
+```
+The `registerLineSeries` is implemented in `packages/vchart/src/series/line/line.ts`, the code is as follows:
+
+```javascript
+export const registerLineSeries = () => {
+ registerSampleTransform();
+ registerMarkOverlapTransform();
+ registerLineMark();
+ registerSymbolMark();
+ registerLineAnimation();
+ registerScaleInOutAnimation();
+ registerCartesianBandAxis();
+ registerCartesianLinearAxis();
+ Factory.registerSeries(LineSeries.type, LineSeries);
+};
+
+```
+By implementing the above code, when using VChart, if you call `registerLineChart` to register a line chart, it will automatically register the necessary elements such as the line series, line chart elements, and point chart elements that the line chart depends on. The specific usage is as follows:
+
+```xml
+import { VChart } from './core';
+import { registerLineChart } from './chart/line';
+VChart.useRegisters([
+ registerLineChart,
+ // 其他需要的模块
+]);
+
+```
+In `packages/vchart/src/core/vchart.ts`, the chart instance is not created by direct path reference, but by using `Factory.createChart`. In this way, the core class `vchart` can create instances based on the charts registered by the user without referencing all chart implementations. The relevant code is as follows:
+
+```xml
+private _initChart(spec: any) {
+ // ...
+ const chart = Factory.createChart(spec.type, spec, this._getChartOption(spec.type));
+ //...
+ }
+
+```
+## Core Class VChart On-Demand Loading
+
+Next, let's discuss a question: Is there a difference between the following two ways of referencing `VChart`?
+
+* Method One:
+
+
+```javascript
+import VChart from '@visactor/vchart';
+
+```
+* Method Two:
+
+```javascript
+import { VChart } from '@visactor/vchart';
+
+```
+The answer is yes, the effects produced by these two citation methods are different. Below is an analysis of the reasons for their differences.
+
+First, in the corresponding `package.json` of the vchart codebase, you can see the following configuration:
+
+```xml
+{
+ "sideEffects": [
+ "./*/index-lark.js",
+ "./*/index-wx-simple.js",
+ "./*/index-wx.js",
+ "./*/vchart-all.js",
+ "./*/vchart-simple.js"
+ ],
+}
+
+```
+The configuration explicitly declares all files with side effects.
+
+In `packages/vchart/index.ts`, the following exports are present:
+
+```xml
+import { VChart } from './vchart-all';
+export default VChart;
+export * from './core';
+
+```
+In the `core/index.ts` file, the following exports are present:
+
+```javascript
+import { VChart } from './vchart';
+export { VChart, Factory };
+
+```
+So method one is equivalent to the following reference, where the referenced VChart is the VChart class exported by vchart-all, and method two is equivalent to the VChart class exported from `core/vchart.ts`.
+
+```json
+import { default as VChart } from '@visactor/vchart';
+
+```
+The main purpose of the file `vchart-all.ts` is to register and export all functional modules of VChart:
+
+```json
+VChart.useRegisters([
+ // charts
+ registerLineChart,
+ registerAreaChart,
+ // ...其他图表
+ // components
+ registerCartesianLinearAxis,
+ registerCartesianBandAxis,
+ // ...其他组件
+ // layout
+ registerGridLayout,
+ registerLayout3d,
+ // mark
+ registerAllMarks,
+ // plugin
+ registerDomTooltipHandler,
+ registerCanvasTooltipHandler,
+ // ...其他插件
+]);
+export { VChart };
+
+```
+Since vchart - all is declared as a file with side effects, when VChart is referenced using method one, all files that vchart-all depends on will be packaged; whereas when VChart is referenced using method two, only core/vchart.ts will be packaged.
+
+# This document was revised and organized by the following personnel
+[玄魂](https://github.com/xuanhun)
\ No newline at end of file
diff --git a/docs/assets/contributing/en/sourcecode/14.1.1-react-vchart-introduction.md b/docs/assets/contributing/en/sourcecode/14.1.1-react-vchart-introduction.md
new file mode 100644
index 0000000000..8cb61864ee
--- /dev/null
+++ b/docs/assets/contributing/en/sourcecode/14.1.1-react-vchart-introduction.md
@@ -0,0 +1,134 @@
+---
+title: 14.1.1 Introduction to React-VChart
+
+key words: VisActor,VChart,VTable,VStrory,VMind,VGrammar,VRender,Visualization,Chart,Data,Table,Graph,Gis,LLM
+---
+## Overview
+
+react-vchart is the React wrapper version of VChart, mainly providing two styles of components externally:
+
+* `
+
+### Primitive mark
+
+Primitives are the definition of graphics in the chart view layer. VChart defines primitives in charts, including basic primitives and composite primitives.
+
+Basic primitives include: symbol, rect, line, rule, arc, area, text, path, image, 3D rect, 3D arc, polygon, etc.
+
+Composite primitives are formed by combining multiple basic primitives. We collectively refer to basic primitives and composite primitives as primitives.
+
+Logical layer elements (such as series) are composed of several primitives. For example, the area chart (`'area'`) series includes points, lines, and areas, corresponding to the basic primitives: symbol, line, area.
+
+
+
+## What is tree-shaking
+
+
+
+Tree Shaking is a code optimization technique used to remove unused code (dead code) in JavaScript. This concept was first proposed by Rollup and later widely adopted by build tools such as Webpack.
+
+
+
+The implementation of Tree Shaking mainly relies on these features of ES Module:
+
+* Import and export statements can only be at the top level of the module
+
+* The names of imported and exported modules cannot be dynamic
+
+* Imported modules are immutable
+
+
+
+
+```javascript
+// 1. 导入导出语句只能在模块顶层
+import { foo } from './foo';
+export const bar = () => {};
+
+// 2. 导入导出的模块名字不能是动态的
+import { 'f' + 'oo' }; // 错误
+
+// 3. 导入的模块是不可变的
+import { foo } from './foo';
+foo = 'bar'; // 错误
+
+```
+The packaging tool constructs a module dependency graph during the marking phase based on the dependencies between files, analyzes import and export relationships, and removes unused exports during the packaging phase, retaining only the used code.
+
+
+
+
+```javascript
+// 1. 标记阶段
+// module.js
+export const foo = () => console.log('foo');
+export const bar = () => console.log('bar');
+
+// main.js
+import { foo } from './module';
+foo(); // foo被标记为使用
+// bar未被使用,标记为dead code
+
+// 2. 删除阶段
+// 打包后,bar函数被删除
+const foo = () => console.log('foo');
+foo();
+
+```
+When using Tree Shaking, the `sideEffects` configuration plays a crucial role in ensuring that unused code is correctly removed. In the project's `package.json` file, the `sideEffects` field is used to inform the bundler which files or modules have side effects, meaning they perform actions other than exporting values (such as modifying global state, executing initialization code, etc.). If a module has no side effects, the bundler can safely remove unreferenced parts.
+
+## The Principle of VChart On-Demand Loading
+
+Based on the above understanding of VChart chart composition and the concept of Tree Shaking, the core idea of VChart on-demand loading is to use Tree Shaking technology to only bundle the chart types, components, and graphic elements that the user actually uses, thereby reducing the package size. In the next chapter, we will detail some implementation specifics.
+
+
+
+
+
+# This document was revised and organized by the following personnel
+[玄魂](https://github.com/xuanhun)
\ No newline at end of file
diff --git a/docs/assets/contributing/en/sourcecode/13.2-vchart-on-demand-loading-source-code-analysis.md b/docs/assets/contributing/en/sourcecode/13.2-vchart-on-demand-loading-source-code-analysis.md
new file mode 100644
index 0000000000..8d39fd61ae
--- /dev/null
+++ b/docs/assets/contributing/en/sourcecode/13.2-vchart-on-demand-loading-source-code-analysis.md
@@ -0,0 +1,191 @@
+---
+title: 13.2 VChart On-Demand Loading Source Code Explanation
+
+key words: VisActor,VChart,VTable,VStrory,VMind,VGrammar,VRender,Visualization,Chart,Data,Table,Graph,Gis,LLM
+---
+Based on the previous articles, we have introduced the composition of VChart and the concept of Tree Shaking. Based on these two preliminary concepts, we will now elaborate on the specific implementation of VChart's on-demand loading.
+
+## Core Creation Process of VChart Charts
+
+
+
+
+
+## Factory
+
+The on-demand loading of VChart mainly relies on the `Factory` class to achieve this. This class plays an important role, responsible for registering and creating various charts, series, components, graphics, Regions, layouts, and plugins. Below, we will conduct an in-depth analysis from the aspects of the registration mechanism, creation mechanism, and on-demand registration of charts.
+
+### Registration Mechanism
+
+The `Factory` class provides a series of static methods for registering different types of modules. Through these methods, modules are registered into the static properties of `Factory`, thereby forming a registry. The specific code is as follows:
+
+```xml
+static registerChart(key: string, chart: IChartConstructor) {
+ Factory._charts[key] = chart;
+}
+static registerSeries(key: string, series: ISeriesConstructor) {
+ Factory._series[key] = series;
+}
+static registerComponent(key: string, cmp: IComponentConstructor, alwaysCheck?: boolean) {
+ Factory._components[key] = { cmp, alwaysCheck };
+}
+// 其他注册方法...
+
+```
+### Creation Mechanism
+
+The `Factory` class also provides a series of static methods for creating module instances as needed. These methods look up the corresponding constructor from the registry based on the type and create an instance. The sample code is as follows:
+
+
+```xml
+static createChart(chartType: string, spec: any, options: IChartOption): IChart | null {
+ if (!Factory._charts[chartType]) {
+ return null;
+ }
+ const ChartConstructor = Factory._charts[chartType];
+ return new ChartConstructor(spec, options);
+}
+static createSeries(seriesType: string, spec: any, options: ISeriesOption) {
+ if (!Factory._series[seriesType]) {
+ return null;
+ }
+ const SeriesConstructor = Factory._series[seriesType];
+ return new SeriesConstructor(spec, options);
+}
+// 其他创建方法...
+
+```
+### On-Demand Registration of Charts
+
+Taking the line chart as an example, let's look at the specific implementation of on-demand registration. In `packages/vchart/src/chart/line/line.ts`, there is the following code:
+
+
+```javascript
+export const registerLineChart = () => {
+ registerLineSeries();
+ Factory.registerChart(LineChart.type, LineChart);
+};
+
+```
+The `registerLineSeries` is implemented in `packages/vchart/src/series/line/line.ts`, the code is as follows:
+
+```javascript
+export const registerLineSeries = () => {
+ registerSampleTransform();
+ registerMarkOverlapTransform();
+ registerLineMark();
+ registerSymbolMark();
+ registerLineAnimation();
+ registerScaleInOutAnimation();
+ registerCartesianBandAxis();
+ registerCartesianLinearAxis();
+ Factory.registerSeries(LineSeries.type, LineSeries);
+};
+
+```
+By implementing the above code, when using VChart, if you call `registerLineChart` to register a line chart, it will automatically register the necessary elements such as the line series, line chart elements, and point chart elements that the line chart depends on. The specific usage is as follows:
+
+```xml
+import { VChart } from './core';
+import { registerLineChart } from './chart/line';
+VChart.useRegisters([
+ registerLineChart,
+ // 其他需要的模块
+]);
+
+```
+In `packages/vchart/src/core/vchart.ts`, the chart instance is not created by direct path reference, but by using `Factory.createChart`. In this way, the core class `vchart` can create instances based on the charts registered by the user without referencing all chart implementations. The relevant code is as follows:
+
+```xml
+private _initChart(spec: any) {
+ // ...
+ const chart = Factory.createChart(spec.type, spec, this._getChartOption(spec.type));
+ //...
+ }
+
+```
+## Core Class VChart On-Demand Loading
+
+Next, let's discuss a question: Is there a difference between the following two ways of referencing `VChart`?
+
+* Method One:
+
+
+```javascript
+import VChart from '@visactor/vchart';
+
+```
+* Method Two:
+
+```javascript
+import { VChart } from '@visactor/vchart';
+
+```
+The answer is yes, the effects produced by these two citation methods are different. Below is an analysis of the reasons for their differences.
+
+First, in the corresponding `package.json` of the vchart codebase, you can see the following configuration:
+
+```xml
+{
+ "sideEffects": [
+ "./*/index-lark.js",
+ "./*/index-wx-simple.js",
+ "./*/index-wx.js",
+ "./*/vchart-all.js",
+ "./*/vchart-simple.js"
+ ],
+}
+
+```
+The configuration explicitly declares all files with side effects.
+
+In `packages/vchart/index.ts`, the following exports are present:
+
+```xml
+import { VChart } from './vchart-all';
+export default VChart;
+export * from './core';
+
+```
+In the `core/index.ts` file, the following exports are present:
+
+```javascript
+import { VChart } from './vchart';
+export { VChart, Factory };
+
+```
+So method one is equivalent to the following reference, where the referenced VChart is the VChart class exported by vchart-all, and method two is equivalent to the VChart class exported from `core/vchart.ts`.
+
+```json
+import { default as VChart } from '@visactor/vchart';
+
+```
+The main purpose of the file `vchart-all.ts` is to register and export all functional modules of VChart:
+
+```json
+VChart.useRegisters([
+ // charts
+ registerLineChart,
+ registerAreaChart,
+ // ...其他图表
+ // components
+ registerCartesianLinearAxis,
+ registerCartesianBandAxis,
+ // ...其他组件
+ // layout
+ registerGridLayout,
+ registerLayout3d,
+ // mark
+ registerAllMarks,
+ // plugin
+ registerDomTooltipHandler,
+ registerCanvasTooltipHandler,
+ // ...其他插件
+]);
+export { VChart };
+
+```
+Since vchart - all is declared as a file with side effects, when VChart is referenced using method one, all files that vchart-all depends on will be packaged; whereas when VChart is referenced using method two, only core/vchart.ts will be packaged.
+
+# This document was revised and organized by the following personnel
+[玄魂](https://github.com/xuanhun)
\ No newline at end of file
diff --git a/docs/assets/contributing/en/sourcecode/14.1.1-react-vchart-introduction.md b/docs/assets/contributing/en/sourcecode/14.1.1-react-vchart-introduction.md
new file mode 100644
index 0000000000..8cb61864ee
--- /dev/null
+++ b/docs/assets/contributing/en/sourcecode/14.1.1-react-vchart-introduction.md
@@ -0,0 +1,134 @@
+---
+title: 14.1.1 Introduction to React-VChart
+
+key words: VisActor,VChart,VTable,VStrory,VMind,VGrammar,VRender,Visualization,Chart,Data,Table,Graph,Gis,LLM
+---
+## Overview
+
+react-vchart is the React wrapper version of VChart, mainly providing two styles of components externally:
+
+* `('VChart', {
+ vchartConstrouctor: VChartCore
+});
+
+```
+This code is relatively simple and includes the following content:
+
+1. Use the `createChart` factory function to create a component
+
+2. Specify the component name as `VChart`
+
+3. Inject the `VChartCore` constructor
+
+
+
+### 1.2 Basic Chart Implementation (BaseChart.tsx)
+
+
+
+#### 1.2.1 State Management
+
+
+```Typescript
+const [updateId, setUpdateId] = useState(0);
+const chartContext = useRef({});
+const [view, setView] = useState(null);
+const isUnmount = useRef(false);
+
+```
+
+
+Key States:
+
+* `updateId`: Used to control the update of subcomponents.
+
+* `chartContext`: Used to store chart instances.
+
+* `view`: Used to store view instances.
+
+* `isUnmount`: Used to control the unmount state of the component.
+
+#### 1.2.2 Spec Parsing System
+
+```xml
+const parseSpec = (props: Props) => {
+ let spec: ISpec;
+ // 1. 处理直接传入的 spec
+ if (hasSpec && props.spec) {
+ spec = props.spec;
+ if (isValid(props.data)) {
+ spec = {
+ ...props.spec,
+ data: props.data
+ };
+ }
+ }
+ // 2. 处理从子组件收集的 spec
+ else {
+ spec = {
+ ...prevSpec.current,
+ ...specFromChildren.current
+ };
+ }
+ // 3. 处理 tooltip
+ const tooltipSpec = initCustomTooltip(setTooltipNode, props, spec.tooltip);
+ if (tooltipSpec) {
+ spec.tooltip = tooltipSpec;
+ }
+ return spec;
+};
+
+```
+The Spec parsing system includes three levels:
+
+1. Directly passed spec configuration.
+
+2. Aggregation of subcomponent configurations.
+
+3. Handling of special components (such as tooltip).
+
+#### 1.2.3 Subcomponent Parsing System
+
+
+```xml
+const parseSpecFromChildren = (props: Props) => {
+ const specFromChildren: Omit = {};
+ toArray(props.children).map((child, index) => {
+ const parseSpec = child?.type?.parseSpec;
+ if (parseSpec && child.props) {
+ // 处理子组件配置...
+ const specResult = parseSpec(childProps);
+ // 处理单例和数组配置
+ if (specResult.isSingle) {
+ specFromChildren[specResult.specName] = specResult.spec;
+ } else {
+ if (!specFromChildren[specResult.specName]) {
+ specFromChildren[specResult.specName] = [];
+ }
+ specFromChildren[specResult.specName].push(specResult.spec);
+ }
+ }
+ });
+ return specFromChildren;
+};
+
+```
+The responsibilities of the system include:
+
+1. Collecting configurations of all sub-components.
+
+2. Distinguishing between singleton and array types of configurations.
+
+3. Generating the final configuration object.
+
+#### 1.2.4 Update Mechanism
+
+```xml
+useEffect(() => {
+ // 1. 首次渲染
+ if (!chartContext.current?.chart) {
+ createChart(props);
+ renderChart();
+ return;
+ }
+ // 2. spec 更新
+ if (hasSpec) {
+ if (!isEqual(eventsBinded.current.spec, props.spec)) {
+ chartContext.current.chart.updateSpecSync(parseSpec(props));
+ handleChartRender(true);
+ }
+ // 3. 数据更新
+ else if (eventsBinded.current.data!== props.data) {
+ chartContext.current.chart.updateFullDataSync(props.data);
+ handleChartRender(true);
+ }
+ return;
+ }
+ // 4. 子组件更新
+ const newSpec = pickWithout(props, notSpecKeys);
+ if (!isEqual(newSpec, prevSpec.current)) {
+ // 更新处理...
+ }
+}, [props]);
+
+```
+The update mechanism covers the following four scenarios:
+
+1. Initial rendering
+
+2. Spec configuration update
+
+3. Data update
+
+4. Updates caused by subcomponents
+
+#### 1.2.4 Lifecycle Management
+
+
+```xml
+useEffect(() => {
+ return () => {
+ if (chartContext.current?.chart) {
+ chartContext.current.chart.release();
+ chartContext.current.chart = null;
+ }
+ eventsBinded.current = null;
+ isUnmount.current = true;
+ };
+}, []);
+
+```
+When the component is destroyed, ensure that resources can be released, including:
+
+* Release chart instances
+
+* Clean up event bindings
+
+* Update component status
+
+## Implementation of BaseComponent
+
+### 2.1 Core Implementation Mechanism
+
+In the react-vchart framework, the creation of all components relies on the `createComponent` factory function. The definition of this function is as follows:
+
+```xml
+const createComponent = (
+ componentName: string, // 组件名
+ specName: string, // 规格名称
+ supportedEvents?: Record, // 支持的事件
+ isSingle?: boolean, // 是否单例
+ registers?: (() => void)[] // 注册器
+): any => {
+ // ...组件创建逻辑
+};
+
+```
+Here, the generic `T extends ComponentProps` is used to constrain the type of component properties passed in. The function receives multiple parameters:
+
+* `componentName`: Used to identify the name of the component, which is unique throughout the application, making it easy for developers to recognize and manage components.
+
+* `specName`: Represents the specification name corresponding to the component, which is very important for configuration collection and management. Different components are distinguished by different specification names for their respective configurations.
+
+* `supportedEvents`: An optional object used to define the events supported by the component. The key-value pair form of the object represents the event type and the corresponding event handling logic. For example, a component may support the `click` event and define the corresponding handler function.
+
+* `isSingle`: A boolean value used to indicate whether the component is in singleton mode. If `true`, it means that there will only be one instance of the component in the entire application; if `false`, multiple instances can be created.
+
+* `registers`: An array of functions, each used to perform specific registration operations. These registration operations may include registering specific functions or plugins of the component into the framework.
+
+To understand more intuitively, the following shows the encapsulation code using the axis component and legend component as examples:
+
+* **Axis**
+
+```xml
+export const Axis = createComponent('Axis', 'axes');
+
+```
+Here, a coordinate axis component named `Axis` is created, the component name is `Axis`, and the corresponding specification name is `axes`. In this way, the framework can accurately identify and handle the relevant configurations and operations of the coordinate axis component.
+
+* **Legend**
+
+```xml
+export const Legend = createComponent(
+ 'Legend',
+ 'legends',
+ LEGEND_CUSTOMIZED_EVENTS,
+ false,
+ [registerDiscreteLegend]
+);
+
+```
+This code creates a `Legend` component, with the component name being `Legend` and the specification name being `legends`. It also specifies the custom events supported by this component `LEGEND_CUSTOMIZED_EVENTS`, and the component is not in singleton mode (`false`). Finally, a registrar function `registerDiscreteLegend` is passed in to perform specific registration operations, which may be to register discrete data-related functions for the legend component.
+
+### 2.2 Component Communication Mechanism
+
+#### 2.2.1 Context Communication
+
+
+```xml
+const Comp: React.FC = (props: T) => {
+ const context = useContext(RootChartContext);
+ // ...
+};
+
+```
+In a React application, communication between components is an important issue. Here, the `useContext` hook function is used to achieve communication between components. `RootChartContext` is a context object that contains information related to charts, such as chart instances, global configurations, etc. By using `useContext(RootChartContext)`, components can access this global information to achieve data sharing and interaction between components. For example, a child component may need to obtain the global configuration information of the chart to adjust its display mode, and it can obtain context information in this way.
+
+#### 2.2.2 Event System
+
+
+```xml
+// 事件绑定
+if (supportedEvents) {
+ bindEventsToChart(
+ context.chart,
+ props,
+ eventsBinded.current,
+ supportedEvents
+ );
+}
+
+```
+This part of the code implements the event binding functionality of the component. When the component defines `supportedEvents` (i.e., supported events), the `bindEventsToChart` function is called to bind events. This function receives four parameters:
+
+* `context.chart`: Represents the chart instance, obtained through the context. Events are bound to this chart instance so that the handling logic can be triggered when the chart experiences corresponding events.
+
+* `props`: The properties of the component, which may include configuration information related to events, such as event handler functions.
+
+* `eventsBinded.current`: Possibly an object or variable that stores the events that have already been bound, used to record the currently bound events to avoid duplicate bindings.
+
+* `supportedEvents`: The aforementioned object of events supported by the component, containing the mapping relationship between event types and handler functions. In this way, the component can interact with the chart instance to achieve the association between user operations and component behavior.
+
+### 2.3 Configuration Collection Mechanism
+
+Each component implements the `parseSpec` method to parse the configuration corresponding to the component, ultimately assembling it into the complete `spec` required by vchart:
+
+
+```xml
+Comp.parseSpec = (props: T) => {
+ return {
+ spec: pickWithout(props, notSpecKeys),
+ specName,
+ isSingle
+ };
+};
+
+```
+`parseSpec` method plays a key role in component configuration management. It receives the component's `props` as a parameter and returns an object containing three attributes:
+
+* `spec`: The component configuration obtained through the `pickWithout(props, notSpecKeys)` method. The `pickWithout` function might be a custom function used to filter out the required configuration information from `props`, excluding unnecessary keys (`notSpecKeys`). This configuration information will be used as the actual configuration for the component in vchart.
+
+* `specName`: The aforementioned component specification name, used to identify the type of component configuration, facilitating differentiation and management in the overall configuration.
+
+* `isSingle`: A boolean value indicating whether the component is in singleton mode. This information is also crucial in the process of configuration assembly and management, for example, when handling multiple component configurations, it is necessary to decide how to merge configurations based on the value of `isSingle`. By implementing the `parseSpec` method for each component, the framework can collect the configuration information of each component and ultimately assemble it into a complete configuration `spec` that meets vchart requirements.
+
+### 2.4 Component Registration Mechanism
+
+
+```xml
+if (registers && registers.length) {
+ VChart.useRegisters(registers);
+}
+
+```
+This part of the code implements the component registration mechanism. When a component defines `registers` (i.e., an array of registrars) and the array is not empty, the `VChart.useRegisters(registers)` method is called. `VChart` may be a global chart object or a framework core object, and the `useRegisters` method is used to register functions from the registrar array into the framework. These registrar functions may be used to register specific features, plugins, or integrations with other modules for the component. In this way, the component can register some of its special features or configurations into the framework to function throughout the application.
+
+### 2.5 Configuration Filtering
+
+
+```xml
+const notSpecKeys = supportedEvents
+ ? Object.keys(supportedEvents).concat(ignoreKeys)
+ : ignoreKeys;
+
+```
+This code implements the configuration filtering function. The `notSpecKeys` variable is used to store unwanted configuration keys. If the component defines `supportedEvents` (i.e., supported events), then `notSpecKeys` is formed by merging all keys of `supportedEvents` with `ignoreKeys`; otherwise, `notSpecKeys` is directly equal to `ignoreKeys`. `ignoreKeys` may be a predefined array containing some keys that need to be ignored during the configuration parsing process. In this way, during the configuration collection and parsing process, unwanted configuration information can be excluded, ensuring that the final configuration `spec` only contains useful information, thereby improving the accuracy and effectiveness of the configuration.
+
+### 2.6 Update Control
+
+
+```xml
+if (props.updateId!== updateId.current) {
+ updateId.current = props.updateId;
+ // 处理更新逻辑...
+}
+
+```
+This part of the code implements the update control of the component. `updateId` is an identifier used to control component updates. When the `props.updateId` received by the component is not equal to the currently stored `updateId.current`, it indicates that an update has occurred. At this point, `updateId.current` is updated to `props.updateId`, and then the subsequent update logic is executed (indicated in the code by the comment `// Handle update logic...`). This update control mechanism ensures that when the component receives a new update identifier, it can correctly handle update operations, such as re-rendering the component, updating data, or performing specific update tasks, thereby ensuring that the component's state remains consistent with the latest requirements.
+
+## Implementation of BaseSeries
+
+The series components of React-VChart are also mainly implemented using higher-order components. The following will provide a more detailed analysis of its core implementation.
+
+### 3.1 Series Component Creator
+
+```xml
+export const createSeries = (
+ componentName: string, // 组件名称
+ markNames: string[], // 图形标记名称
+ type?: string, // 图表类型
+ registers?: (() => void)[] // 注册函数
+) => {
+ //...
+}
+
+```
+This factory function plays a core role in the creation process of the entire series of components. It strictly constrains the type of component properties passed in through the generic `\u003CT extends BaseSeriesProps\u003E`, ensuring type safety.
+
+The parameters received by the function have their own important responsibilities:
+
+* `componentName`: Serves as the unique identifier of the component, having uniqueness throughout the application. This makes it more convenient for developers to manage and identify components, just like giving each component a unique "name tag".
+
+* `markNames`: An array of series element names used to determine the elements used by the component.
+
+* `type`: The chart type, although an optional parameter, clarifies the chart type corresponding to the component.
+
+* `registers`: Declares the resources that the series needs to register, used for on-demand loading through tree-shaking to achieve package size optimization.
+
+### 3.2 Area Component Implementation
+
+```xml
+export type AreaProps = BaseSeriesProps & Omit;
+export const Area = createSeries(
+ 'Area', // 组件名
+ ['area'], // 图形标记
+ 'area', // 类型
+ [registerAreaSeries] // 注册器
+);
+
+```
+`Area` 组件的定义首先通过 `export type AreaProps = BaseSeriesProps & Omit` 来定义其属性类型。它结合了 `BaseSeriesProps` 和 `IAreaSeriesSpec`,并通过 `Omit` 操作排除了 `'type'` 属性,这是因为在创建组件时,类型已经通过 `createSeries` 函数的参数进行了指定。
+
+然后,通过 `createSeries` 函数创建 `Area` 组件。传入的参数分别为组件名 `'Area'`、图形标记 `['area']`、图表类型 `'area'` 以及注册器 `[registerAreaSeries]`。注册器 `registerAreaSeries` 用于执行与面积图相关的特定注册操作,可能包括注册面积图的样式、动画效果等。
+
+### 3.3 核心功能实现
+
+* **标记 ID 管理**
+
+```xml
+const addMarkId = (spec: any, seriesId: string | number) => {
+ markNames.forEach(markName => {
+ const defaultMarkId = `${seriesId}-${markName}`;
+ if (isNil(spec[markName])) {
+ spec[markName] = { id: defaultMarkId };
+ } else if (isNil(spec[markName].id)) {
+ spec[markName].id = defaultMarkId;
+ }
+ });
+};
+
+```
+In the process of chart rendering, each graphic mark needs to have a unique identifier, which is the role of mark ID management. The `addMarkId` function receives `spec` (configuration object) and `seriesId` (series ID) as parameters.
+
+The function generates a default `markId` for each graphic mark by traversing the `markNames` array. The generation rule is to concatenate `seriesId` and `markName` with `-`, for example, `'series1-area'`.
+
+If a property corresponding to a `markName` does not exist in `spec`, an object containing the default `markId` is created; if the `markName` property exists but `id` does not, the default `markId` is set for it. This ensures that each graphic mark has a unique identifier, facilitating subsequent event handling and style setting operations.
+
+* **Event Handling System**
+
+```xml
+const handleEvent = (e: any) => {
+ const markIds = markNames.map(markName =>
+ `${id}-${markName}`
+ );
+ if (e?.mark && markIds.includes(e.mark.getUserId())) {
+ props[VCHART_TO_REACT_EVENTS[e.event.type]](e);
+ }
+};
+
+```
+The event handling system is responsible for processing user interactions with the chart. The `handleEvent` function receives an event object `e`.
+
+First, generate all possible `markId` arrays `markIds` through the `markNames` array. Then check whether the `mark` in the event object `e` exists and whether the user ID of `mark` is in the `markIds` array.
+
+If the conditions are met, it indicates that the event is triggered by the graphic mark of the current component. Then, find the corresponding event handler through `props[VCHART_TO_REACT_EVENTS[e.event.type]]` and pass the event object `e` into it to perform the corresponding operation. `VCHART_TO_REACT_EVENTS` is a mapping table used to map VChart's event types to React component's event handlers.
+
+* **Configuration Parsing**
+
+```xml
+Comp.parseSpec = (compProps: T) => {
+ const newSeriesSpec = pickWithout(compProps, notSpecKeys);
+ // 添加标记 ID
+ addMarkId(newSeriesSpec, compProps.id?? compProps.componentId);
+ // 设置类型
+ if (!isNil(type)) {
+ newSeriesSpec.type = type;
+ }
+ return {
+ spec: newSeriesSpec,
+ specName:'series'
+ };
+};
+
+```
+The configuration parsing function `Comp.parseSpec` is responsible for parsing the component's properties into a configuration object that meets the requirements of VChart.
+
+First, the function `pickWithout(compProps, notSpecKeys)` is used to filter out the required configuration information from `compProps`, excluding unnecessary keys `notSpecKeys`. `notSpecKeys` may contain some properties unrelated to event handling or other aspects, ensuring the purity of the configuration object in this way.
+
+Then, the `addMarkId` function is called to add a mark ID to the new series configuration `newSeriesSpec`, ensuring that each graphic mark has a unique identifier.
+
+Next, if the `type` parameter is not empty, the chart type is set in `newSeriesSpec`.
+
+Finally, an object containing `spec` (the parsed configuration object) and `specName` (the configuration type name, here as `'series'`) is returned. This object will be passed to VChart for rendering as the final configuration.
+
+Through the detailed analysis above, we have gained a deeper understanding of the implementation principles of the React-VChart series components, including component creation, property definition, and the implementation of core functions. These technical principles provide a solid foundation for developers when using and extending React-VChart.
+
+
+# This document was revised and organized by the following personnel
+[玄魂](https://github.com/xuanhun)
\ No newline at end of file
diff --git a/docs/assets/contributing/en/sourcecode/14.2.1-taro-vchart-introduction.md b/docs/assets/contributing/en/sourcecode/14.2.1-taro-vchart-introduction.md
new file mode 100644
index 0000000000..459761ee90
--- /dev/null
+++ b/docs/assets/contributing/en/sourcecode/14.2.1-taro-vchart-introduction.md
@@ -0,0 +1,104 @@
+---
+title: 14.2.1 Taro-VChart Introduction
+
+key words: VisActor,VChart,VTable,VStrory,VMind,VGrammar,VRender,Visualization,Chart,Data,Table,Graph,Gis,LLM
+---
+## Overview
+
+taro-vchart is the Taro mini program encapsulation version of VChart, providing an encapsulation of the VChart React version in the Taro environment.
+
+* For more information about the Taro mini program host environment, please refer to the official documentation: https://docs.taro.zone/docs/
+
+## Core Code Structure
+
+taro-vchart's directory and architecture correspond to:
+
+* Chart Factory Layer: `charts` directory
+
+Using the factory pattern to uniformly generate chart components (such as `BoxPlotChart`), which includes all available chart type components. Each chart is created through the createChart method with standardized parameters:
+
+
+```xml
+export const Chart = createChart(
+ 'ChartName',
+ { chartConstructor: VChart }, // 核心图表构造器
+ [registerModules] // 按需注册的图表模块
+);
+
+```
+* Cross-platform adaptation layer: The `components` directory implements the core logic for cross-platform rendering, including a general chart component and a browser chart component, with consistent functionality mainly to address different platforms.
+
+* General chart component `general-chart/index.tsx`
+
+```Typescript
+export class GeneralChart extends React.Component {
+ // 小程序专用生命周期
+ async componentDidMount() {
+ // 通过循环最多尝试100次获取DOM节点(解决飞书小程序异步问题)
+ for (let i = 0; i < MAX_TIMES; i++) {
+ const domref = await getDomRef();
+ this.init({ domref });
+ }
+ }
+
+ // 小程序专用渲染结构
+ render() {
+ return (
+
+ {/* 交互事件画布 */}
+ {/* 主渲染画布 */}
+ {/* 辅助画布 */}
+
+ )
+ }
+}
+
+```
+* Browser chart component `web-chart/index.tsx`
+
+```xml
+export class WebChart extends React.Component {
+ // 标准浏览器生命周期
+ componentDidMount() {
+ this.vchart = new chartConstructor(spec, {
+ dom: canvasId // 直接使用DOM容器
+ });
+ }
+
+ // 简单DOM结构
+ render() {
+ return
#### Animation Flowchart
+
#### Process Description
+1. **Create Chart Configuration and Data**: Define initial chart configuration and data.
+1. **Create VChart Instance**: Create a VChart instance using the configuration and DOM container.
+1. **Render Chart**: Call the `renderAsync` method to render the chart, triggering the animation entrance effect.
+1. **Animation Entrance**: Automatically trigger entrance animation after the chart is rendered.
+1. **Data Update (Add Elements)**: Add data using the `updateDataSync` method, triggering add animation.
+1. **Data Update (Update Elements)**: Update data using the `updateDataSync` method, triggering update animation.
+1. **Data Update (Remove Elements)**: Remove data using the `updateDataSync` method, triggering exit animation.
+1. **Use of Element State**: Update element state using the `updateState` method, setting styles under specific conditions.
+1. **Chart Exit**: Destroy the chart instance using the `release` method, exiting the chart.
+
+
+
+
+
+```xml
+/**
+ * 自1.12.0后,全局形变动画需要手动注册才能生效
+ *
+ * import { registerMorph } from '@visactor/vchart';
+ *
+ * registerMorph();
+ */
+
+VCHART_MODULE.registerMorph();
+
+const pieSpec = {
+ type: 'pie',
+ data: [
+ {
+ values: [
+ { type: '1', value: Math.random() },
+ { type: '2', value: Math.random() },
+ { type: '3', value: Math.random() }
+ ]
+ }
+ ],
+ outerRadius: 0.8,
+ innerRadius: 0.6,
+ valueField: 'value',
+ categoryField: 'type',
+ tooltip: false
+};
+
+const barSpec = Object.assign({}, pieSpec, {
+ type: 'bar',
+ xField: 'type',
+ yField: 'value',
+ seriesField: 'type'
+});
+
+const specs = [pieSpec, barSpec];
+
+const vchart = new VChart(specs[0], { dom: CONTAINER_ID });
+
+vchart.renderSync();
+let count = 1;
+setInterval(() => {
+ vchart.updateSpec(specs[count % 2]);
+ count++;
+}, 2000);
+
+
+```
+
+#### One-to-Many Animation
+
+One-to-many animation refers to the transition of a single graphic element into multiple graphic elements. For example, in the example below, a global animation is shown when switching between a bar chart and a scatter plot, where the animation of splitting a large bar into multiple scatter points is a one-to-many animation.
+
+
+
+
+```javascript
+/**
+ * 自1.12.0后,全局形变动画需要手动注册才能生效
+ *
+ * import { registerMorph } from '@visactor/vchart';
+ *
+ * registerMorph();
+ */
+
+VCHART_MODULE.registerMorph();
+
+function calculateAverage(data, dim) {
+ let total = 0;
+ for (let i = 0; i < data.length; i++) {
+ total += data[i][dim];
+ }
+ return (total /= data.length);
+}
+
+function generateData(type) {
+ const data = [];
+ for (let i = 0; i < 10; i++) {
+ data.push({ x: i, y: Math.random(), type });
+ }
+ return data;
+}
+const DataA = generateData('A');
+
+const DataB = generateData('B');
+
+const barSpec = {
+ type: 'common',
+ series: [
+ {
+ type: 'bar',
+ data: { values: [{ value: calculateAverage(DataA, 'y'), type: 'A' }] },
+ xField: 'type',
+ yField: 'value',
+ morph: {
+ morphKey: 'A'
+ }
+ },
+ {
+ type: 'bar',
+ data: { values: [{ value: calculateAverage(DataB, 'y'), type: 'B' }] },
+ xField: 'type',
+ yField: 'value',
+ morph: {
+ morphKey: 'B'
+ }
+ }
+ ],
+ axes: [
+ { orient: 'left', type: 'linear', max: 1 },
+ { orient: 'bottom', type: 'band' }
+ ]
+};
+
+const scatterSpec = {
+ type: 'common',
+ series: [
+ {
+ type: 'scatter',
+ data: { values: DataA },
+ xField: 'x',
+ yField: 'y',
+ seriesField: 'type',
+ morph: {
+ morphKey: 'A',
+ morphElementKey: 'type'
+ }
+ },
+ {
+ type: 'scatter',
+ data: { values: DataB },
+ xField: 'x',
+ yField: 'y',
+ seriesField: 'type',
+ morph: {
+ morphKey: 'B',
+ morphElementKey: 'type'
+ }
+ }
+ ],
+ axes: [
+ { orient: 'left', type: 'linear', zero: false, max: 1 },
+ { orient: 'bottom', type: 'band' }
+ ]
+};
+
+const specs = [barSpec, scatterSpec];
+
+const vchart = new VChart(specs[0], { dom: CONTAINER_ID });
+
+vchart.renderSync();
+let count = 1;
+setInterval(() => {
+ vchart.updateSpec(specs[count % 2]);
+ count++;
+}, 3000);
+
+
+```
+#### Many-to-One Animation
+
+Many-to-one animation refers to multiple graphic elements transitioning into one element. For example, in the example above, we can have multiple points of a scatter series merge into one large column.
+
+### Interpretation of the Source Code Execution Process for Effect Implementation
+
+The transition between different charts can be explained by updating the configuration, and with morphing animation enabled, the transition effects of series elements are automatically recognized. Below is an explanation of the default effect settings.
+
+
+
+
+
+### Draft Interpretation of Global Animation Implementation
+
+Global animations refer to those animation effects that apply at the entire chart level. They can be applied to the overall entrance animation when the chart loads, the unified change animation when data updates, and the overall exit animation before the chart is destroyed. In VChart, the design and implementation of global animations rely on several core components and mechanisms, including the `Factory` class, `AnimateManager` class, `IAnimationSpec` interface, etc.
+
+
+
+#### 1. Animation Registration and Management
+
+
+
+**Factory Class**
+
+
+
+The `Factory` class is a key player in the animation system, responsible for managing and registering various types of animations. Through the static method `registerAnimation`, we can associate specific animation logic with a name for subsequent use.
+
+
+
+```xml
+class Factory {
+ static registerAnimation(key: string, animation: (params?: any, preset?: any) => MarkAnimationSpec) {
+ Factory._animations[key] = animation;
+ }
+}
+
+```
+
+
+When you need to add animation to a chart element, you can use `Factory.getAnimationInKey` to obtain a registered animation and apply it to the corresponding graphic or graphical element.
+
+
+
+#### 2. Animation Configuration Structure
+
+
+
+**IAnimationSpec Interface**
+
+
+
+The `IAnimationSpec` interface defines the basic structure of animation configuration, covering various states from entry (`animationAppear`) to exit (`animationDisappear`). Each state can accept a boolean value (enable/disable), a preset configuration object, or a custom configuration object as a parameter.
+
+
+
+```xml
+interface IAnimationSpecRGB to HSL algorithm:
+1. Normalize RGB values to [0,1]
+1. Find the maximum and minimum values among R, G, B
+1. Calculate brightness L = (max + min) / 2
+1. Calculate saturation S
+1. Calculate hue H
+HSL to RGB algorithm:
+1. Divide H into 6 intervals
+1. Calculate intermediate variables based on S and L
+1. Calculate R, G, B values using different formulas
+1. Map the results to [0,255]
+
+* If max == min, S = 0
+
+* Otherwise S = (max - min) / (1 - |2L - 1|)
+
+* Use different formulas based on which color component is the largest
+
+* Range 0-360 degrees
+
+2. **Set the transparency of the color**
+
+ **Core code for transparency adjustment**
+
+```javascript
+if (isValid(colorKey.a)) {
+ c.setOpacity(colorKey.a);
+}
+
+```
+#### **queryToken Token Semantics**
+
+
+```xml
+export function queryTokenThrough the methods defined in the `VChart` class, the core rendering and update logic of the chart is implemented. `ThemeManager` and `InstanceManager` are responsible for the global management of themes and instances, respectively, forming a decoupled, flexible, and extensible chart library architecture; `VChart` provides a unified update entry, implementing most of the update operation logic; while `ThemeManager` and `InstanceManager` achieve global theme updates through instance registration and traversal mechanisms.
+# In-depth Analysis of the Theme Update Process
+
+The VChart official website divides theme updates into two dimensions, namely
+
+* Updating the theme of **a single chart instance**
+
+* Updating the theme of **all charts globally** through `ThemeManager`.
+
+
+
+The specific approach can be viewed at [🎁 VisActor Data Visualization Competition](https://www.visactor.io/vchart/guide/tutorial_docs/Theme/Customize_Theme). Both methods use the same `setCurrentTheme` call to switch themes. The former is called by an instance generated by the VChart object, updating a single chart; the latter is called through `ThemeManager`, updating the global chart theme. Therefore, my approach to reading the source code is based on the declaration and definition of the `setCurrentTheme` method, delving deeper layer by layer.
+
+## Example:
+
+Updating a single instance:
+
+```xml
+const vchart = new VChart(spec, { dom: CONTAINER_ID });
+//单个theme实例的更新
+vchart.setCurrentTheme('userTheme');
+
+```
+Update of global themes:
+
+
+```xml
+// 注册主题
+VChart.ThemeManager.registerTheme('userTheme', theme);
+//全局主题更新
+VChart.ThemeManager.setCurrentTheme('userTheme');
+
+```
+## Theme Update Executor: VChart.ts \r\n\r\nAnalyze update behavior, focusing on reading this call chain: \r\n\r\n\u0060setCurrentTheme()\u0060→ \u0060setCurrentThemeSync()\u0060\u0026\u0060updateCustomConfigAndRerender()\u0060→ \u0060_setCurrentTheme()\u0060 execution process \r\n\r\n### \u0060_setCurrentTheme() \u0060\r\n\r
+```xml
+ protected _setCurrentTheme(name?: string): IUpdateSpecResult {
+ this._updateCurrentTheme(name);
+ this._initChartSpec(this._getSpecFromOriginalSpec(), 'setCurrentTheme');
+ this._chart?.setCurrentTheme();
+ return { change: true, reMake: false };
+ }
+
+```
+First, analyze the internal private method _setCurrentTheme, first trigger `_updateCurrentTheme`, enter the theme merging and parsing process explained in section 11-1, then reinitialize the chart specification (spec). `chart` is the core rendering instance of the chart, responsible for specific rendering and interaction logic. Here, the method `setCurrentTheme` is called, which will be analyzed in detail below.
+
+Finally, the returned { change: true, reMake: false } indicates: change means the configuration has changed, triggering a re-render, informing the rendering engine that an update is needed. reMake means a complete rebuild of the chart is not necessary, only a partial update is required. This structure is returned to trigger the chart update behavior in the subsequent `setCurrentThemeSync` in `updateCustomConfigAndRerender`.
+
+
+
+### `setCurrentThemeSync()` & `updateCustomConfigAndRerender()`
+
+```xml
+ /**
+ * **同步方法** 设置当前主题。
+ * **注意,如果在 spec 上配置了 theme,则 spec 上的 theme 优先级更高。**
+ * @param name 主题名称
+ * @returns
+ */
+ setCurrentThemeSync(name: string) {
+ if (!ThemeManager.themeExist(name)) {
+ return this as unknown as IVChart;
+ }
+ const result = this._setCurrentTheme(name);
+ this._setFontFamilyTheme(this._currentTheme?.fontFamily as string);
+ this.updateCustomConfigAndRerender(result, true, {
+ transformSpec: false,
+ actionSource: 'setCurrentTheme'
+ });
+ return this as unknown as IVChart;
+ }
+
+```
+After checking for null, we first get the agreed object { change: true, reMake: false }, which means the theme is updated and must trigger a re-render, but there is no need to completely rebuild the table, just a partial update is sufficient.
+
+
+
+#### `updateCustomConfigAndRerender()`
+
+```xml
+ //result: { change: true, reMake: false };
+
+ //调用updateCustomConfigAndRerender
+ this.updateCustomConfigAndRerender(result, true, {
+ transformSpec: false,
+ actionSource: 'setCurrentTheme'
+ });
+
+ //updateCustomConfigAndRerender具体实现
+ updateCustomConfigAndRerender(
+ updateSpecResult: IUpdateSpecResult | (() => IUpdateSpecResult),
+ sync?: boolean,
+ option: IVChartRenderOption = {}
+ ) {
+ if (this._isReleased || !updateSpecResult) {
+ return undefined;
+ }
+ if (isFunction(updateSpecResult)) {
+ updateSpecResult = updateSpecResult();
+ }
+
+ if (updateSpecResult.reAnimate) {
+ this.stopAnimation();
+ this._updateAnimateState(true);
+ }
+
+ this._reCompile(updateSpecResult);
+ if (sync) {
+ return this._renderSync(option);
+ }
+ return this._renderAsync(option);
+ }
+
+
+```
+`updateCustomConfigAndRerender` 是主题重渲染的核心逻辑,也是任何主题配置更改(数据模型、图表spec等发生更改时)重渲染的核心。在主题更新里的逻辑并不复杂,因为传入的`updateSpecResult`:{ change: true, reMake: false } 并不包括动画处理、也不是函数类型,只执行了`_reCompile()`和`_renderSync()`;
+
+##### `recompile()`
+
+```xml
+ protected _reCompile(updateResult: IUpdateSpecResult, morphConfig?: IMorphConfig) {
+ if (updateResult.reMake) {
+ this._releaseData();
+ this._initDataSet();
+ this._chart?.release();
+ this._chart = null as unknown as IChart;
+ }
+
+ if (updateResult.reTransformSpec) {
+ // 释放图表等等
+ this._chartSpecTransformer = null;
+ }
+
+ // 卸载了chart之后再设置主题 避免多余的reInit
+ if (updateResult.changeTheme) {
+ this._setCurrentTheme();
+ this._setFontFamilyTheme(this._currentTheme?.fontFamily as string);
+ } else if (updateResult.changeBackground) {
+ this._compiler?.setBackground(this._getBackground());
+ }
+
+ if (updateResult.reMake) {
+ // 如果不需要动画,那么释放item,避免元素残留
+ this._compiler?.releaseGrammar(this._option?.animation === false || this._spec?.animation === false);
+ // chart 内部事件 模块自己必须删除
+ // 内部模块删除事件时,调用了event Dispatcher.release() 导致用户事件被一起删除
+ // 外部事件现在需要重新添加
+ this._userEvents.forEach(e => this._event?.on(e.eType as any, e.query as any, e.handler as any));
+
+ if (updateResult.reSize) {
+ this._doResize();
+ }
+ } else {
+ if (updateResult.reCompile) {
+ // recompile
+ // 清除之前的所有 compile 内容
+ this._compiler?.clear(
+ { chart: this._chart, vChart: this },
+ this._option?.animation === false || this._spec?.animation === false
+ );
+ // TODO: 释放事件? vgrammar 的 view 应该不需要释放,响应的stage也没有释放,所以事件可以不绑定
+ // 重新绑定事件
+ // TODO: 释放XX?
+ // 重新compile
+ this._compiler?.compile({ chart: this._chart, vChart: this }, {});
+ }
+ if (updateResult.reSize) {
+ const { width, height } = this.getCurrentSize();
+ this._chart.onResize(width, height, false);
+ this._compiler.resize(width, height, false);
+ }
+ }
+ }
+
+```
+* When reMake is true, the chart will be completely reset through `releaseData`, `initDataSet`, and `release`, releasing all related resources to prepare for re-rendering. As mentioned earlier, theme updates do not completely reset the chart.
+
+* When reMake is false, re-compilation and chart resizing will be performed based on the values of `reCompile` and `reSize`, respectively. Operations are implemented through methods on instances such as `_chart` and `_compiler`.
+
+
+
+After reading the source code, it is known that theme updates do not trigger reCompile operations. Generally, reCompile is needed only when there are additions or deletions in the graphics.
+
+##### `_renderSync()`
+
+```xml
+ protected _renderSync = (option: IVChartRenderOption = {}) => {
+ const self = this as unknown as IVChart;
+ if (!this._beforeRender(option)) {
+ return self;
+ }
+ // 填充数据绘图
+ this._compiler?.render(option.morphConfig);
+ this._afterRender();
+ return self;
+ };
+
+
+```
+This is a synchronous rendering method, which prepares and checks before rendering through `_beforeRender` to ensure that the rendering conditions are met; it calls the `render` method of `_compiler` to perform the actual chart drawing, and can pass in transformation configurations; after completing the drawing, `_afterRender` performs post-rendering cleanup and state updates, and returns the current instance.
+
+## Principle of Global Update
+
+### Theme Scheduling Center theme-manager
+
+As mentioned earlier, the VChart instance updates the theme for a single chart, while the themeManager updates the global theme
+
+https://www.visactor.io/vchart/guide/tutorial_docs/Theme/Customize_Theme
+After registering the theme in `ThemeManager`, you can use `ThemeManager.setCurrentTheme` to hot-update the registered theme by theme name. Note: This method will affect all chart instances on the page.
+
+```xml
+ static setCurrentTheme(name: string) {
+ if (!ThemeManager.themeExist(name)) {
+ return;
+ }
+ ThemeManager._currentThemeName = name;
+ InstanceManager.forEach((instance: IVChart) => instance?.setCurrentTheme(name));
+ }
+
+```
+It is not difficult to see that this method globally sets the current theme name, then iterates over all registered chart instances and calls `setCurrentTheme` on each instance, thereby achieving a global update of the theme for all instances.
+
+### Reason for Theme Instance Operations instance-manager
+
+The operation of the instance on the chart is actually because, within the constructor of the VChart class, the current VChart instance is registered in `InstanceManager.instances`, thereby supporting global operations such as unified theme updates.
+
+```xml
+ export class VChart implements IVChart {
+ constructor(spec: ISpec, options: IInitOption) {
+ //......其他
+ InstanceManager.registerInstance(this);
+ }
+ }
+
+```
+
+
+# Conclusion
+
+In summary, most of the update operations in vchart.ts are implemented in the VChart class, not only involving theme updates but also other situations that require updates. Theme updates are just a part of it; the theme-manager and instance-manager allow developers to manage global theme updates through the registration and traversal of instances, achieving both single instance updates and global updates of themes.
+
+---
+# This document is provided by
+
+Dun Dun (https://github.com/Shabi-x)
+
+
+# This document is revised and organized by
+[Xuan Hun](https://github.com/xuanhun)
\ No newline at end of file
diff --git a/docs/assets/contributing/en/sourcecode/12.1-vchart-plugin-mechanism.md b/docs/assets/contributing/en/sourcecode/12.1-vchart-plugin-mechanism.md
new file mode 100644
index 0000000000..c353c45d92
--- /dev/null
+++ b/docs/assets/contributing/en/sourcecode/12.1-vchart-plugin-mechanism.md
@@ -0,0 +1,136 @@
+---
+title: 12.1 VChart Plugin Mechanism
+
+key words: VisActor,VChart,VTable,VStrory,VMind,VGrammar,VRender,Visualization,Chart,Data,Table,Graph,Gis,LLM
+---
+> ## 12.1 VChart Plugin Mechanism
+> Score: 5
+> ## 12.2 Detailed Explanation of VChart Plugin Function Source Code
+> Score: 5
+> 1. Code Entry: `packages/vchart/src/plugin`
+> 1. Key Points of Interpretation:
+
+1. Different Types of Plugins
+
+1. Plugin Mechanism and Implementation Principles
+
+
+
+# Plugin System Concept
+
+VChart provides a series of plugin extension supports. This article only describes the concept of the plugin system and simple usage examples. In-depth source code exploration is analyzed and introduced in section 12.2;
+
+## Different Types of VChart Plugins
+
+### Formatting Plugins
+
+Formatting plugins in VChart support using formatters to update data display styles, enriching data display styles through simple configuration:
+
+
+```xml
+ const spec = {
+ data: [
+ {
+ id: "barData",
+ values: [
+ { month: "Monday", sales: 22.324 },
+ { month: "Tuesday", sales: 13.663 },
+ { month: "Wednesday", sales: 25.342 },
+ { month: "Thursday", sales: 29.3257 },
+ { month: "Friday", sales: 12.999 },
+ ],
+ },
+ ],
+ type: "bar",
+ xField: "month",
+ yField: "sales",
+ label: {
+ visible: true,
+ position: "top",
+ formatter: "¥{sales:.2t}",
+ **//格式化:销售额指定保留两位小数但不四舍五入**
+ },
+ legends: {
+ visible: true,
+ },
+ };
+
+```
+
+
+>
+> The formatting effect is shown in the image
+
+
+
+### media-query
+
+The media-query plugin module implements media query functionality. To facilitate understanding, a demo from the official website can be used to explain:
+
+```Typescript
+const getSpec = () => ({
+ type: 'pie',
+ data: [
+ //...
+ ],
+ //query-media配置流程
+ media: [
+ {
+ query: {
+ maxHeight: 200
+ },
+ action: [
+ {
+ filterType: 'legends',
+ filter: [{ orient: 'top' }, { orient: 'bottom' }],
+ spec: { orient: 'left', padding: 0 }
+ },
+ {
+ filterType: 'title',
+ spec: { visible: false }
+ },
+ {
+ filterType: 'chart',
+ spec: { padding: 10 }
+ }
+ ]
+ }
+ ]
+});
+
+```
+
+
+
+
+
+
+
+
+Observing this example, it is not difficult to find that under the effect of media queries, by declaring media query logic, the style changes of the chart's dynamic layout at different heights are achieved:
+
+* When the chart height ≤ 200px:
+
+* The legend direction changes to the left side, with padding of 0.
+
+* The title is hidden.
+
+* The chart padding is 10.
+
+* When the chart height > 200px:
+
+* Restore default styles.
+
+
+
+Simply put, the media-query plugin of VChart supports us in triggering actions to rearrange the chart layout, achieving responsive design of the chart, enhancing user experience and development efficiency.
+
+
+
+
+
+In the next chapter, I will provide a deeper interpretation of the specific implementation mechanism of the plugin:
+
+
+ # This document was revised and organized by the following personnel
+ [Xuanhun](https://github.com/xuanhun)
\ No newline at end of file
diff --git a/docs/assets/contributing/en/sourcecode/12.2-vchart-plugin-feature-source-code-analysis.md b/docs/assets/contributing/en/sourcecode/12.2-vchart-plugin-feature-source-code-analysis.md
new file mode 100644
index 0000000000..8df10b2bcd
--- /dev/null
+++ b/docs/assets/contributing/en/sourcecode/12.2-vchart-plugin-feature-source-code-analysis.md
@@ -0,0 +1,103 @@
+---
+title: 12.2 VChart Plugin Functionality Source Code Explanation
+
+key words: VisActor,VChart,VTable,VStrory,VMind,VGrammar,VRender,Visualization,Chart,Data,Table,Graph,Gis,LLM
+---
+In the previous section (#12.1 VChart Plugin Mechanism), the basic usage of plugins in VChart was introduced. In this section, I will delve into the source code to explore the implementation logic of various plugins in depth;
+
+## Relevant Source Code Locations
+
+* ` packages/vchart/src/plugin/chart/formatter/` : Core implementation of the formatting plugin
+
+* ` packages/vchart/src/plugin/chart/media-query/` : Core implementation of the media query plugin
+
+## Formatting Plugin
+
+### Numerical Text Formatting
+
+
+```xml
+ protected _formatSingleText(text: string | number, formatter: string): string | number {
+ const isNumeric = numberSpecifierReg.test(formatter);
+ if (isNumeric && this._numericFormatter) {
+ // 内置的 formatter 逻辑,可以进行缓存性能优化
+ let numericFormat;
+ if (this._numericFormatterCache && this._numericSpecifier) {
+ if (this._numericFormatterCache.get(formatter)) {
+ numericFormat = this._numericFormatterCache.get(formatter);
+ } else {
+ numericFormat = this._numericSpecifier(formatter) as any;
+ this._numericFormatterCache.set(formatter, numericFormat);
+ }
+ return numericFormat(Number(text));
+ }
+ return this._numericFormatter(formatter, Number(text));
+ } else if (formatter.includes('%') && this._timeFormatter) {
+ return this._timeFormatter(formatter, text);
+ }
+ return text;
+ }
+
+
+```
+### Time Text Formatting
+
+VChart for time format conversion in
+
+
+```xml
+private readonly _timeModeFormat = {
+ utc: TimeUtil.getInstance().timeUTCFormat,
+ local: TimeUtil.getInstance().timeFormat
+};
+
+// 在 onInit 中设置时间格式化器
+onInit(service: IChartPluginService, chartSpec: any) {
+ const { timeMode, timeFormatter } = this._spec;
+
+ if (isFunction(timeFormatter)) {
+ // 使用自定义时间格式化函数
+ this._timeFormatter = timeFormatter;
+ } else if (timeMode && this._timeModeFormat[timeMode]) {
+ // 使用内置的 UTC 或本地时间格式化
+ this._timeFormatter = this._timeModeFormat[timeMode];
+ }
+}
+
+// 在 _formatSingleText 中处理时间格式化
+protected _formatSingleText(text: string | number, formatter: string): string | number {
+ // 数值格式化逻辑...
+
+ // 时间格式化逻辑
+ else if (formatter.includes('%') && this._timeFormatter) {
+ return this._timeFormatter(formatter, text);
+ }
+
+ return text;
+}
+
+```
+### Data Variable Replacement
+
+1. **Template Parsing**:
+
+* Use regular expression `/\{([^}]\u002B)\}/g` to match curly brace templates
+
+* Support nested format definitions (e.g., `{field:format}`)
+
+1. **Field Extraction**:
+
+* Split field name and format specification with a colon (`field:format`)
+
+1. **Dynamic Replacement**:
+
+* Extract corresponding field values from the data object `datum`
+
+* Recursively apply format specifications for secondary formatting
+
+## Media-query Plugin
+
+
+
+ # This document was revised and organized by the following person
+ [玄魂](https://github.com/xuanhun)
\ No newline at end of file
diff --git a/docs/assets/contributing/en/sourcecode/13.1-vchart-on-demand-loading-mechanism.md b/docs/assets/contributing/en/sourcecode/13.1-vchart-on-demand-loading-mechanism.md
new file mode 100644
index 0000000000..d5ee627d78
--- /dev/null
+++ b/docs/assets/contributing/en/sourcecode/13.1-vchart-on-demand-loading-mechanism.md
@@ -0,0 +1,147 @@
+---
+title: 13.1 VChart On-Demand Loading Mechanism
+
+key words: VisActor,VChart,VTable,VStrory,VMind,VGrammar,VRender,Visualization,Chart,Data,Table,Graph,Gis,LLM
+---
+VChart is a ready-to-use chart library that provides 20+ chart types by default. As the number of chart types increases and features become richer, package size is a major concern for everyone. Therefore, VChart uses an on-demand loading mechanism to meet various needs for VChart in different scenarios. Before introducing the specific design, we need to understand two prerequisite concepts:
+
+* VChart chart composition
+
+* What is tree-shaking
+
+This article will introduce the principle of VChart's on-demand loading from these two perspectives.
+
+## VChart Chart Composition
+
+### Terminology Definition
+
+Before delving into the composition of VChart charts, we need to understand the following terms:
+
+* `series` - The main body of the chart, also known as a series, contains a set of graphic elements and their corresponding chart logic.
+
+* `mark` - Basic graphic elements, also known as basic graphics, such as points, lines, etc.
+
+* `region` - Spatial information element, associated with one or more series, helps in spatial positioning.
+
+* `component` - Components that assist in reading and interacting with the chart, such as legends, axes, tooltips, etc.
+
+* `layout` - Layout, manages the spatial distribution of chart elements.
+
+* `chart` - An abstract concept of a chart, the manager that integrates and manages data, graphic elements, components, and layout elements.
+
+### Chart Definition
+
+#### Logical Layer Chart Elements
+
+We break down the logical layer elements of a chart into the following four parts:
+
+* series is the main body of the chart, containing a set of graphic elements and the corresponding type of chart logic. For example, in a line chart, series refers to the collection of points and lines and all the logic of the line chart.
+
+* component provides auxiliary capabilities, helping with reading and interacting with the chart, such as legends, axes, tooltips, dataZoom, etc.
+
+* region is a spatial information element that can associate with one or more series, helping series with spatial positioning, and is also a minimum combination unit.
+
+* chart is an abstract concept, the manager that integrates and manages various elements of the chart, and is the core context of the chart's logical layer.
+
+##### Simple Chart
+
+A simple chart consists of a region, a series of a determined type, a component, and a chart that manages the chart logic. Taking a common line chart as an example, its composition is as follows
+
+
+
+##### Combination Chart
+
+We define a combination chart as consisting of multiple regions, multiple series of determined types, components, and a chart that manages the chart logic. Here, we encapsulate the chart as a combination chart with `type: 'common'`.
+
+In a combination chart, several different types of sub-charts can be defined. Each sub-chart can independently configure its own data and components, and all sub-charts are by default associated with the same region. At this point, each sub-chart overlaps on the region. We take the common bar-line dual-axis chart as an example to introduce the combination chart in detail:
+
+* First, if we need to create a combination chart, we need to declare `type: 'common'`, indicating that the type of chart we need to create is a combination chart.
+
+* As mentioned above, the chart is the manager that integrates and manages data, graphic elements, components, and layout elements. Logically, it consists of region + series + layout, and the bar and line correspond to the 'bar' and 'line' series types, respectively. By default, all series are associated with the same region, so we do not need to configure the region here.
+
+* Each series can have its own data source, or the data source can be directly configured on the chart. In the series, it is associated through `fromDataId` or `fromDataIndex`. In the current example, we choose to configure it on the chart.
+
+
+
+As mentioned earlier, a region is a spatial information element that can be used in conjunction with layouts to divide the canvas into spatial sections using multiple differently positioned regions. At the same time, components can also specify relationships associated with regions. When a component is associated with multiple regions, it will by default collect the data dimensions of all subgraphs under the regions for display, as shown in the following example:
+
+
+
+### Primitive mark
+
+Primitives are the definition of graphics in the chart view layer. VChart defines primitives in charts, including basic primitives and composite primitives.
+
+Basic primitives include: symbol, rect, line, rule, arc, area, text, path, image, 3D rect, 3D arc, polygon, etc.
+
+Composite primitives are formed by combining multiple basic primitives. We collectively refer to basic primitives and composite primitives as primitives.
+
+Logical layer elements (such as series) are composed of several primitives. For example, the area chart (`'area'`) series includes points, lines, and areas, corresponding to the basic primitives: symbol, line, area.
+
+
+
+## What is tree-shaking
+
+
+
+Tree Shaking is a code optimization technique used to remove unused code (dead code) in JavaScript. This concept was first proposed by Rollup and later widely adopted by build tools such as Webpack.
+
+
+
+The implementation of Tree Shaking mainly relies on these features of ES Module:
+
+* Import and export statements can only be at the top level of the module
+
+* The names of imported and exported modules cannot be dynamic
+
+* Imported modules are immutable
+
+
+
+
+```javascript
+// 1. 导入导出语句只能在模块顶层
+import { foo } from './foo';
+export const bar = () => {};
+
+// 2. 导入导出的模块名字不能是动态的
+import { 'f' + 'oo' }; // 错误
+
+// 3. 导入的模块是不可变的
+import { foo } from './foo';
+foo = 'bar'; // 错误
+
+```
+The packaging tool constructs a module dependency graph during the marking phase based on the dependencies between files, analyzes import and export relationships, and removes unused exports during the packaging phase, retaining only the used code.
+
+
+
+
+```javascript
+// 1. 标记阶段
+// module.js
+export const foo = () => console.log('foo');
+export const bar = () => console.log('bar');
+
+// main.js
+import { foo } from './module';
+foo(); // foo被标记为使用
+// bar未被使用,标记为dead code
+
+// 2. 删除阶段
+// 打包后,bar函数被删除
+const foo = () => console.log('foo');
+foo();
+
+```
+When using Tree Shaking, the `sideEffects` configuration plays a crucial role in ensuring that unused code is correctly removed. In the project's `package.json` file, the `sideEffects` field is used to inform the bundler which files or modules have side effects, meaning they perform actions other than exporting values (such as modifying global state, executing initialization code, etc.). If a module has no side effects, the bundler can safely remove unreferenced parts.
+
+## The Principle of VChart On-Demand Loading
+
+Based on the above understanding of VChart chart composition and the concept of Tree Shaking, the core idea of VChart on-demand loading is to use Tree Shaking technology to only bundle the chart types, components, and graphic elements that the user actually uses, thereby reducing the package size. In the next chapter, we will detail some implementation specifics.
+
+
+
+
+
+# This document was revised and organized by the following personnel
+[玄魂](https://github.com/xuanhun)
\ No newline at end of file
diff --git a/docs/assets/contributing/en/sourcecode/13.2-vchart-on-demand-loading-source-code-analysis.md b/docs/assets/contributing/en/sourcecode/13.2-vchart-on-demand-loading-source-code-analysis.md
new file mode 100644
index 0000000000..8d39fd61ae
--- /dev/null
+++ b/docs/assets/contributing/en/sourcecode/13.2-vchart-on-demand-loading-source-code-analysis.md
@@ -0,0 +1,191 @@
+---
+title: 13.2 VChart On-Demand Loading Source Code Explanation
+
+key words: VisActor,VChart,VTable,VStrory,VMind,VGrammar,VRender,Visualization,Chart,Data,Table,Graph,Gis,LLM
+---
+Based on the previous articles, we have introduced the composition of VChart and the concept of Tree Shaking. Based on these two preliminary concepts, we will now elaborate on the specific implementation of VChart's on-demand loading.
+
+## Core Creation Process of VChart Charts
+
+
+
+
+
+## Factory
+
+The on-demand loading of VChart mainly relies on the `Factory` class to achieve this. This class plays an important role, responsible for registering and creating various charts, series, components, graphics, Regions, layouts, and plugins. Below, we will conduct an in-depth analysis from the aspects of the registration mechanism, creation mechanism, and on-demand registration of charts.
+
+### Registration Mechanism
+
+The `Factory` class provides a series of static methods for registering different types of modules. Through these methods, modules are registered into the static properties of `Factory`, thereby forming a registry. The specific code is as follows:
+
+```xml
+static registerChart(key: string, chart: IChartConstructor) {
+ Factory._charts[key] = chart;
+}
+static registerSeries(key: string, series: ISeriesConstructor) {
+ Factory._series[key] = series;
+}
+static registerComponent(key: string, cmp: IComponentConstructor, alwaysCheck?: boolean) {
+ Factory._components[key] = { cmp, alwaysCheck };
+}
+// 其他注册方法...
+
+```
+### Creation Mechanism
+
+The `Factory` class also provides a series of static methods for creating module instances as needed. These methods look up the corresponding constructor from the registry based on the type and create an instance. The sample code is as follows:
+
+
+```xml
+static createChart(chartType: string, spec: any, options: IChartOption): IChart | null {
+ if (!Factory._charts[chartType]) {
+ return null;
+ }
+ const ChartConstructor = Factory._charts[chartType];
+ return new ChartConstructor(spec, options);
+}
+static createSeries(seriesType: string, spec: any, options: ISeriesOption) {
+ if (!Factory._series[seriesType]) {
+ return null;
+ }
+ const SeriesConstructor = Factory._series[seriesType];
+ return new SeriesConstructor(spec, options);
+}
+// 其他创建方法...
+
+```
+### On-Demand Registration of Charts
+
+Taking the line chart as an example, let's look at the specific implementation of on-demand registration. In `packages/vchart/src/chart/line/line.ts`, there is the following code:
+
+
+```javascript
+export const registerLineChart = () => {
+ registerLineSeries();
+ Factory.registerChart(LineChart.type, LineChart);
+};
+
+```
+The `registerLineSeries` is implemented in `packages/vchart/src/series/line/line.ts`, the code is as follows:
+
+```javascript
+export const registerLineSeries = () => {
+ registerSampleTransform();
+ registerMarkOverlapTransform();
+ registerLineMark();
+ registerSymbolMark();
+ registerLineAnimation();
+ registerScaleInOutAnimation();
+ registerCartesianBandAxis();
+ registerCartesianLinearAxis();
+ Factory.registerSeries(LineSeries.type, LineSeries);
+};
+
+```
+By implementing the above code, when using VChart, if you call `registerLineChart` to register a line chart, it will automatically register the necessary elements such as the line series, line chart elements, and point chart elements that the line chart depends on. The specific usage is as follows:
+
+```xml
+import { VChart } from './core';
+import { registerLineChart } from './chart/line';
+VChart.useRegisters([
+ registerLineChart,
+ // 其他需要的模块
+]);
+
+```
+In `packages/vchart/src/core/vchart.ts`, the chart instance is not created by direct path reference, but by using `Factory.createChart`. In this way, the core class `vchart` can create instances based on the charts registered by the user without referencing all chart implementations. The relevant code is as follows:
+
+```xml
+private _initChart(spec: any) {
+ // ...
+ const chart = Factory.createChart(spec.type, spec, this._getChartOption(spec.type));
+ //...
+ }
+
+```
+## Core Class VChart On-Demand Loading
+
+Next, let's discuss a question: Is there a difference between the following two ways of referencing `VChart`?
+
+* Method One:
+
+
+```javascript
+import VChart from '@visactor/vchart';
+
+```
+* Method Two:
+
+```javascript
+import { VChart } from '@visactor/vchart';
+
+```
+The answer is yes, the effects produced by these two citation methods are different. Below is an analysis of the reasons for their differences.
+
+First, in the corresponding `package.json` of the vchart codebase, you can see the following configuration:
+
+```xml
+{
+ "sideEffects": [
+ "./*/index-lark.js",
+ "./*/index-wx-simple.js",
+ "./*/index-wx.js",
+ "./*/vchart-all.js",
+ "./*/vchart-simple.js"
+ ],
+}
+
+```
+The configuration explicitly declares all files with side effects.
+
+In `packages/vchart/index.ts`, the following exports are present:
+
+```xml
+import { VChart } from './vchart-all';
+export default VChart;
+export * from './core';
+
+```
+In the `core/index.ts` file, the following exports are present:
+
+```javascript
+import { VChart } from './vchart';
+export { VChart, Factory };
+
+```
+So method one is equivalent to the following reference, where the referenced VChart is the VChart class exported by vchart-all, and method two is equivalent to the VChart class exported from `core/vchart.ts`.
+
+```json
+import { default as VChart } from '@visactor/vchart';
+
+```
+The main purpose of the file `vchart-all.ts` is to register and export all functional modules of VChart:
+
+```json
+VChart.useRegisters([
+ // charts
+ registerLineChart,
+ registerAreaChart,
+ // ...其他图表
+ // components
+ registerCartesianLinearAxis,
+ registerCartesianBandAxis,
+ // ...其他组件
+ // layout
+ registerGridLayout,
+ registerLayout3d,
+ // mark
+ registerAllMarks,
+ // plugin
+ registerDomTooltipHandler,
+ registerCanvasTooltipHandler,
+ // ...其他插件
+]);
+export { VChart };
+
+```
+Since vchart - all is declared as a file with side effects, when VChart is referenced using method one, all files that vchart-all depends on will be packaged; whereas when VChart is referenced using method two, only core/vchart.ts will be packaged.
+
+# This document was revised and organized by the following personnel
+[玄魂](https://github.com/xuanhun)
\ No newline at end of file
diff --git a/docs/assets/contributing/en/sourcecode/14.1.1-react-vchart-introduction.md b/docs/assets/contributing/en/sourcecode/14.1.1-react-vchart-introduction.md
new file mode 100644
index 0000000000..8cb61864ee
--- /dev/null
+++ b/docs/assets/contributing/en/sourcecode/14.1.1-react-vchart-introduction.md
@@ -0,0 +1,134 @@
+---
+title: 14.1.1 Introduction to React-VChart
+
+key words: VisActor,VChart,VTable,VStrory,VMind,VGrammar,VRender,Visualization,Chart,Data,Table,Graph,Gis,LLM
+---
+## Overview
+
+react-vchart is the React wrapper version of VChart, mainly providing two styles of components externally:
+
+* `
+
+
+
+ );
+};
+export default App;
+
+```
+Through the above code examples, the differences in usage between the two components can be understood more intuitively.
+
+
+
+## Core Code Implementation
+
+
+
+From the implementation perspective, the encapsulation principles of ` // 单容器方案
+ }
+}
+
+```
+The cross-platform adaptation architecture is shown in the figure below:
+
+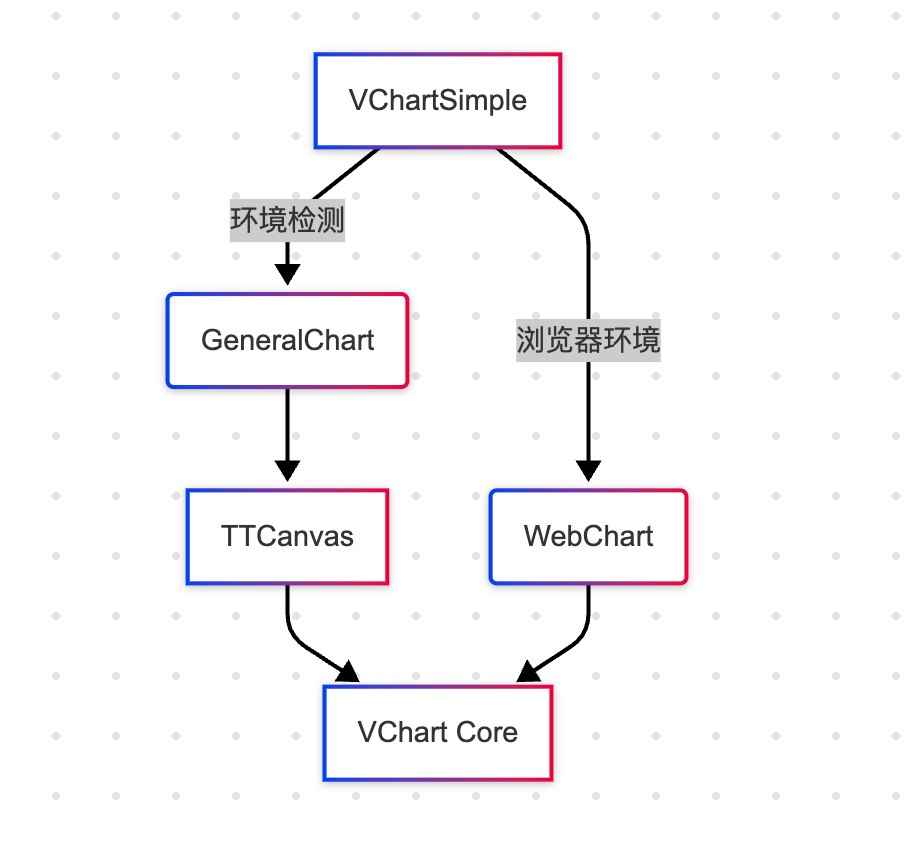 +
+Taro is a framework that can run in various mini-program environments. When using GeneralChart, you can pass in different environments to adapt:
+
+```Typescript
+const strategies = {
+ lark: () =>
+
+Taro is a framework that can run in various mini-program environments. When using GeneralChart, you can pass in different environments to adapt:
+
+```Typescript
+const strategies = {
+ lark: () => 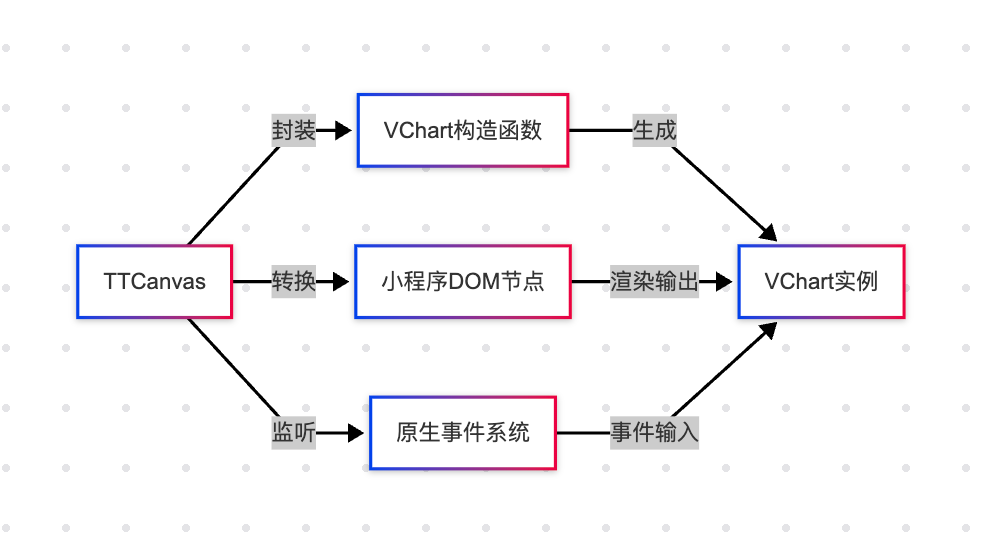 +
+In the following chapters, we will analyze the encapsulation of the WX-VChart component in detail.
+
+
+
+
+
+
+
+ # This document was revised and organized by the following person
+ [玄魂](https://github.com/xuanhun)
\ No newline at end of file
diff --git a/docs/assets/contributing/en/sourcecode/14.2.2-taro-vchart-source-code-analysis.md b/docs/assets/contributing/en/sourcecode/14.2.2-taro-vchart-source-code-analysis.md
new file mode 100644
index 0000000000..af51af7843
--- /dev/null
+++ b/docs/assets/contributing/en/sourcecode/14.2.2-taro-vchart-source-code-analysis.md
@@ -0,0 +1,189 @@
+---
+title: 14.2.2 Taro-VChart Source Code Explanation
+
+key words: VisActor,VChart,VTable,VStrory,VMind,VGrammar,VRender,Visualization,Chart,Data,Table,Graph,Gis,LLM
+---
+## Compatibility with Host Environment
+
+The Taro framework, based on the React technology stack, provides cross-platform component development capabilities (https://taro-docs.jd.com/docs/component). A Taro component consists of the following files:
+
+* index.config.ts: Component compilation configuration (optional)
+
+* index.tsx: Component logic and template content
+
+* index.module.scss: Component styles (CSS Modules scheme recommended)
+
+
+
+### File Description
+
+1. **index.tsx**
+
+Main component file, includes:
+
+* Define the component using `function Component() { ... }` or `class Component extends Component { ... }`
+
+* Write component structure using JSX template syntax
+
+* Export the component through export default
+
+* Component lifecycle management (using Hooks or Class lifecycle)
+
+* Event handling (following React synthetic event specifications)
+
+
+
+2. **index.module.scss**
+
+Component style file:
+
+* Supports Sass/Scss preprocessing
+
+* Use CSS Modules to avoid style pollution
+
+* Import using `import styles from './index.module.scss'`
+
+* Bind styles using className={styles.container}
+
+
+
+3. **index.config.ts** (optional)
+
+Component compilation configuration:
+
+* Define component name: `defineCustomComponent({ name: 'my-component' })`
+
+* Set default values for component properties
+
+* Configure native mini-program components needed by the component
+
+* Cross-platform compatibility configuration
+
+
+
+### 1. Core Entry Module
+
+`index.tsx` is the entry file of the entire library, exporting two core components `VChart` and `VChartSimple`:
+
+
+```xml
+import { VChartSimple } from './simple';
+import { VChart } from './vchart';
+
+export * from './charts'; // 导出所有图表组件
+export { VChart, VChartSimple }; // 导出核心适配器
+export default VChart; // 默认导出
+
+```
+Three-layer export strategy is implemented here:
+
+* Chart component set: Export all predefined charts in bulk through export *
+
+* Core adapters: Individually export the two main components, VChart and VChartSimple
+
+* Default export: Maintain compatibility with the original VChart API
+
+## 2. Environment Adaptation Layer
+
+### 2.1 VChart Component
+
+`vchart.tsx` is the main environment adaptation component, which will choose the appropriate rendering strategy based on the current environment:
+
+
+```xml
+const strategies = {
+ lark: () =>
+
+In the following chapters, we will analyze the encapsulation of the WX-VChart component in detail.
+
+
+
+
+
+
+
+ # This document was revised and organized by the following person
+ [玄魂](https://github.com/xuanhun)
\ No newline at end of file
diff --git a/docs/assets/contributing/en/sourcecode/14.2.2-taro-vchart-source-code-analysis.md b/docs/assets/contributing/en/sourcecode/14.2.2-taro-vchart-source-code-analysis.md
new file mode 100644
index 0000000000..af51af7843
--- /dev/null
+++ b/docs/assets/contributing/en/sourcecode/14.2.2-taro-vchart-source-code-analysis.md
@@ -0,0 +1,189 @@
+---
+title: 14.2.2 Taro-VChart Source Code Explanation
+
+key words: VisActor,VChart,VTable,VStrory,VMind,VGrammar,VRender,Visualization,Chart,Data,Table,Graph,Gis,LLM
+---
+## Compatibility with Host Environment
+
+The Taro framework, based on the React technology stack, provides cross-platform component development capabilities (https://taro-docs.jd.com/docs/component). A Taro component consists of the following files:
+
+* index.config.ts: Component compilation configuration (optional)
+
+* index.tsx: Component logic and template content
+
+* index.module.scss: Component styles (CSS Modules scheme recommended)
+
+
+
+### File Description
+
+1. **index.tsx**
+
+Main component file, includes:
+
+* Define the component using `function Component() { ... }` or `class Component extends Component { ... }`
+
+* Write component structure using JSX template syntax
+
+* Export the component through export default
+
+* Component lifecycle management (using Hooks or Class lifecycle)
+
+* Event handling (following React synthetic event specifications)
+
+
+
+2. **index.module.scss**
+
+Component style file:
+
+* Supports Sass/Scss preprocessing
+
+* Use CSS Modules to avoid style pollution
+
+* Import using `import styles from './index.module.scss'`
+
+* Bind styles using className={styles.container}
+
+
+
+3. **index.config.ts** (optional)
+
+Component compilation configuration:
+
+* Define component name: `defineCustomComponent({ name: 'my-component' })`
+
+* Set default values for component properties
+
+* Configure native mini-program components needed by the component
+
+* Cross-platform compatibility configuration
+
+
+
+### 1. Core Entry Module
+
+`index.tsx` is the entry file of the entire library, exporting two core components `VChart` and `VChartSimple`:
+
+
+```xml
+import { VChartSimple } from './simple';
+import { VChart } from './vchart';
+
+export * from './charts'; // 导出所有图表组件
+export { VChart, VChartSimple }; // 导出核心适配器
+export default VChart; // 默认导出
+
+```
+Three-layer export strategy is implemented here:
+
+* Chart component set: Export all predefined charts in bulk through export *
+
+* Core adapters: Individually export the two main components, VChart and VChartSimple
+
+* Default export: Maintain compatibility with the original VChart API
+
+## 2. Environment Adaptation Layer
+
+### 2.1 VChart Component
+
+`vchart.tsx` is the main environment adaptation component, which will choose the appropriate rendering strategy based on the current environment:
+
+
+```xml
+const strategies = {
+ lark: () => (
+ 'ChartName',
+ { chartConstructor: VChart }, // 核心图表构造器
+ [registerModules] // 按需注册的图表模块
+);
+
+```
+## Rendering Component Layer
+
+After configuring the corresponding charts, we enter the rendering component layer, which includes a general chart component and a browser chart component. Their functions are the same, mainly to cater to different platforms. A brief flowchart is as follows:
+
+
+ +
+### General Chart Component
+
+`components/general-chart/index.tsx` is the core rendering component in the mini program environment, with the following key technical points:
+
+* Asynchronous DOM acquisition mechanism (solving Feishu mini program issues)
+
+* Three-canvas rendering architecture (main canvas, interactive canvas, auxiliary canvas)
+
+* Event delegation and redirection
+
+* Environment-specific configuration
+
+### Web Chart Component
+
+`components/web-chart/index.tsx` is the rendering component for the browser environment, with the main differences from the mini program component:
+
+* Single container rendering (vs. three-canvas structure)
+
+* Synchronous DOM acquisition (vs. asynchronous loop attempts)
+
+* Direct event binding (vs. event delegation)
+
+## Chart Control Layer
+
+`utils/tt-canvas/index.ts` is the controller for chart instances, TTCanvas is responsible for managing VChart instances, receiving props passed by GeneralChart, and achieving seamless integration of chart capabilities in the mini program ecosystem through abstract general interfaces.
+
+
+
+The core responsibilities of TTCanvas:
+
+* Lifecycle management (creation, rendering, updating, releasing)
+
+* Cross-end parameter bridging (converting mini program parameters to VChart usable format)
+
+* Event system adaptation (binding custom events)
+
+* Rendering strategy control (environment-specific configuration)
+
+
+
+
+### General Chart Component
+
+`components/general-chart/index.tsx` is the core rendering component in the mini program environment, with the following key technical points:
+
+* Asynchronous DOM acquisition mechanism (solving Feishu mini program issues)
+
+* Three-canvas rendering architecture (main canvas, interactive canvas, auxiliary canvas)
+
+* Event delegation and redirection
+
+* Environment-specific configuration
+
+### Web Chart Component
+
+`components/web-chart/index.tsx` is the rendering component for the browser environment, with the main differences from the mini program component:
+
+* Single container rendering (vs. three-canvas structure)
+
+* Synchronous DOM acquisition (vs. asynchronous loop attempts)
+
+* Direct event binding (vs. event delegation)
+
+## Chart Control Layer
+
+`utils/tt-canvas/index.ts` is the controller for chart instances, TTCanvas is responsible for managing VChart instances, receiving props passed by GeneralChart, and achieving seamless integration of chart capabilities in the mini program ecosystem through abstract general interfaces.
+
+
+
+The core responsibilities of TTCanvas:
+
+* Lifecycle management (creation, rendering, updating, releasing)
+
+* Cross-end parameter bridging (converting mini program parameters to VChart usable format)
+
+* Event system adaptation (binding custom events)
+
+* Rendering strategy control (environment-specific configuration)
+
+
+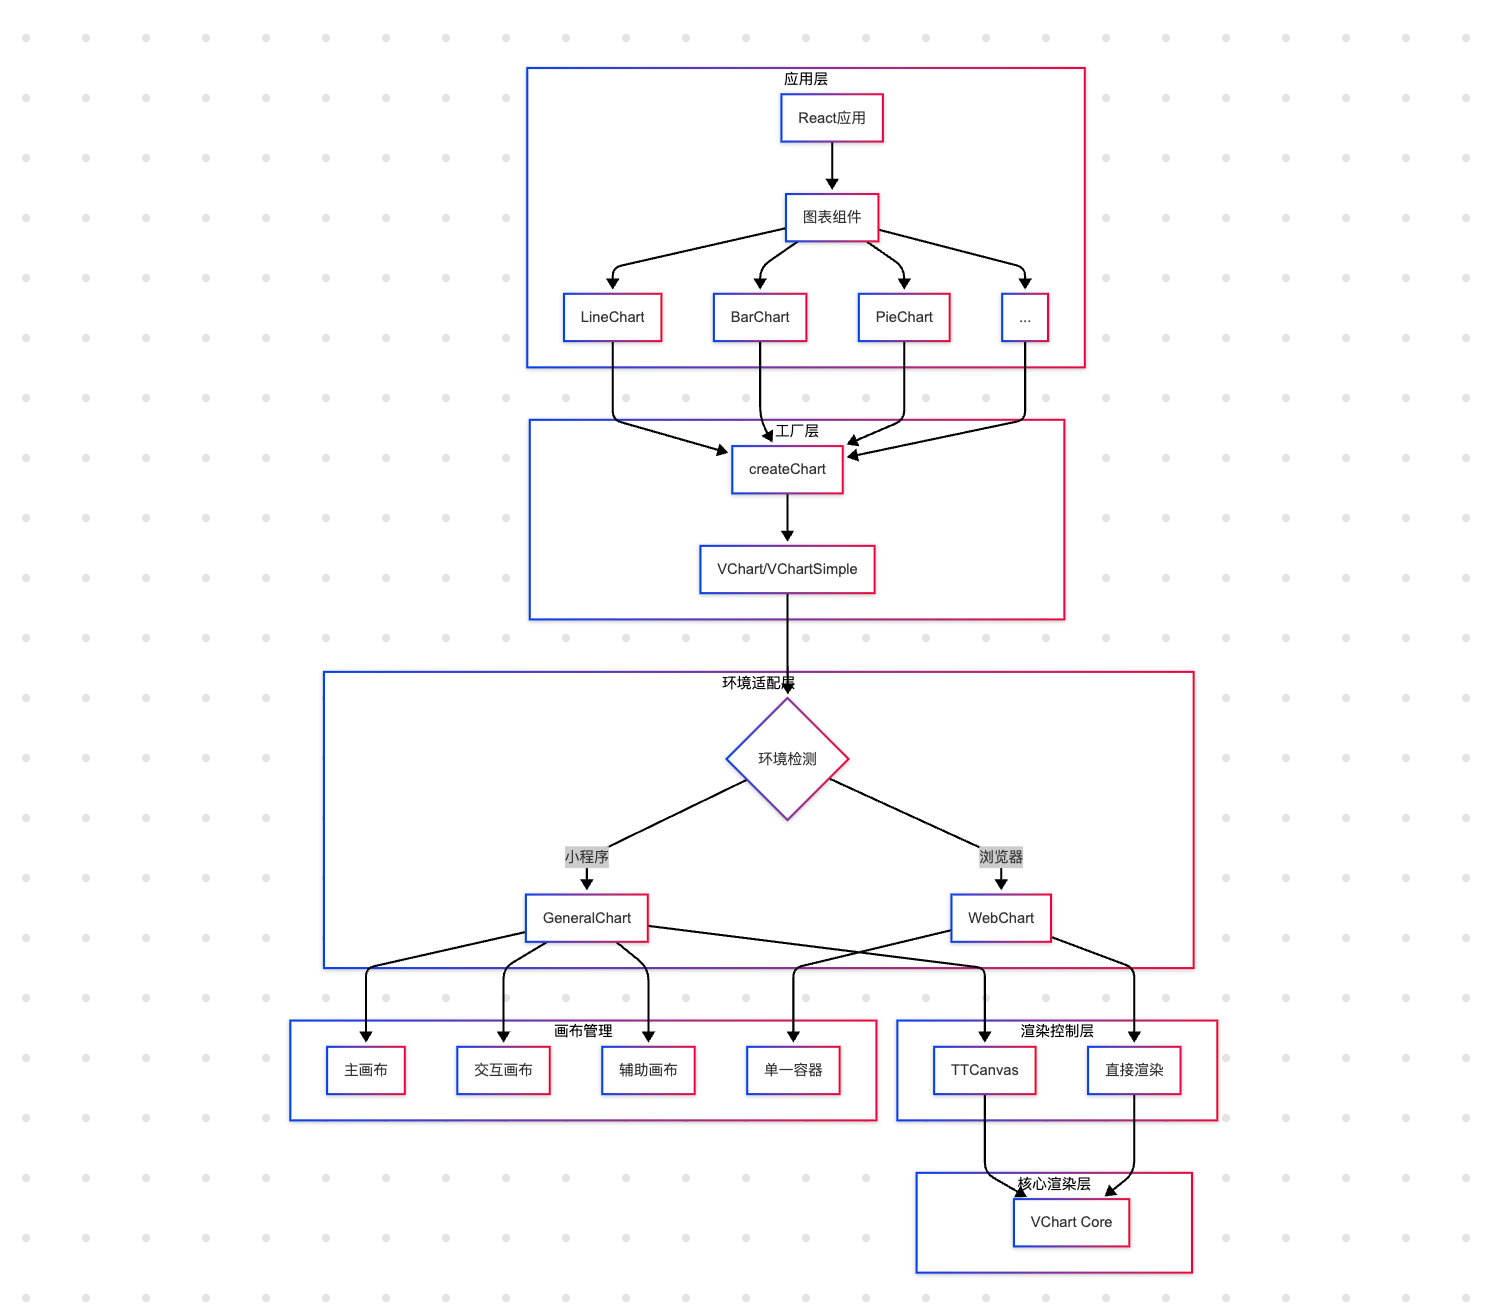 +
+
+
+ # This document was revised and organized by the following person
+ [玄魂](https://github.com/xuanhun)
\ No newline at end of file
diff --git a/docs/assets/contributing/en/sourcecode/14.3.1-lark-vchart-introduction.md b/docs/assets/contributing/en/sourcecode/14.3.1-lark-vchart-introduction.md
new file mode 100644
index 0000000000..db70c747fa
--- /dev/null
+++ b/docs/assets/contributing/en/sourcecode/14.3.1-lark-vchart-introduction.md
@@ -0,0 +1,39 @@
+---
+title: 14.3.1 Lark-VChart 简介
+
+key words: VisActor,VChart,VTable,VStrory,VMind,VGrammar,VRender,Visualization,Chart,Data,Table,Graph,Gis,LLM
+---
+## 概览
+
+lark-vchart 是 VChart 的 Lark 小程序封装版本,提供了在飞书小程序环境下的 VChart 封装。
+
+* 关于更多飞书小程序的宿主环境介绍,请参见官方文档:https://open.feishu.cn/document/client-docs/gadget/introduction/host-environment
+
+* Lark-vchart 包的使用示例请参见文档:https://github.com/VisActor/lark-vchart-example
+
+
+
+## 核心代码结构
+
+Lark-vchart 包的核心实现包含两个部分:
+
+* Lark 环境相关适配:Lark 环境的适配逻辑包含必要的实现代码及声明,其内容存放于 `packages/lark-vchart/src` 中;
+
+* VChart 产物:vchart 图表库相关的能力直接引用了 VChart 的打包产物,其内容存放于 `packages/lark-vchart/src/vchart/index.js` 中。
+
+
+
+在接下来的章节,我们将详细的分析Lark-VChart组件的封装。
+
+
+
+
+
+
+
+
+
+
+
+ # 本文档由以下人员修正整理
+ [玄魂](https://github.com/xuanhun)
\ No newline at end of file
diff --git a/docs/assets/contributing/en/sourcecode/14.3.2-lark-vchart-source-code-analysis.md b/docs/assets/contributing/en/sourcecode/14.3.2-lark-vchart-source-code-analysis.md
new file mode 100644
index 0000000000..d25465e177
--- /dev/null
+++ b/docs/assets/contributing/en/sourcecode/14.3.2-lark-vchart-source-code-analysis.md
@@ -0,0 +1,55 @@
+---
+title: 14.3.2 Lark-VChart Source Code Explanation
+
+key words: VisActor,VChart,VTable,VStrory,VMind,VGrammar,VRender,Visualization,Chart,Data,Table,Graph,Gis,LLM
+---
+
+
+## Compatibility with Host Environment
+
+Feishu gadgets provide the ability to create custom components (https://open.feishu.cn/document/client-docs/gadget/component-component/custom-components/custom-components), each custom gadget includes several parts:
+
+* index.js: Component registration logic
+
+* index.json: Component declaration
+
+* index.ttml: Component template content
+
+* index.ttss: Component style
+
+
+
+### Component Declaration
+
+To ensure the VChart capability in the Feishu environment, Lark VChart's custom components declare three canvases:
+
+* Render canvas: Used to render VChart chart content;
+
+* Hit canvas: Although called Hit Canvas, VChart no longer uses an additional canvas for graphic picking. This canvas is mainly used for additional canvas operations. For example, pixel matching logic in the word cloud layout algorithm and texture rendering logic need to be performed in an additional canvas;
+
+* Tooltip canvas: Used to render additional tooltip content, separating Render canvas and Tooltip canvas to avoid redrawing the entire canvas.
+
+
+
+### Component Registration
+
+Component registration includes properties and necessary lifecycle.
+
+**Component Properties:**
+
+* spec: Same as VChart's spec configuration, but an observer is added in the registration to monitor changes in the chart spec. When the spec is updated, vchart.updateSpec() will be automatically called;
+
+* options: Same as VChart's options configuration;
+
+* events: Same as VChart's registered events, vchart.on will be called during chart initialization to listen to corresponding events.
+
+**Component Methods:**
+
+* init: The core of VChart rendering requires the Canvas. In the init function, Lark VChart will find the corresponding canvas component and initialize the VChart instance to execute the rendering process. The rendering process is the same as a regular VChart example;
+
+* bindEvent: Bind events and filter out potentially duplicate PC & mobile events in the Feishu environment.
+
+
+
+ # This document was revised and organized by the following personnel
+ [Xuanhun](https://github.com/xuanhun)
\ No newline at end of file
diff --git a/docs/assets/contributing/en/sourcecode/14.4.1-tt-vchart-introduction.md b/docs/assets/contributing/en/sourcecode/14.4.1-tt-vchart-introduction.md
new file mode 100644
index 0000000000..dd0939f212
--- /dev/null
+++ b/docs/assets/contributing/en/sourcecode/14.4.1-tt-vchart-introduction.md
@@ -0,0 +1,35 @@
+---
+title: 14.4.1 TT-VChart Introduction
+
+key words: VisActor,VChart,VTable,VStrory,VMind,VGrammar,VRender,Visualization,Chart,Data,Table,Graph,Gis,LLM
+---
+## Overview
+
+TT-vchart is the Douyin mini program encapsulated version of VChart, providing VChart encapsulation in the Feishu mini program environment.
+
+* For more information about the host environment of Byte mini programs, please refer to the official documentation: https://developer.open-douyin.com/docs/resource/zh-CN/mini-app/develop/tutorial/custom-component/custom-component
+
+
+
+## Core Code Structure
+
+The core implementation of the TT-vchart package consists of two parts:
+
+* Douyin mini program environment adaptation: The adaptation logic for the Douyin mini program environment includes necessary implementation code and declarations, which are stored in `packages/tt-vchart/src`;
+
+* VChart products: The capabilities related to the vchart chart library directly reference the packaged products of VChart, which are stored in `packages/tt-vchart/src/vchart/index.js`.
+
+
+
+In the following chapters, we will analyze the encapsulation of the TT-VChart component in detail.
+
+
+
+
+
+
+
+
+
+ # This document was revised and organized by the following personnel
+ [Xuanhun](https://github.com/xuanhun)
\ No newline at end of file
diff --git a/docs/assets/contributing/en/sourcecode/14.4.2-tt-vchart-source-code-analysis.md b/docs/assets/contributing/en/sourcecode/14.4.2-tt-vchart-source-code-analysis.md
new file mode 100644
index 0000000000..5bc50b51ad
--- /dev/null
+++ b/docs/assets/contributing/en/sourcecode/14.4.2-tt-vchart-source-code-analysis.md
@@ -0,0 +1,55 @@
+---
+title: 14.4.2 TT-VChart Source Code Explanation
+
+key words: VisActor,VChart,VTable,VStrory,VMind,VGrammar,VRender,Visualization,Chart,Data,Table,Graph,Gis,LLM
+---
+
+
+## Compatibility with Host Environment
+
+Douyin widgets provide the ability to create custom components (https://developer.open-douyin.com/docs/resource/zh-CN/mini-app/develop/tutorial/custom-component/custom-component). Each custom widget includes several parts:
+
+* index.js: Component registration logic
+
+* index.json: Component declaration
+
+* index.ttml: Component template content
+
+* index.ttss: Component style
+
+
+
+### Component Declaration
+
+To ensure VChart capabilities in the Douyin environment, the TT VChart custom component declares three canvases:
+
+* Render canvas: Used to render VChart chart content;
+
+* Hit canvas: Although called Hit Canvas, VChart no longer uses an additional canvas for graphic picking. This canvas is mainly used for additional canvas operations. For example, pixel matching logic in the word cloud layout algorithm and texture rendering logic need to be performed on an additional canvas;
+
+* Tooltip canvas: Used to render additional tooltip content, separating Render canvas and Tooltip canvas to avoid redrawing the entire canvas.
+
+
+
+### Component Registration
+
+Component registration includes properties and necessary lifecycle.
+
+**Component Properties:**
+
+* spec: Same as VChart's spec configuration, but an observer is added in the registration to monitor changes in the chart spec. When the spec is updated, vchart.updateSpec() will be automatically called;
+
+* options: Same as VChart's options configuration;
+
+* events: Same as VChart's registered events, vchart.on will be called during chart initialization to listen for corresponding events.
+
+**Component Methods:**
+
+* init: The core of VChart rendering requires a Canvas. In the init function, tt vchart will find the corresponding canvas component and initialize the VChart instance to execute the rendering process. The rendering process is the same as a regular VChart example;
+
+* bindEvent: Bind events and filter out potentially duplicate PC & mobile events in the Douyin environment.
+
+
+
+ # This document was revised and organized by the following personnel
+ [Xuanhun](https://github.com/xuanhun)
\ No newline at end of file
diff --git a/docs/assets/contributing/en/sourcecode/14.5.1-wx-vchart-introduction.md b/docs/assets/contributing/en/sourcecode/14.5.1-wx-vchart-introduction.md
new file mode 100644
index 0000000000..f3fa133fbc
--- /dev/null
+++ b/docs/assets/contributing/en/sourcecode/14.5.1-wx-vchart-introduction.md
@@ -0,0 +1,33 @@
+---
+title: 14.5.1 WX-VChart Introduction
+
+key words: VisActor,VChart,VTable,VStrory,VMind,VGrammar,VRender,Visualization,Chart,Data,Table,Graph,Gis,LLM
+---
+## Overview
+
+wx-vchart is the WeChat Mini Program encapsulation version of VChart, providing VChart encapsulation in the WeChat Mini Program environment.
+
+* For more introduction to the host environment of WeChat Mini Programs, please refer to the official documentation: https://developers.weixin.qq.com/miniprogram/dev/framework/
+
+
+
+## Core Code Structure
+
+The core implementation of the wx-vchart package consists of two parts:
+
+* WeChat Mini Program environment adaptation: The adaptation logic for the WeChat Mini Program environment includes necessary implementation code and declarations, which are stored in `packages/wx-vchart/miniprogram`;
+
+* VChart product: The capabilities related to the vchart chart library directly reference the packaged product of VChart, which is stored in `packages/wx-vchart/miniprogram/src/vchart/index.js`.
+
+
+
+In the following chapters, we will analyze the encapsulation of the WX-VChart component in detail.
+
+
+
+
+
+
+
+ # This document was revised and organized by the following personnel
+ [Xuanhun](https://github.com/xuanhun)
\ No newline at end of file
diff --git a/docs/assets/contributing/en/sourcecode/14.5.2-wx-vchart-source-code-analysis.md b/docs/assets/contributing/en/sourcecode/14.5.2-wx-vchart-source-code-analysis.md
new file mode 100644
index 0000000000..02aacad958
--- /dev/null
+++ b/docs/assets/contributing/en/sourcecode/14.5.2-wx-vchart-source-code-analysis.md
@@ -0,0 +1,53 @@
+---
+title: 14.5.2 WX-VChart Source Code Explanation
+
+key words: VisActor,VChart,VTable,VStrory,VMind,VGrammar,VRender,Visualization,Chart,Data,Table,Graph,Gis,LLM
+---
+## Compatibility with Host Environment
+
+WeChat mini-programs provide the ability to create custom components (https://developers.weixin.qq.com/miniprogram/dev/framework/custom-component/), a custom component consists of four files: `json` `wxml` `wxss` `js`:
+
+* index.js: Component registration logic
+
+* index.json: Component declaration
+
+* index.wxml: Component template content
+
+* index.wxss: Component style
+
+
+
+### Component Declaration
+
+To ensure the VChart capability in the WeChat environment, the WX VChart custom component declares three canvases:
+
+* Render canvas: Used to render VChart chart content;
+
+* Hit canvas: Although called Hit Canvas, VChart no longer uses an additional canvas for graphic picking. This canvas is mainly used for executing additional canvas operations. For example, pixel matching logic in the word cloud layout algorithm and texture rendering logic need to be performed on an additional canvas;
+
+* Tooltip canvas: Used to render additional tooltip content, separating Render canvas and Tooltip canvas to avoid redrawing the entire canvas.
+
+
+
+### Component Registration
+
+Component registration includes properties and necessary lifecycle.
+
+**Component Properties:**
+
+* spec: Same as VChart's spec configuration, but an observer is added in the registration to monitor changes in the chart spec. When the spec is updated, vchart.updateSpec() will be automatically called;
+
+* options: Same as VChart's options configuration;
+
+* events: Same as VChart's registered events, vchart.on will be called during chart initialization to listen to corresponding events.
+
+**Component Methods:**
+
+* init: The core of VChart rendering requires the Canvas, in the init function, wx vchart will find the corresponding canvas component and initialize the VChart instance to execute the rendering process. The rendering process is the same as a regular VChart example;
+
+* bindEvent: Bind events and filter out potentially duplicate PC & mobile events in the WeChat environment.
+
+
+
+ # This document was revised and organized by the following personnel
+ [Xuanhun](https://github.com/xuanhun)
\ No newline at end of file
diff --git a/docs/assets/contributing/en/sourcecode/14.6.1-openinula-vchart-introduction.md b/docs/assets/contributing/en/sourcecode/14.6.1-openinula-vchart-introduction.md
new file mode 100644
index 0000000000..804495283d
--- /dev/null
+++ b/docs/assets/contributing/en/sourcecode/14.6.1-openinula-vchart-introduction.md
@@ -0,0 +1,109 @@
+---
+title: 14.6.1 Introduction to Openinula-VChart
+
+key words: VisActor,VChart,VTable,VStrory,VMind,VGrammar,VRender,Visualization,Chart,Data,Table,Graph,Gis,LLM
+---
+# I. Component Introduction
+
+`@visactor/openinula-vchart` is a packaged version of the [VChart](https://visactor.io/vchart) chart library provided by [VisActor](https://visactor.io/) for [Openinula](https://openinula.net/). It offers a series of easy-to-use [Openinula](https://openinula.net/) components for conveniently creating various types of charts in the [Openinula](https://openinula.net/) development environment, including line charts, bar charts, pie charts, etc. The components of `@visactor/openinula-vchart` are highly customizable and extensible, allowing different chart effects to be achieved by passing different parameters and configurations.
+
+# II. **Component Overview**
+
+**openinula-vchart** provides two styles of components:
+
+1. **Unified entry components,** such as: `
+
+
+
+ # This document was revised and organized by the following person
+ [玄魂](https://github.com/xuanhun)
\ No newline at end of file
diff --git a/docs/assets/contributing/en/sourcecode/14.3.1-lark-vchart-introduction.md b/docs/assets/contributing/en/sourcecode/14.3.1-lark-vchart-introduction.md
new file mode 100644
index 0000000000..db70c747fa
--- /dev/null
+++ b/docs/assets/contributing/en/sourcecode/14.3.1-lark-vchart-introduction.md
@@ -0,0 +1,39 @@
+---
+title: 14.3.1 Lark-VChart 简介
+
+key words: VisActor,VChart,VTable,VStrory,VMind,VGrammar,VRender,Visualization,Chart,Data,Table,Graph,Gis,LLM
+---
+## 概览
+
+lark-vchart 是 VChart 的 Lark 小程序封装版本,提供了在飞书小程序环境下的 VChart 封装。
+
+* 关于更多飞书小程序的宿主环境介绍,请参见官方文档:https://open.feishu.cn/document/client-docs/gadget/introduction/host-environment
+
+* Lark-vchart 包的使用示例请参见文档:https://github.com/VisActor/lark-vchart-example
+
+
+
+## 核心代码结构
+
+Lark-vchart 包的核心实现包含两个部分:
+
+* Lark 环境相关适配:Lark 环境的适配逻辑包含必要的实现代码及声明,其内容存放于 `packages/lark-vchart/src` 中;
+
+* VChart 产物:vchart 图表库相关的能力直接引用了 VChart 的打包产物,其内容存放于 `packages/lark-vchart/src/vchart/index.js` 中。
+
+
+
+在接下来的章节,我们将详细的分析Lark-VChart组件的封装。
+
+
+
+
+
+
+
+
+
+
+
+ # 本文档由以下人员修正整理
+ [玄魂](https://github.com/xuanhun)
\ No newline at end of file
diff --git a/docs/assets/contributing/en/sourcecode/14.3.2-lark-vchart-source-code-analysis.md b/docs/assets/contributing/en/sourcecode/14.3.2-lark-vchart-source-code-analysis.md
new file mode 100644
index 0000000000..d25465e177
--- /dev/null
+++ b/docs/assets/contributing/en/sourcecode/14.3.2-lark-vchart-source-code-analysis.md
@@ -0,0 +1,55 @@
+---
+title: 14.3.2 Lark-VChart Source Code Explanation
+
+key words: VisActor,VChart,VTable,VStrory,VMind,VGrammar,VRender,Visualization,Chart,Data,Table,Graph,Gis,LLM
+---
+
+
+## Compatibility with Host Environment
+
+Feishu gadgets provide the ability to create custom components (https://open.feishu.cn/document/client-docs/gadget/component-component/custom-components/custom-components), each custom gadget includes several parts:
+
+* index.js: Component registration logic
+
+* index.json: Component declaration
+
+* index.ttml: Component template content
+
+* index.ttss: Component style
+
+
+
+### Component Declaration
+
+To ensure the VChart capability in the Feishu environment, Lark VChart's custom components declare three canvases:
+
+* Render canvas: Used to render VChart chart content;
+
+* Hit canvas: Although called Hit Canvas, VChart no longer uses an additional canvas for graphic picking. This canvas is mainly used for additional canvas operations. For example, pixel matching logic in the word cloud layout algorithm and texture rendering logic need to be performed in an additional canvas;
+
+* Tooltip canvas: Used to render additional tooltip content, separating Render canvas and Tooltip canvas to avoid redrawing the entire canvas.
+
+
+
+### Component Registration
+
+Component registration includes properties and necessary lifecycle.
+
+**Component Properties:**
+
+* spec: Same as VChart's spec configuration, but an observer is added in the registration to monitor changes in the chart spec. When the spec is updated, vchart.updateSpec() will be automatically called;
+
+* options: Same as VChart's options configuration;
+
+* events: Same as VChart's registered events, vchart.on will be called during chart initialization to listen to corresponding events.
+
+**Component Methods:**
+
+* init: The core of VChart rendering requires the Canvas. In the init function, Lark VChart will find the corresponding canvas component and initialize the VChart instance to execute the rendering process. The rendering process is the same as a regular VChart example;
+
+* bindEvent: Bind events and filter out potentially duplicate PC & mobile events in the Feishu environment.
+
+
+
+ # This document was revised and organized by the following personnel
+ [Xuanhun](https://github.com/xuanhun)
\ No newline at end of file
diff --git a/docs/assets/contributing/en/sourcecode/14.4.1-tt-vchart-introduction.md b/docs/assets/contributing/en/sourcecode/14.4.1-tt-vchart-introduction.md
new file mode 100644
index 0000000000..dd0939f212
--- /dev/null
+++ b/docs/assets/contributing/en/sourcecode/14.4.1-tt-vchart-introduction.md
@@ -0,0 +1,35 @@
+---
+title: 14.4.1 TT-VChart Introduction
+
+key words: VisActor,VChart,VTable,VStrory,VMind,VGrammar,VRender,Visualization,Chart,Data,Table,Graph,Gis,LLM
+---
+## Overview
+
+TT-vchart is the Douyin mini program encapsulated version of VChart, providing VChart encapsulation in the Feishu mini program environment.
+
+* For more information about the host environment of Byte mini programs, please refer to the official documentation: https://developer.open-douyin.com/docs/resource/zh-CN/mini-app/develop/tutorial/custom-component/custom-component
+
+
+
+## Core Code Structure
+
+The core implementation of the TT-vchart package consists of two parts:
+
+* Douyin mini program environment adaptation: The adaptation logic for the Douyin mini program environment includes necessary implementation code and declarations, which are stored in `packages/tt-vchart/src`;
+
+* VChart products: The capabilities related to the vchart chart library directly reference the packaged products of VChart, which are stored in `packages/tt-vchart/src/vchart/index.js`.
+
+
+
+In the following chapters, we will analyze the encapsulation of the TT-VChart component in detail.
+
+
+
+
+
+
+
+
+
+ # This document was revised and organized by the following personnel
+ [Xuanhun](https://github.com/xuanhun)
\ No newline at end of file
diff --git a/docs/assets/contributing/en/sourcecode/14.4.2-tt-vchart-source-code-analysis.md b/docs/assets/contributing/en/sourcecode/14.4.2-tt-vchart-source-code-analysis.md
new file mode 100644
index 0000000000..5bc50b51ad
--- /dev/null
+++ b/docs/assets/contributing/en/sourcecode/14.4.2-tt-vchart-source-code-analysis.md
@@ -0,0 +1,55 @@
+---
+title: 14.4.2 TT-VChart Source Code Explanation
+
+key words: VisActor,VChart,VTable,VStrory,VMind,VGrammar,VRender,Visualization,Chart,Data,Table,Graph,Gis,LLM
+---
+
+
+## Compatibility with Host Environment
+
+Douyin widgets provide the ability to create custom components (https://developer.open-douyin.com/docs/resource/zh-CN/mini-app/develop/tutorial/custom-component/custom-component). Each custom widget includes several parts:
+
+* index.js: Component registration logic
+
+* index.json: Component declaration
+
+* index.ttml: Component template content
+
+* index.ttss: Component style
+
+
+
+### Component Declaration
+
+To ensure VChart capabilities in the Douyin environment, the TT VChart custom component declares three canvases:
+
+* Render canvas: Used to render VChart chart content;
+
+* Hit canvas: Although called Hit Canvas, VChart no longer uses an additional canvas for graphic picking. This canvas is mainly used for additional canvas operations. For example, pixel matching logic in the word cloud layout algorithm and texture rendering logic need to be performed on an additional canvas;
+
+* Tooltip canvas: Used to render additional tooltip content, separating Render canvas and Tooltip canvas to avoid redrawing the entire canvas.
+
+
+
+### Component Registration
+
+Component registration includes properties and necessary lifecycle.
+
+**Component Properties:**
+
+* spec: Same as VChart's spec configuration, but an observer is added in the registration to monitor changes in the chart spec. When the spec is updated, vchart.updateSpec() will be automatically called;
+
+* options: Same as VChart's options configuration;
+
+* events: Same as VChart's registered events, vchart.on will be called during chart initialization to listen for corresponding events.
+
+**Component Methods:**
+
+* init: The core of VChart rendering requires a Canvas. In the init function, tt vchart will find the corresponding canvas component and initialize the VChart instance to execute the rendering process. The rendering process is the same as a regular VChart example;
+
+* bindEvent: Bind events and filter out potentially duplicate PC & mobile events in the Douyin environment.
+
+
+
+ # This document was revised and organized by the following personnel
+ [Xuanhun](https://github.com/xuanhun)
\ No newline at end of file
diff --git a/docs/assets/contributing/en/sourcecode/14.5.1-wx-vchart-introduction.md b/docs/assets/contributing/en/sourcecode/14.5.1-wx-vchart-introduction.md
new file mode 100644
index 0000000000..f3fa133fbc
--- /dev/null
+++ b/docs/assets/contributing/en/sourcecode/14.5.1-wx-vchart-introduction.md
@@ -0,0 +1,33 @@
+---
+title: 14.5.1 WX-VChart Introduction
+
+key words: VisActor,VChart,VTable,VStrory,VMind,VGrammar,VRender,Visualization,Chart,Data,Table,Graph,Gis,LLM
+---
+## Overview
+
+wx-vchart is the WeChat Mini Program encapsulation version of VChart, providing VChart encapsulation in the WeChat Mini Program environment.
+
+* For more introduction to the host environment of WeChat Mini Programs, please refer to the official documentation: https://developers.weixin.qq.com/miniprogram/dev/framework/
+
+
+
+## Core Code Structure
+
+The core implementation of the wx-vchart package consists of two parts:
+
+* WeChat Mini Program environment adaptation: The adaptation logic for the WeChat Mini Program environment includes necessary implementation code and declarations, which are stored in `packages/wx-vchart/miniprogram`;
+
+* VChart product: The capabilities related to the vchart chart library directly reference the packaged product of VChart, which is stored in `packages/wx-vchart/miniprogram/src/vchart/index.js`.
+
+
+
+In the following chapters, we will analyze the encapsulation of the WX-VChart component in detail.
+
+
+
+
+
+
+
+ # This document was revised and organized by the following personnel
+ [Xuanhun](https://github.com/xuanhun)
\ No newline at end of file
diff --git a/docs/assets/contributing/en/sourcecode/14.5.2-wx-vchart-source-code-analysis.md b/docs/assets/contributing/en/sourcecode/14.5.2-wx-vchart-source-code-analysis.md
new file mode 100644
index 0000000000..02aacad958
--- /dev/null
+++ b/docs/assets/contributing/en/sourcecode/14.5.2-wx-vchart-source-code-analysis.md
@@ -0,0 +1,53 @@
+---
+title: 14.5.2 WX-VChart Source Code Explanation
+
+key words: VisActor,VChart,VTable,VStrory,VMind,VGrammar,VRender,Visualization,Chart,Data,Table,Graph,Gis,LLM
+---
+## Compatibility with Host Environment
+
+WeChat mini-programs provide the ability to create custom components (https://developers.weixin.qq.com/miniprogram/dev/framework/custom-component/), a custom component consists of four files: `json` `wxml` `wxss` `js`:
+
+* index.js: Component registration logic
+
+* index.json: Component declaration
+
+* index.wxml: Component template content
+
+* index.wxss: Component style
+
+
+
+### Component Declaration
+
+To ensure the VChart capability in the WeChat environment, the WX VChart custom component declares three canvases:
+
+* Render canvas: Used to render VChart chart content;
+
+* Hit canvas: Although called Hit Canvas, VChart no longer uses an additional canvas for graphic picking. This canvas is mainly used for executing additional canvas operations. For example, pixel matching logic in the word cloud layout algorithm and texture rendering logic need to be performed on an additional canvas;
+
+* Tooltip canvas: Used to render additional tooltip content, separating Render canvas and Tooltip canvas to avoid redrawing the entire canvas.
+
+
+
+### Component Registration
+
+Component registration includes properties and necessary lifecycle.
+
+**Component Properties:**
+
+* spec: Same as VChart's spec configuration, but an observer is added in the registration to monitor changes in the chart spec. When the spec is updated, vchart.updateSpec() will be automatically called;
+
+* options: Same as VChart's options configuration;
+
+* events: Same as VChart's registered events, vchart.on will be called during chart initialization to listen to corresponding events.
+
+**Component Methods:**
+
+* init: The core of VChart rendering requires the Canvas, in the init function, wx vchart will find the corresponding canvas component and initialize the VChart instance to execute the rendering process. The rendering process is the same as a regular VChart example;
+
+* bindEvent: Bind events and filter out potentially duplicate PC & mobile events in the WeChat environment.
+
+
+
+ # This document was revised and organized by the following personnel
+ [Xuanhun](https://github.com/xuanhun)
\ No newline at end of file
diff --git a/docs/assets/contributing/en/sourcecode/14.6.1-openinula-vchart-introduction.md b/docs/assets/contributing/en/sourcecode/14.6.1-openinula-vchart-introduction.md
new file mode 100644
index 0000000000..804495283d
--- /dev/null
+++ b/docs/assets/contributing/en/sourcecode/14.6.1-openinula-vchart-introduction.md
@@ -0,0 +1,109 @@
+---
+title: 14.6.1 Introduction to Openinula-VChart
+
+key words: VisActor,VChart,VTable,VStrory,VMind,VGrammar,VRender,Visualization,Chart,Data,Table,Graph,Gis,LLM
+---
+# I. Component Introduction
+
+`@visactor/openinula-vchart` is a packaged version of the [VChart](https://visactor.io/vchart) chart library provided by [VisActor](https://visactor.io/) for [Openinula](https://openinula.net/). It offers a series of easy-to-use [Openinula](https://openinula.net/) components for conveniently creating various types of charts in the [Openinula](https://openinula.net/) development environment, including line charts, bar charts, pie charts, etc. The components of `@visactor/openinula-vchart` are highly customizable and extensible, allowing different chart effects to be achieved by passing different parameters and configurations.
+
+# II. **Component Overview**
+
+**openinula-vchart** provides two styles of components:
+
+1. **Unified entry components,** such as: `
+# III. Usage Examples
+
+### Unified Entry Mode
+
+
+```xml
+import { VChart } from '@visactor/openinula-vchart';
+
+const spec = {
+ type: 'bar',
+ data: [{ values: [...] }]
+};
+
+export default () =>
+
+);
+
+```
+
+
+
+
+ # This document was revised and organized by the following person
+ [玄魂](https://github.com/xuanhun)
\ No newline at end of file
diff --git a/docs/assets/contributing/en/sourcecode/14.6.2-openinula-vchart-source-code-analysis.md b/docs/assets/contributing/en/sourcecode/14.6.2-openinula-vchart-source-code-analysis.md
new file mode 100644
index 0000000000..cc1cc63dda
--- /dev/null
+++ b/docs/assets/contributing/en/sourcecode/14.6.2-openinula-vchart-source-code-analysis.md
@@ -0,0 +1,699 @@
+---
+title: 14.6.2 Openinula-VChart Source Code Explanation
+
+key words: VisActor,VChart,VTable,VStrory,VMind,VGrammar,VRender,Visualization,Chart,Data,Table,Graph,Gis,LLM
+---
+# 1. Core Mechanism
+
+As mentioned earlier, openinula-vchart provides two ways to declare components.
+
+1. **Unified entry components,** such as: `;
+
+// 创建 VChart 组件实例
+export const VChart = createChart('VChart', {
+ vchartConstrouctor: VChartCore // 构造器: VChart 核心库
+});
+
+```
+
+
+## Create Chart Container
+
+> packages/openinula-vchart/src/charts/BaseChart.tsx
+
+```Typescript
+export const createChart = (
+ componentName: string, // 组件名称, 用于配置class等
+ defaultProps?: Partial, // 组件属性,用于创建vchart实例、解析spec、挂载event等
+ callback?: (props: T, defaultProps?: Partial) => T // 回调,用于处理props
+) => {
+ // 基于BaseChart封装容器,并设置css属性、挂在ref等
+ const Com = withContainer(BaseChart as any, componentName, (props: T) => {
+ // 自定义属性处理
+ if (callback) {
+ return callback(props, defaultProps);
+ }
+
+ // 如果有默认属性,则将组件属性与默认属性合并
+ if (defaultProps) {
+ return Object.assign(props, defaultProps);
+ }
+
+ // 直接返回属性
+ return props;
+ });
+ // 设置组件识别标志
+ Com.displayName = componentName;
+ return Com;
+};
+
+```
+This step mainly involves the following based on the passed component name, component properties, and callbacks:
+
+1. Container encapsulation: Encapsulated based on `**BaseChart**`, during which CSS properties are set, refs are mounted, etc.
+
+1. Props handling: If there are custom property handling or default properties, perform custom handling or merge default properties
+
+1. displayName: Set the component identification flag for React debugging
+
+
+
+## BaseChart Chart Base Class
+
+> packages/openinula-vchart/src/charts/BaseChart.tsx
+
+### State Management
+
+
+```Typescript
+// 状态管理
+const [updateId, setUpdateId] = useState(0); // 图表更新计数器
+const chartContext = useRef({}); // 图表上下文引用
+useImperativeHandle(ref, () => chartContext.current?.chart); // 对外暴露图表实例
+const hasSpec = !!props.spec; // 是否存在全量 spec 配置
+
+// 视图与生命周期
+const [view, setView] = useState(null); // 底层 VGrammar 视图实例
+const isUnmount = useRef(false); // 组件卸载标记
+
+// 配置缓存
+const prevSpec = useRef(pickWithout(props, notSpecKeys)); // 过滤非 spec 属性后的配置
+const specFromChildren = useRef>(null); // 子组件生成的 spec
+
+// 事件系统
+const eventsBinded = React.useRef(null); // 已绑定的事件属性缓存
+
+// 性能优化
+const skipFunctionDiff = !!props.skipFunctionDiff; // 是否跳过函数对比
+
+// tooltip节点
+const [tooltipNode, setTooltipNode] = useState(null); // 自定义 tooltip 节点
+
+```
+Two core designs:
+
+1. Differential comparison optimization: Achieve precise configuration change detection through prevSpec and pickWithout
+
+2. Dual update mode: Distinguish between full spec updates and declarative component updates based on the hasSpec variable
+
+### Subcomponent spec analysis
+
+
+```Typescript
+const parseSpecFromChildren = (props: Props) => {
+ // 初始化空 spec 对象(排除 type/data/width/height 字段)
+ const specFromChildren: Omit = {};
+
+ // 将子组件转换为数组并遍历
+ toArray(props.children).map((child, index) => {
+ // 获取子组件的 parseSpec 方法(需组件实现)
+ const parseSpec = child && (child as any).type && (child as any).type.parseSpec;
+
+ if (parseSpec && (child as any).props) {
+ // 生成子组件 props:自动添加 componentId
+ const childProps = isNil((child as any).props.componentId)
+ ? {
+ ...(child as any).props,
+ componentId: getComponentId(child, index) // 生成唯一组件ID
+ }
+ : (child as any).props;
+
+ // 调用子组件的规范解析方法
+ const specResult = parseSpec(childProps);
+
+ // 合并解析结果到总 spec
+ if (specResult.isSingle) {
+ // 单例模式(如标题组件)
+ specFromChildren[specResult.specName] = specResult.spec;
+ } else {
+ // 多例模式(如多个数据标记)
+ if (!specFromChildren[specResult.specName]) {
+ specFromChildren[specResult.specName] = [];
+ }
+ specFromChildren[specResult.specName].push(specResult.spec);
+ }
+ }
+ });
+
+ return specFromChildren;
+};
+
+```
+The main task of this module is to parse the spec from subcomponents and mount it onto specFromChildren. Due to different component configuration modes, some are singleton and some are multiple instances, so the parsing logic is slightly different.
+
+Key content of this module:
+
+1. **Declarative Component Transformation:**
+
+Transform JSX declarations like this:
+
+```javascript
+
+
+
+
+```
+Convert to VChart standard JSON spec:
+
+```json
+{
+ "mark": [{ "type": "point" }],
+ "axes": [{ "orient": "bottom" }]
+}
+
+```
+1. **Component Unique Identifier:**
+
+The ID generated by getComponentId is structured as ComponentType-Index (e.g., `Mark-0`), used for:
+
+* Precise component update tracking
+
+* Avoiding duplicate component conflicts
+
+* Component identification during debugging
+
+3. **Dual-mode spec merge strategy:**
+
+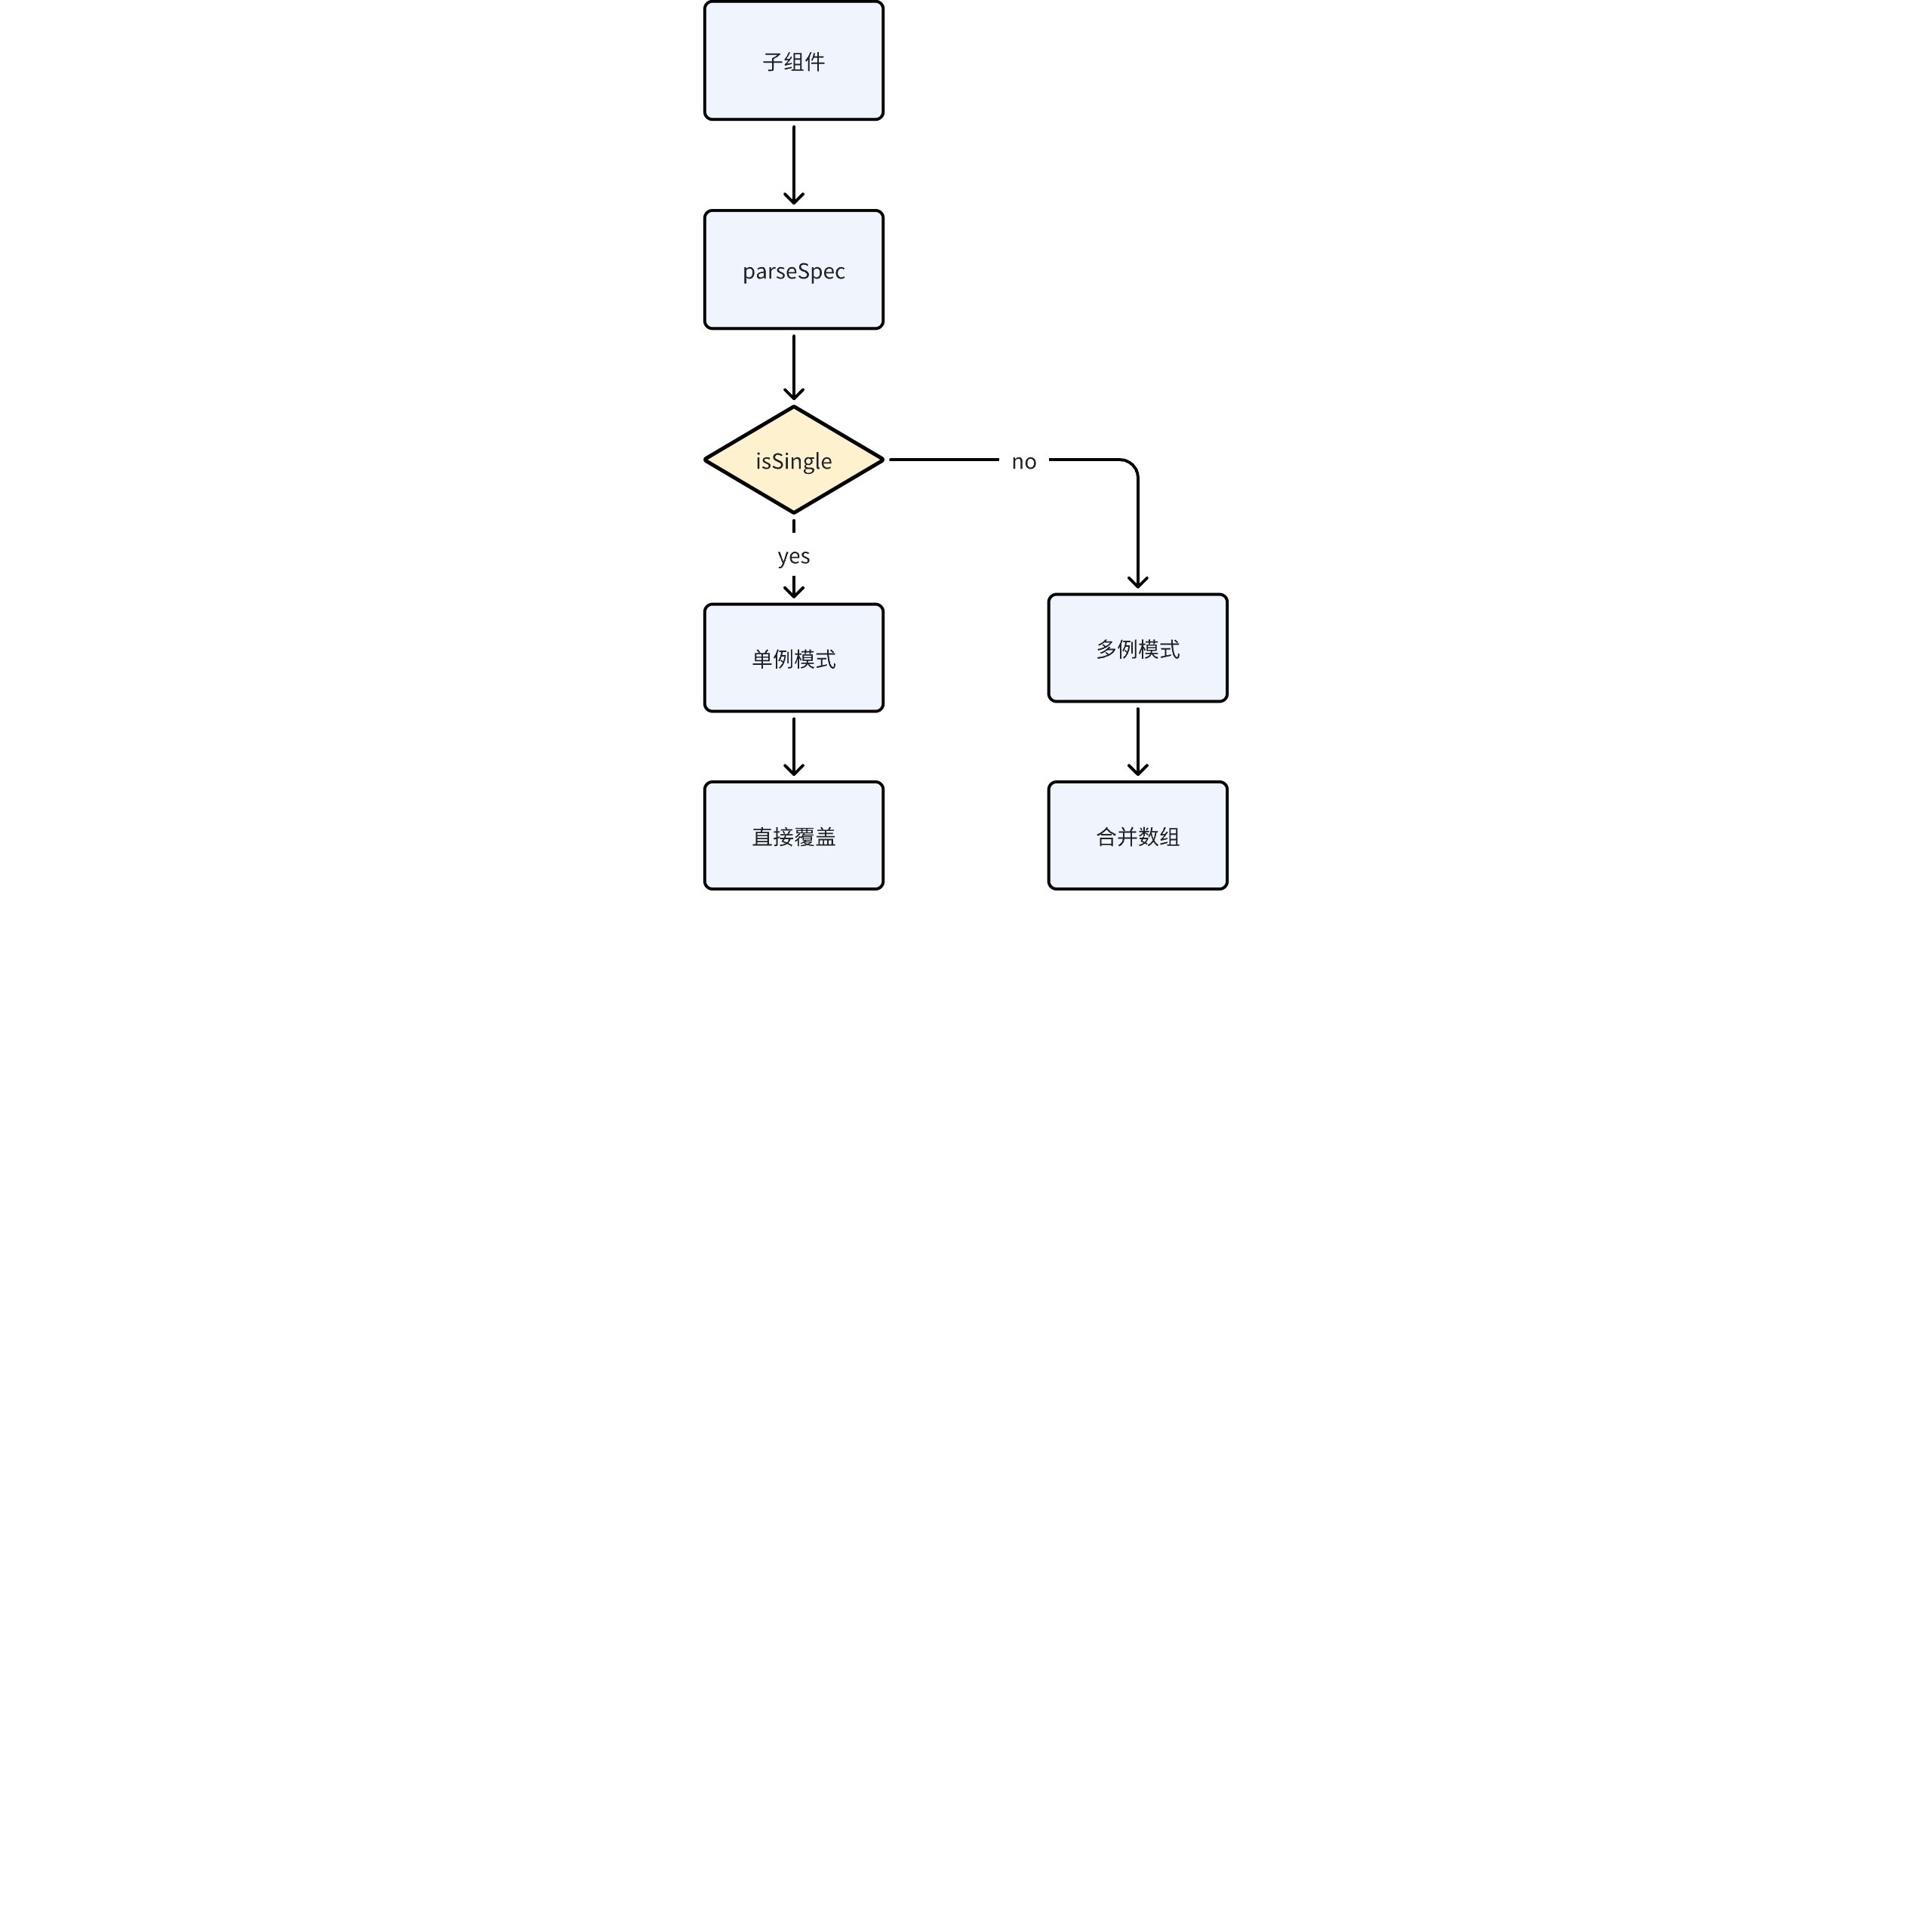 +
+**Typical Subcomponent Implementation**
+
+Take the Marker component as an example:
+
+```xml
+// 实现 parseSpec 方法
+class MarkPoint extends BaseComponent {
+ static parseSpec(props: MarkProps) {
+ return {
+ specName: 'markPoint', // 对应 spec 中的字段名
+ isSingle: false, // 允许多个 MarkPoint 组件
+ spec: {
+ type: props.type,
+ style: props.style
+ }
+ };
+ }
+}
+
+```
+### Create Chart
+
+
+```xml
+const createChart = (props: Props) => {
+ // 1. 实例化图表(利用传入的图表构造器)
+ const cs = new props.vchartConstrouctor(
+ parseSpec(props), // 合并后的图表spec
+ {
+ ...props.options, // 透传图表配置
+ onError: props.onError, // 异常处理回调
+ autoFit: true, // 开启自动尺寸适配
+ dom: props.container // 绑定 DOM 容器
+ }
+ );
+
+ // 2. 更新上下文引用
+ chartContext.current = { ...chartContext.current, chart: cs };
+
+ // 3. 重置卸载标记
+ isUnmount.current = false;
+};
+
+```
+#### spec analysis
+
+
+```Typescript
+const parseSpec = (props: Props) => {
+ // 决策逻辑:优先使用全量 spec 配置
+ let spec: ISpec = undefined;
+
+ // 全量 spec 模式(直接使用传入的 spec)
+ if (hasSpec && props.spec) {
+ spec = props.spec;
+ }
+ // 声明式组件模式(合并 props 和子组件生成的 spec)
+ else {
+ spec = {
+ ...prevSpec.current, // 来自组件 props 的配置
+ ...specFromChildren.current // 来自子组件解析的配置
+ } as ISpec;
+ }
+
+ // 自定义 tooltip 处理(React 组件与 VChart 的桥接)
+ const tooltipSpec = initCustomTooltip(setTooltipNode, props, spec.tooltip);
+ if (tooltipSpec) {
+ spec.tooltip = tooltipSpec; // 覆盖默认 tooltip 配置
+ }
+
+ return spec;
+};
+
+```
+### Render Charts
+
+
+```xml
+ const renderChart = () => {
+ if (chartContext.current.chart) {
+ chartContext.current.chart.renderSync({
+ reuse: false
+ });
+ handleChartRender();
+ }
+ };
+
+```
+Get the mounted instance through the chartContext and call the instance's `renderSync` method to render the chart.
+
+### Event Binding & Context Update
+
+```Typescript
+const handleChartRender = () => {
+ // 1. 安全检查:确保组件未卸载且图表实例存在
+ if (!isUnmount.current) {
+ if (!chartContext.current || !chartContext.current.chart) {
+ return;
+ }
+
+ // 2. 事件系统:重新绑定所有图表事件
+ bindEventsToChart(chartContext.current.chart, props, eventsBinded.current, CHART_EVENTS);
+
+ // 3. 获取底层视图实例
+ const newView = chartContext.current.chart.getCompiler().getVGrammarView();
+
+ // 4. 状态更新:触发子组件重渲染
+ setUpdateId(updateId + 1);
+
+ // 5. 生命周期回调:通知父组件渲染完成
+ if (props.onReady) {
+ props.onReady(chartContext.current.chart, updateId === 0); // 区分首次渲染
+ }
+
+ // 6. 更新视图上下文
+ setView(newView);
+ }
+};
+
+```
+This section mainly executes the processing logic after the chart rendering is completed, mainly implementing:
+
+1. Event Update:
+
+Dynamic update of event listeners is achieved through `bindEventsToChart`, using a differential comparison strategy to avoid duplicate bindings.
+
+It is particularly important to remount events after the chart is re-rendered (such as data updates) to ensure the correctness of interactive responses.
+
+1. Bidirectional State Synchronization
+
+Trigger child component updates through setUpdateId (using the key value change mechanism), while storing the VGrammar view instance in the React context to achieve state synchronization between the Canvas layer and the React component layer. The judgment of updateId === 0 distinguishes the first rendering.
+
+1. Lifecycle Notification
+
+Achieve parent-child communication in a layered architecture through the onReady callback. After the underlying chart completes the rendering pipeline (layout, drawing, animation), notify the business layer to perform subsequent operations (such as data fetching, associated interactions, etc.).
+
+# Three, Series
+
+
+
+
+**Typical Subcomponent Implementation**
+
+Take the Marker component as an example:
+
+```xml
+// 实现 parseSpec 方法
+class MarkPoint extends BaseComponent {
+ static parseSpec(props: MarkProps) {
+ return {
+ specName: 'markPoint', // 对应 spec 中的字段名
+ isSingle: false, // 允许多个 MarkPoint 组件
+ spec: {
+ type: props.type,
+ style: props.style
+ }
+ };
+ }
+}
+
+```
+### Create Chart
+
+
+```xml
+const createChart = (props: Props) => {
+ // 1. 实例化图表(利用传入的图表构造器)
+ const cs = new props.vchartConstrouctor(
+ parseSpec(props), // 合并后的图表spec
+ {
+ ...props.options, // 透传图表配置
+ onError: props.onError, // 异常处理回调
+ autoFit: true, // 开启自动尺寸适配
+ dom: props.container // 绑定 DOM 容器
+ }
+ );
+
+ // 2. 更新上下文引用
+ chartContext.current = { ...chartContext.current, chart: cs };
+
+ // 3. 重置卸载标记
+ isUnmount.current = false;
+};
+
+```
+#### spec analysis
+
+
+```Typescript
+const parseSpec = (props: Props) => {
+ // 决策逻辑:优先使用全量 spec 配置
+ let spec: ISpec = undefined;
+
+ // 全量 spec 模式(直接使用传入的 spec)
+ if (hasSpec && props.spec) {
+ spec = props.spec;
+ }
+ // 声明式组件模式(合并 props 和子组件生成的 spec)
+ else {
+ spec = {
+ ...prevSpec.current, // 来自组件 props 的配置
+ ...specFromChildren.current // 来自子组件解析的配置
+ } as ISpec;
+ }
+
+ // 自定义 tooltip 处理(React 组件与 VChart 的桥接)
+ const tooltipSpec = initCustomTooltip(setTooltipNode, props, spec.tooltip);
+ if (tooltipSpec) {
+ spec.tooltip = tooltipSpec; // 覆盖默认 tooltip 配置
+ }
+
+ return spec;
+};
+
+```
+### Render Charts
+
+
+```xml
+ const renderChart = () => {
+ if (chartContext.current.chart) {
+ chartContext.current.chart.renderSync({
+ reuse: false
+ });
+ handleChartRender();
+ }
+ };
+
+```
+Get the mounted instance through the chartContext and call the instance's `renderSync` method to render the chart.
+
+### Event Binding & Context Update
+
+```Typescript
+const handleChartRender = () => {
+ // 1. 安全检查:确保组件未卸载且图表实例存在
+ if (!isUnmount.current) {
+ if (!chartContext.current || !chartContext.current.chart) {
+ return;
+ }
+
+ // 2. 事件系统:重新绑定所有图表事件
+ bindEventsToChart(chartContext.current.chart, props, eventsBinded.current, CHART_EVENTS);
+
+ // 3. 获取底层视图实例
+ const newView = chartContext.current.chart.getCompiler().getVGrammarView();
+
+ // 4. 状态更新:触发子组件重渲染
+ setUpdateId(updateId + 1);
+
+ // 5. 生命周期回调:通知父组件渲染完成
+ if (props.onReady) {
+ props.onReady(chartContext.current.chart, updateId === 0); // 区分首次渲染
+ }
+
+ // 6. 更新视图上下文
+ setView(newView);
+ }
+};
+
+```
+This section mainly executes the processing logic after the chart rendering is completed, mainly implementing:
+
+1. Event Update:
+
+Dynamic update of event listeners is achieved through `bindEventsToChart`, using a differential comparison strategy to avoid duplicate bindings.
+
+It is particularly important to remount events after the chart is re-rendered (such as data updates) to ensure the correctness of interactive responses.
+
+1. Bidirectional State Synchronization
+
+Trigger child component updates through setUpdateId (using the key value change mechanism), while storing the VGrammar view instance in the React context to achieve state synchronization between the Canvas layer and the React component layer. The judgment of updateId === 0 distinguishes the first rendering.
+
+1. Lifecycle Notification
+
+Achieve parent-child communication in a layered architecture through the onReady callback. After the underlying chart completes the rendering pipeline (layout, drawing, animation), notify the business layer to perform subsequent operations (such as data fetching, associated interactions, etc.).
+
+# Three, Series
+
+
+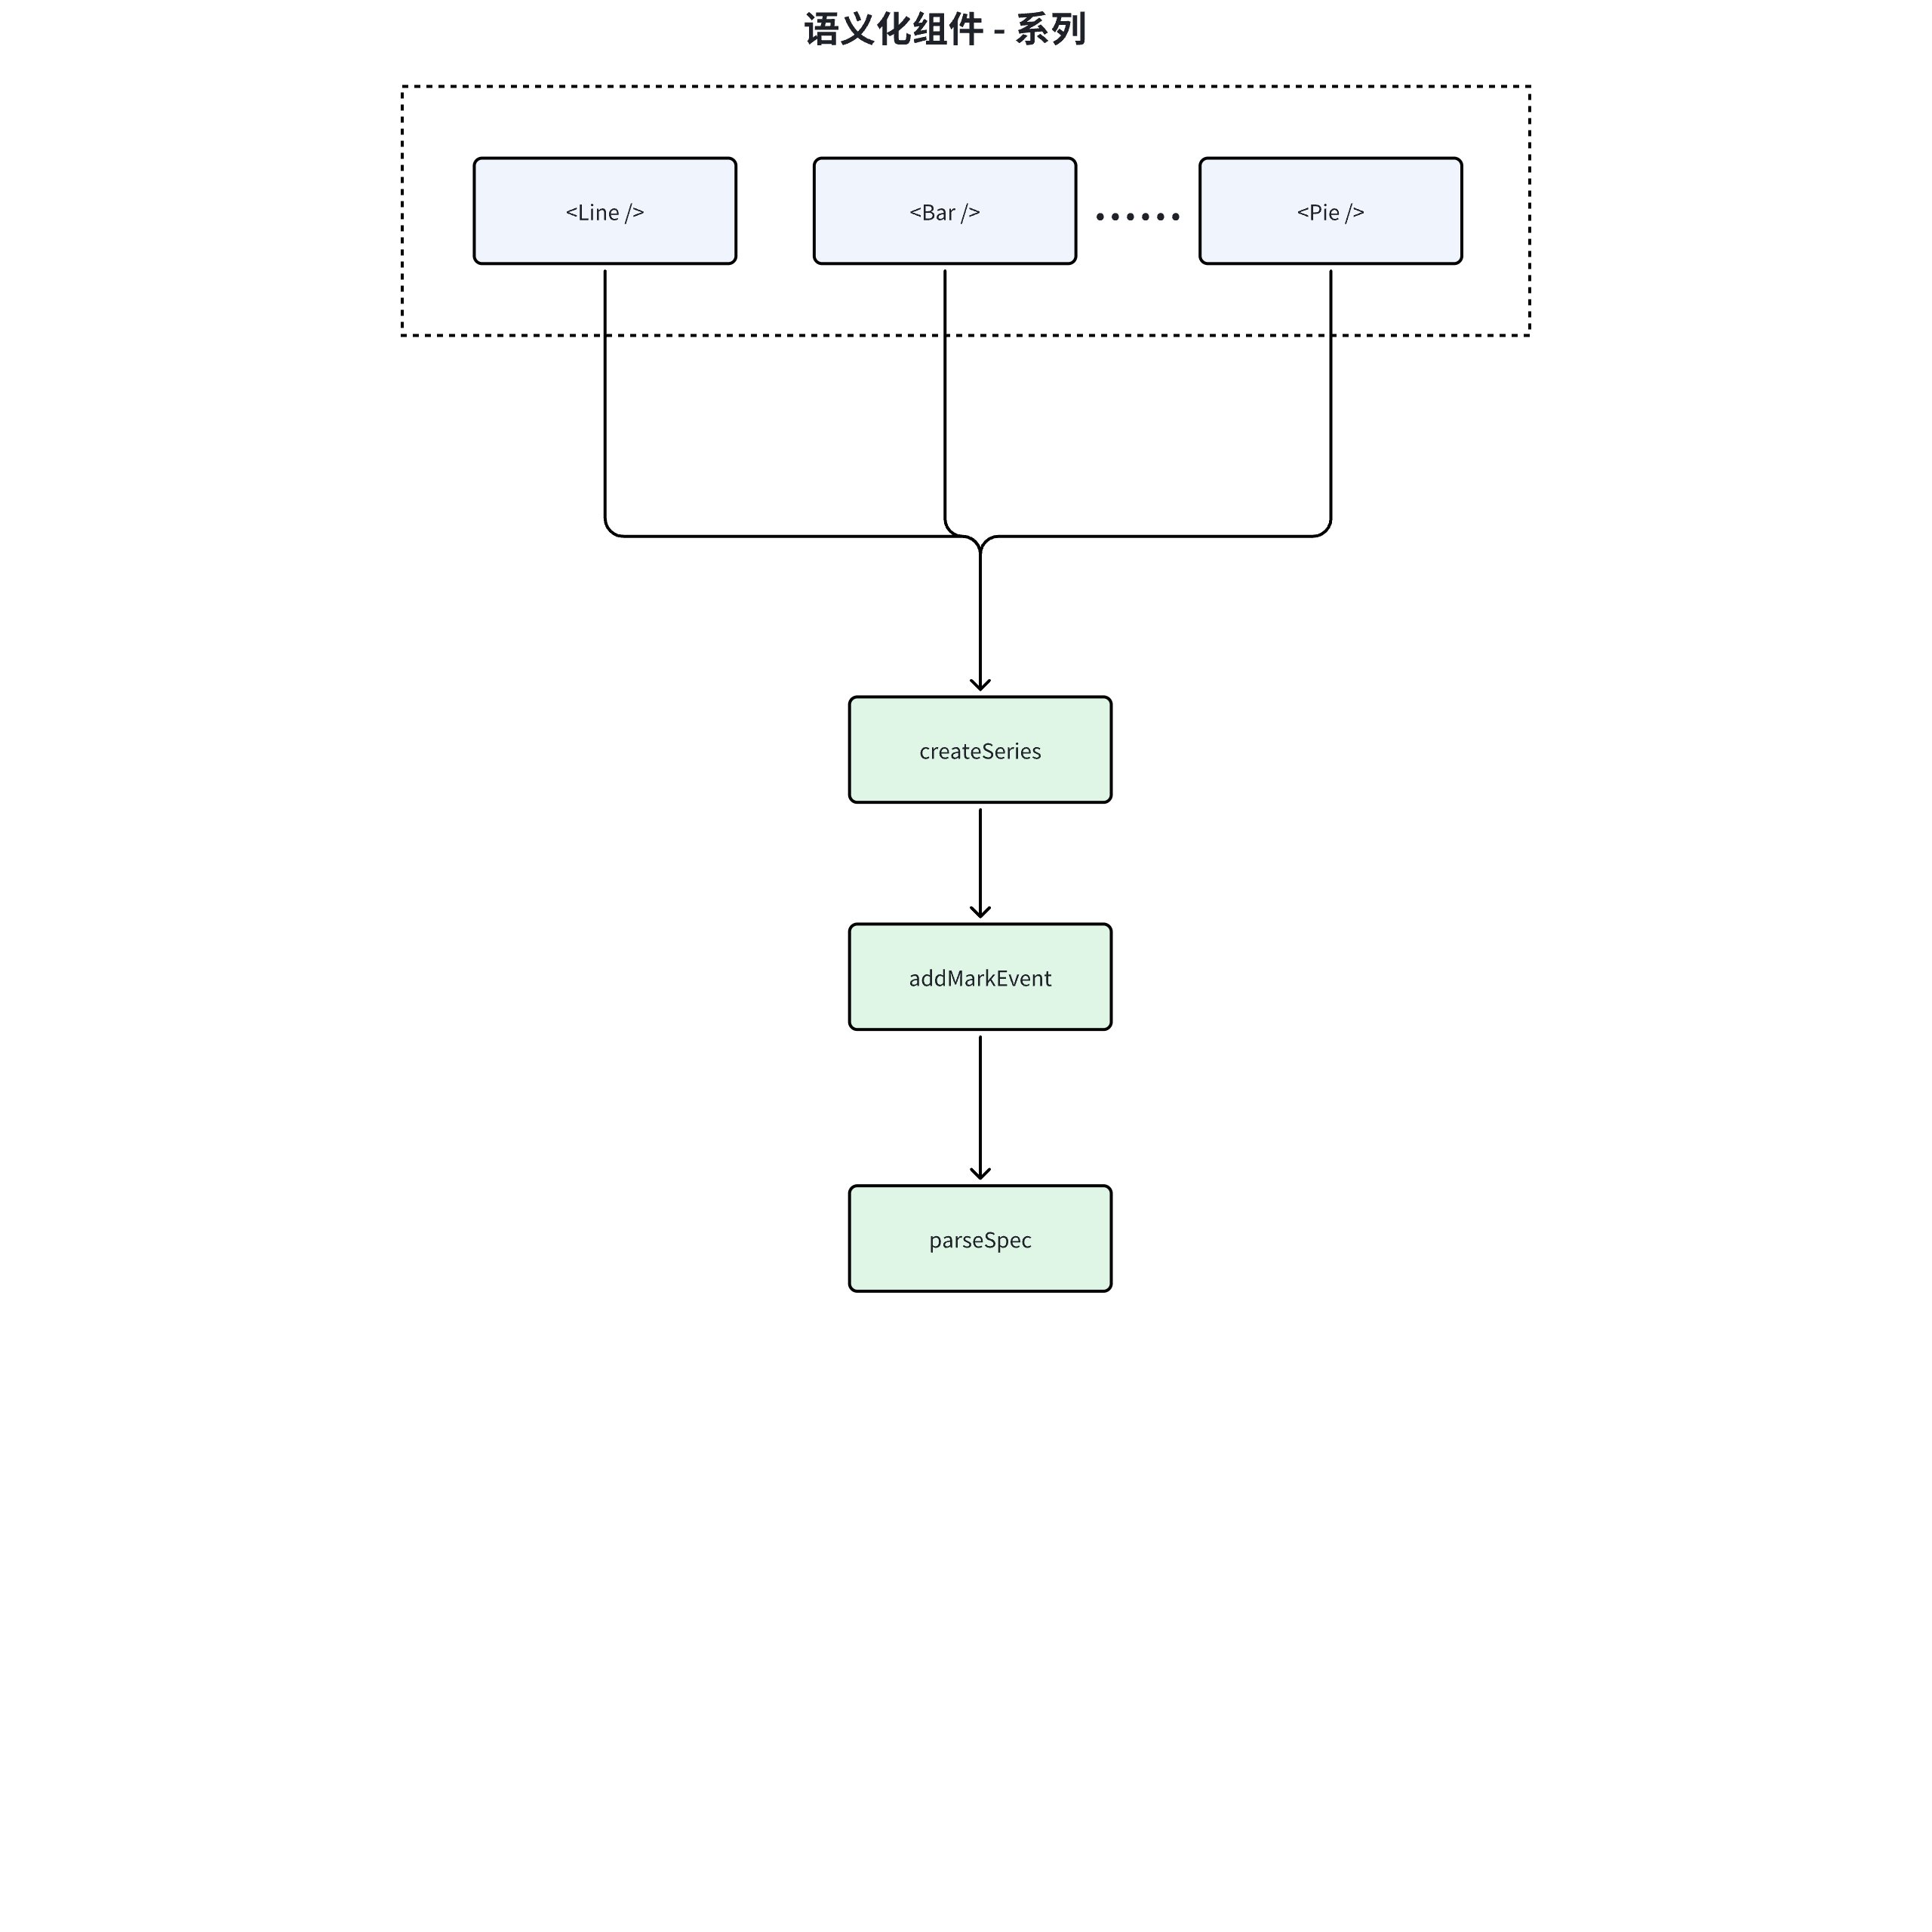 +
+
+
+## Event Binding
+
+
+```Typescript
+const addMarkEvent = (events: EventsProps) => {
+ // 1. 安全校验:确保事件对象和图表实例存在
+ if (!events || !context.chart) {
+ return;
+ }
+
+ // 2. 清理旧事件:遍历解除所有已绑定的事件监听
+ if (bindedEvents.current) {
+ Object.keys(bindedEvents.current).forEach(eventKey => {
+ context.chart.off(REACT_TO_VCHART_EVENTS[eventKey], bindedEvents.current[eventKey]);
+ bindedEvents.current[eventKey] = null; // 清除引用
+ });
+ }
+
+ // 3. 绑定新事件:动态建立 React 事件到 VChart 的映射关系
+ events &&
+ Object.keys(events).forEach(eventKey => {
+ if (!bindedEvents.current?.[eventKey]) {
+ // 通过事件类型映射表转换事件名
+ context.chart.on(REACT_TO_VCHART_EVENTS[eventKey], handleEvent);
+
+ // 更新绑定记录
+ if (!bindedEvents.current) {
+ bindedEvents.current = {};
+ }
+ bindedEvents.current[eventKey] = handleEvent;
+ }
+ });
+};
+
+```
+1. Input Check: The function receives events as a parameter. If events is empty or context.chart does not exist, the function will return immediately without further operations.
+
+1. Unbind Old Events:
+
+If bindedEvents.current exists, it means events have been bound before. At this point, each event in bindedEvents.current will be iterated over, and these events will be unbound using the context.chart.off method, setting the value of the corresponding event key in bindedEvents.current to null.
+
+1. Bind New Events:
+
+If events exist, each event in events will be iterated over.
+
+For events that do not exist in bindedEvents.current, i.e., the event context, the handleEvent will be bound to the corresponding event using the context.chart.on method, and the context will be updated.
+
+## Event Clearing
+
+```xml
+const removeMarkEvent = () => {
+ addMarkEvent({});
+};
+
+```
+When the component is uninstalled, the events will be cleared
+
+## spec analysis
+
+```Typescript
+ (Comp as any).parseSpec = (compProps: T & { updateId?: number; componentId?: string }) => {
+ // 从组件属性中移除不需要的键,生成新的系列规范
+ const newSeriesSpec = pickWithout
+
+
+
+## Event Binding
+
+
+```Typescript
+const addMarkEvent = (events: EventsProps) => {
+ // 1. 安全校验:确保事件对象和图表实例存在
+ if (!events || !context.chart) {
+ return;
+ }
+
+ // 2. 清理旧事件:遍历解除所有已绑定的事件监听
+ if (bindedEvents.current) {
+ Object.keys(bindedEvents.current).forEach(eventKey => {
+ context.chart.off(REACT_TO_VCHART_EVENTS[eventKey], bindedEvents.current[eventKey]);
+ bindedEvents.current[eventKey] = null; // 清除引用
+ });
+ }
+
+ // 3. 绑定新事件:动态建立 React 事件到 VChart 的映射关系
+ events &&
+ Object.keys(events).forEach(eventKey => {
+ if (!bindedEvents.current?.[eventKey]) {
+ // 通过事件类型映射表转换事件名
+ context.chart.on(REACT_TO_VCHART_EVENTS[eventKey], handleEvent);
+
+ // 更新绑定记录
+ if (!bindedEvents.current) {
+ bindedEvents.current = {};
+ }
+ bindedEvents.current[eventKey] = handleEvent;
+ }
+ });
+};
+
+```
+1. Input Check: The function receives events as a parameter. If events is empty or context.chart does not exist, the function will return immediately without further operations.
+
+1. Unbind Old Events:
+
+If bindedEvents.current exists, it means events have been bound before. At this point, each event in bindedEvents.current will be iterated over, and these events will be unbound using the context.chart.off method, setting the value of the corresponding event key in bindedEvents.current to null.
+
+1. Bind New Events:
+
+If events exist, each event in events will be iterated over.
+
+For events that do not exist in bindedEvents.current, i.e., the event context, the handleEvent will be bound to the corresponding event using the context.chart.on method, and the context will be updated.
+
+## Event Clearing
+
+```xml
+const removeMarkEvent = () => {
+ addMarkEvent({});
+};
+
+```
+When the component is uninstalled, the events will be cleared
+
+## spec analysis
+
+```Typescript
+ (Comp as any).parseSpec = (compProps: T & { updateId?: number; componentId?: string }) => {
+ // 从组件属性中移除不需要的键,生成新的系列规范
+ const newSeriesSpec = pickWithout(compProps, notSpecKeys);
+
+ // 为每个标记添加默认的 ID
+ addMarkId(newSeriesSpec, compProps.id ?? compProps.componentId);
+
+ // 如果提供了 type 参数,则将其添加到spec中
+ if (!isNil(type)) {
+ (newSeriesSpec as any).type = type;
+ }
+
+ // 返回包含系列规范和规范名称的对象
+ return {
+ spec: newSeriesSpec,
+ specName: 'series'
+ };
+ };
+
+```
+series is a declarative component, and parseSpec will be called by the parent component to parse and add it to the overall spec.
+
+In series, the main functions of `parseSpec` are:
+
+1. Filter out unnecessary attributes to generate a new series specification.
+
+2. Add a default ID for each mark.
+
+3. If a type parameter is provided, add it to the series specification.
+
+4. Return an object containing the series specification and specification name.
+
+# Four, Component
+
+
+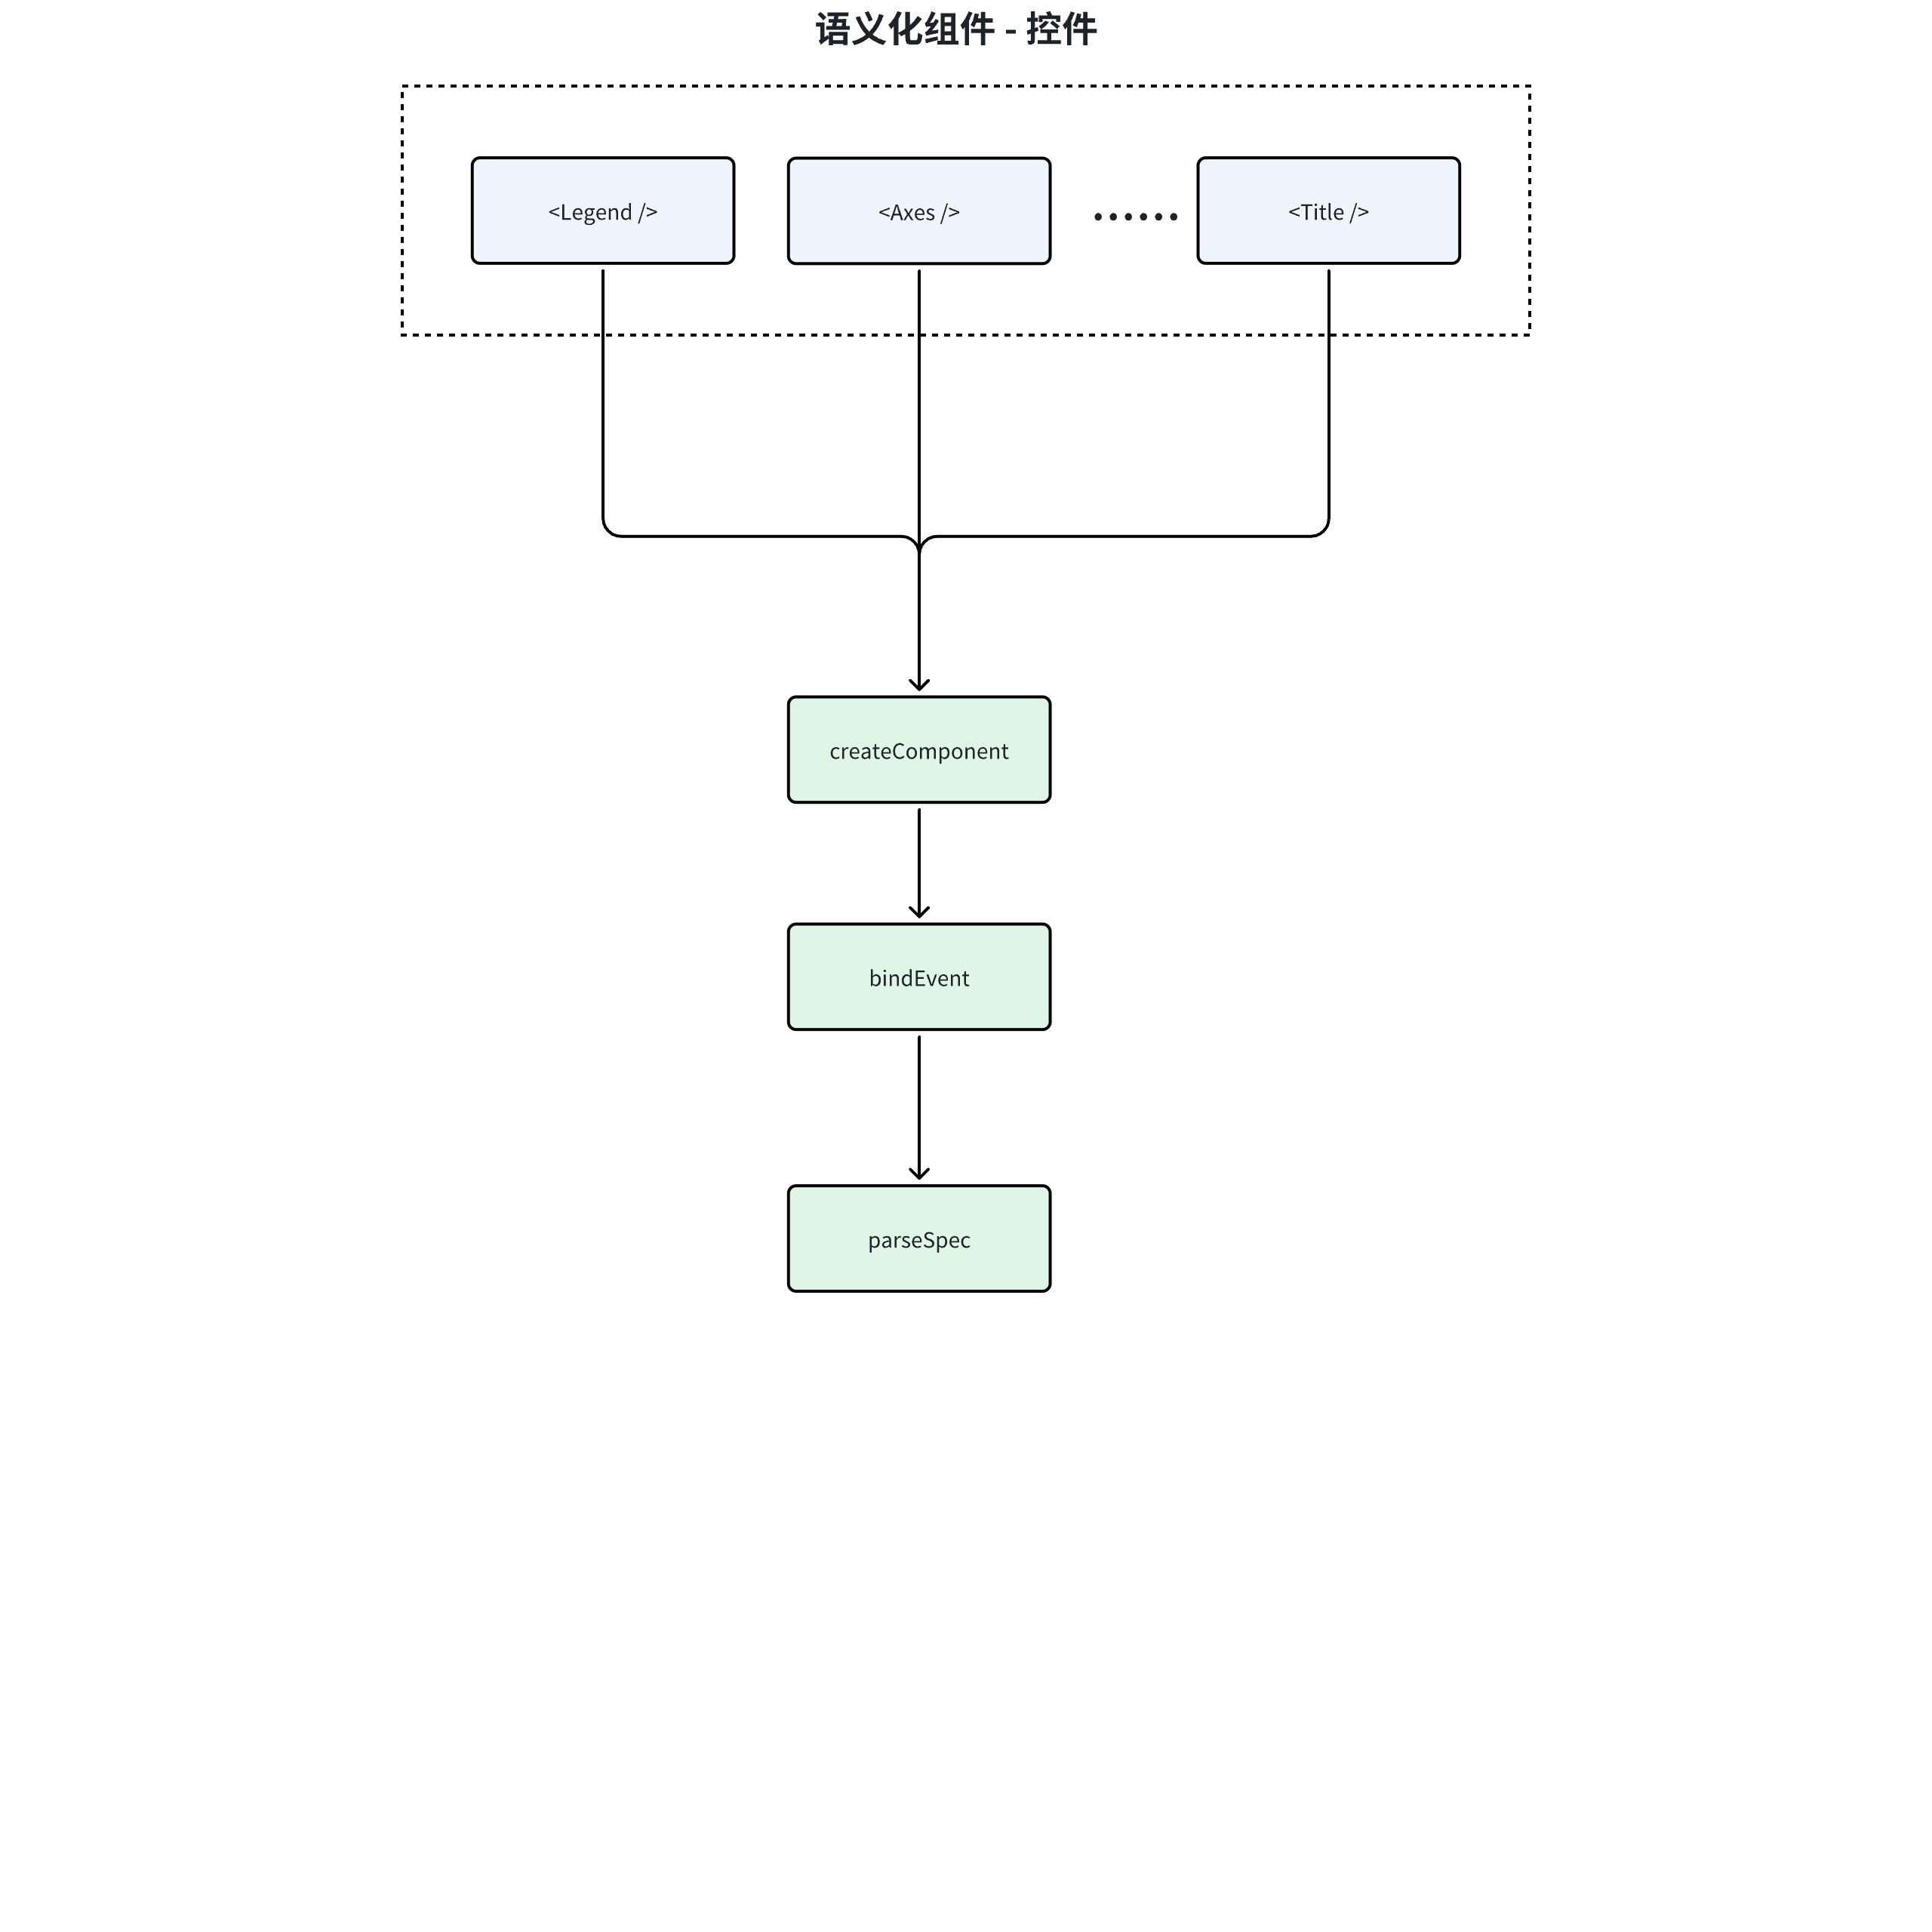 +
+## Event Binding
+
+```Typescript
+// 检查是否需要更新(通过 updateId 变化检测)
+if (props.updateId !== updateId.current) {
+ // 更新当前记录的版本号,保持与父组件同步
+ updateId.current = props.updateId;
+
+ // 重新绑定图表事件(仅当组件支持事件时执行)
+ const hasPrevEventsBinded = supportedEvents
+ ? bindEventsToChart( // 调用事件绑定工具方法
+ context.chart, // 从上下文获取图表实例
+ props, // 当前组件属性(含新事件处理器)
+ eventsBinded.current, // 之前绑定的事件缓存
+ supportedEvents // 该组件支持的事件类型映射
+ )
+ : false;
+
+ // 如果事件绑定成功,更新事件缓存引用
+ if (hasPrevEventsBinded) {
+ eventsBinded.current = props; // 保存当前事件配置用于下次差异比较
+ }
+}
+
+```
+* Update Detection:
+
+Determine whether the component needs to be updated by checking if props.updateId !== updateId.current. The updateId is an update identifier from the parent component (usually a chart) used to trigger the update process of the child component.
+
+* Event Rebinding
+
+When an update is detected, call the bindEventsToChart method to rebind events. Here, a conditional check is used:
+
+* If the component supports events (supportedEvents exists), perform event binding
+
+* After successful binding, update the eventsBinded cache to record the currently bound event properties
+
+* State Synchronization - Update updateId.current to the latest value to ensure the accuracy of subsequent update detections.
+
+## spec Parsing
+
+```Typescript
+ (Comp as any).parseSpec = (props: T & { updateId?: number; componentId?: string }) => {
+ // 使用 pickWithout 函数从 props 中移除 notSpecKeys 中指定的键,得到新的组件配置
+ const newComponentSpec: Partial
+
+## Event Binding
+
+```Typescript
+// 检查是否需要更新(通过 updateId 变化检测)
+if (props.updateId !== updateId.current) {
+ // 更新当前记录的版本号,保持与父组件同步
+ updateId.current = props.updateId;
+
+ // 重新绑定图表事件(仅当组件支持事件时执行)
+ const hasPrevEventsBinded = supportedEvents
+ ? bindEventsToChart( // 调用事件绑定工具方法
+ context.chart, // 从上下文获取图表实例
+ props, // 当前组件属性(含新事件处理器)
+ eventsBinded.current, // 之前绑定的事件缓存
+ supportedEvents // 该组件支持的事件类型映射
+ )
+ : false;
+
+ // 如果事件绑定成功,更新事件缓存引用
+ if (hasPrevEventsBinded) {
+ eventsBinded.current = props; // 保存当前事件配置用于下次差异比较
+ }
+}
+
+```
+* Update Detection:
+
+Determine whether the component needs to be updated by checking if props.updateId !== updateId.current. The updateId is an update identifier from the parent component (usually a chart) used to trigger the update process of the child component.
+
+* Event Rebinding
+
+When an update is detected, call the bindEventsToChart method to rebind events. Here, a conditional check is used:
+
+* If the component supports events (supportedEvents exists), perform event binding
+
+* After successful binding, update the eventsBinded cache to record the currently bound event properties
+
+* State Synchronization - Update updateId.current to the latest value to ensure the accuracy of subsequent update detections.
+
+## spec Parsing
+
+```Typescript
+ (Comp as any).parseSpec = (props: T & { updateId?: number; componentId?: string }) => {
+ // 使用 pickWithout 函数从 props 中移除 notSpecKeys 中指定的键,得到新的组件配置
+ const newComponentSpec: Partial = pickWithout(props, notSpecKeys);
+
+ // 返回一个包含新组件配置、specName 和 isSingle 的对象
+ return {
+ spec: newComponentSpec,
+ specName,
+ isSingle
+ };
+ };
+
+```
+* specName is used to determine the mounted specKey
+
+* isSingle flag is used by the parent component to determine if it is a singleton when parsing the spec
+
+# Five, Event Handling
+
+> packages/openinula-vchart/src/eventsUtils.ts
+
+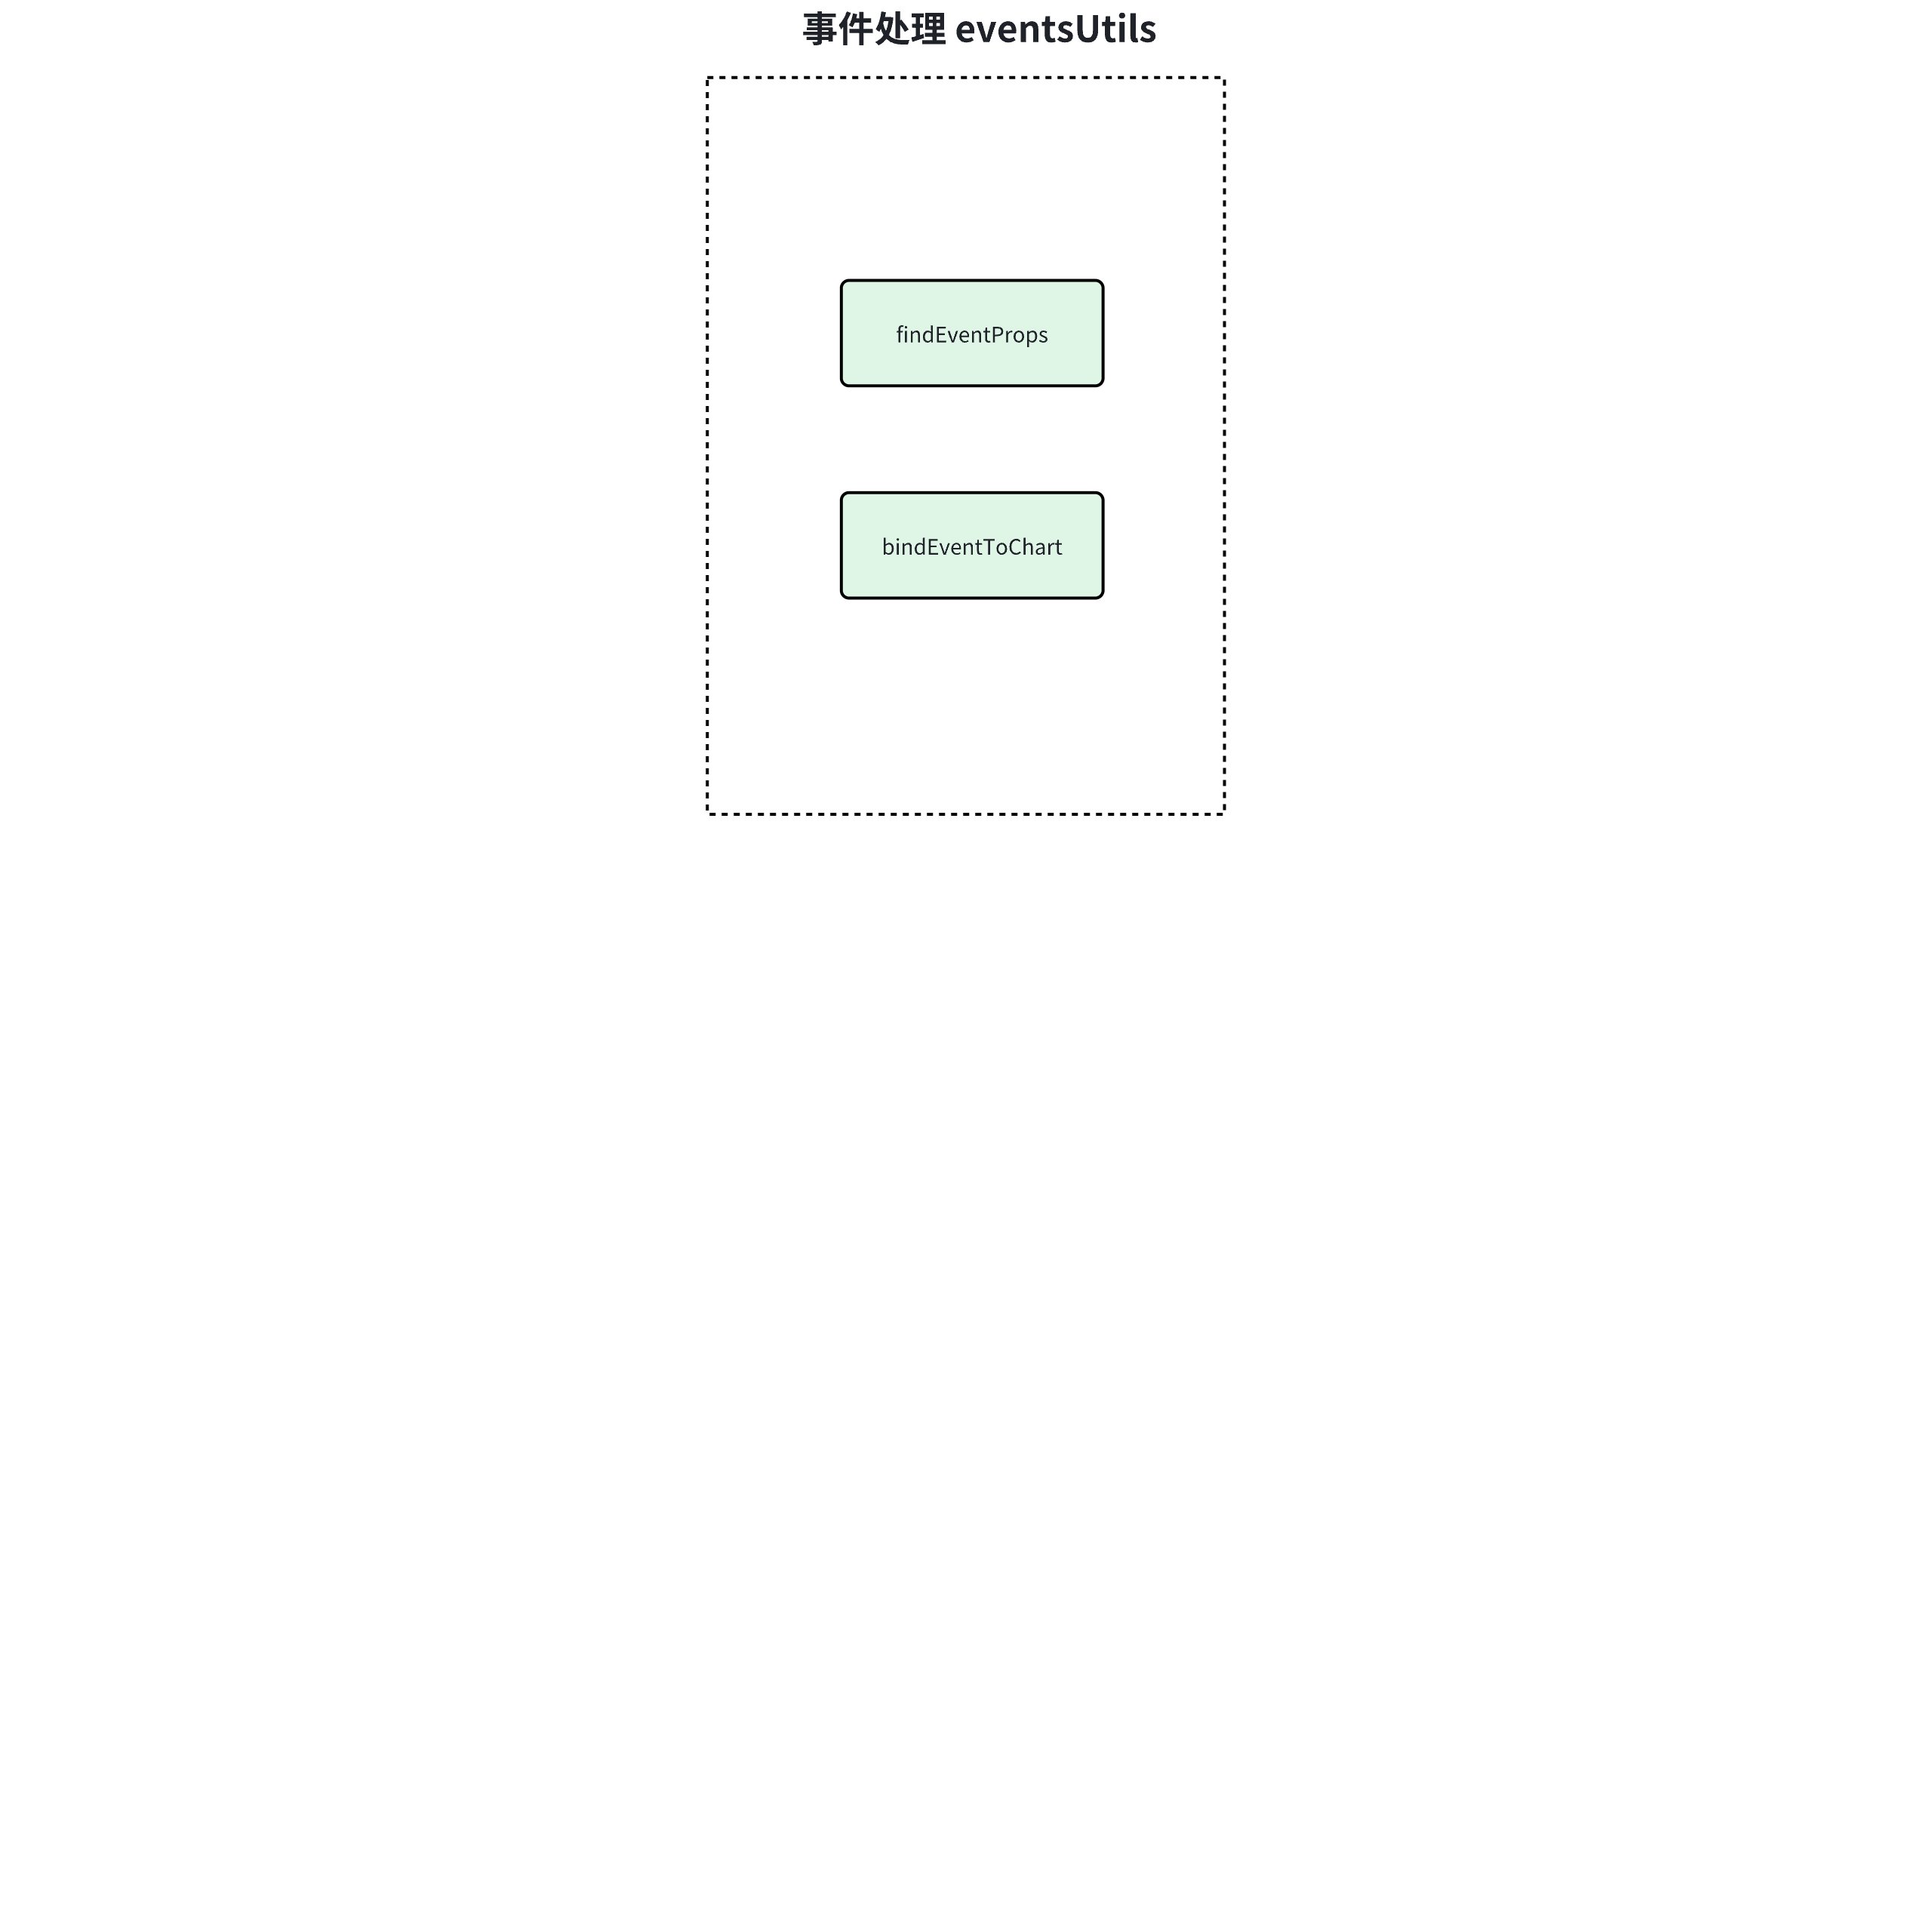 +
+## Event Extraction
+
+```Typescript
+// 泛型方法:从组件属性中提取有效事件配置
+export const findEventProps =
+
+## Event Extraction
+
+```Typescript
+// 泛型方法:从组件属性中提取有效事件配置
+export const findEventProps = (
+ props: T, // 组件属性集合
+ supportedEvents: Record = REACT_TO_VCHART_EVENTS // 允许的事件映射表
+): EventsProps => {
+ const result: EventsProps = {}; // 存储过滤后的事件配置
+
+ // 遍历所有属性键
+ Object.keys(props).forEach(key => {
+ // 双重校验:1. 是否为支持的事件类型 2. 是否存在有效回调函数
+ if (supportedEvents[key] && props[key]) {
+ result[key] = props[key]; // 收集符合条件的事件处理器
+ }
+ });
+
+ return result; // 返回纯净的事件配置对象
+};
+
+```
+## Binding Events
+
+
+```Typescript
+export const bindEventsToChart = (
+ chart: IVChart, // 图表实例
+ newProps?: T | null, // 新事件属性
+ prevProps?: T | null, // 旧事件属性
+ supportedEvents: Record = REACT_TO_VCHART_EVENTS // 事件映射表
+) => {
+ // 安全检查:排除无效调用
+ if ((!newProps && !prevProps) || !chart) {
+ return false;
+ }
+
+ // 新旧事件属性过滤(通过之前分析的 findEventProps 方法)
+ const prevEventProps = prevProps ? findEventProps(prevProps, supportedEvents) : null;
+ const newEventProps = newProps ? findEventProps(newProps, supportedEvents) : null;
+
+ // 解绑阶段:清理过期事件监听
+ if (prevEventProps) {
+ Object.keys(prevEventProps).forEach(eventKey => {
+ // 差异判断:新属性不存在该事件 或 事件处理器发生变化
+ if (!newEventProps || !newEventProps[eventKey] || newEventProps[eventKey] !== prevEventProps[eventKey]) {
+ chart.off(supportedEvents[eventKey], prevProps[eventKey]); // 解除旧监听
+ }
+ });
+ }
+
+ // 绑定阶段:注册新事件监听
+ if (newEventProps) {
+ Object.keys(newEventProps).forEach(eventKey => {
+ // 差异判断:旧属性不存在该事件 或 事件处理器发生变化
+ if (!prevEventProps || !prevEventProps[eventKey] || prevEventProps[eventKey] !== newEventProps[eventKey]) {
+ chart.on(supportedEvents[eventKey], newEventProps[eventKey]); // 注册新监听
+ }
+ });
+ }
+
+ return true; // 标识操作完成
+};
+
+```
+
+
+# Six, Global Communication
+
+> packages/openinula-vchart/src/context
+
+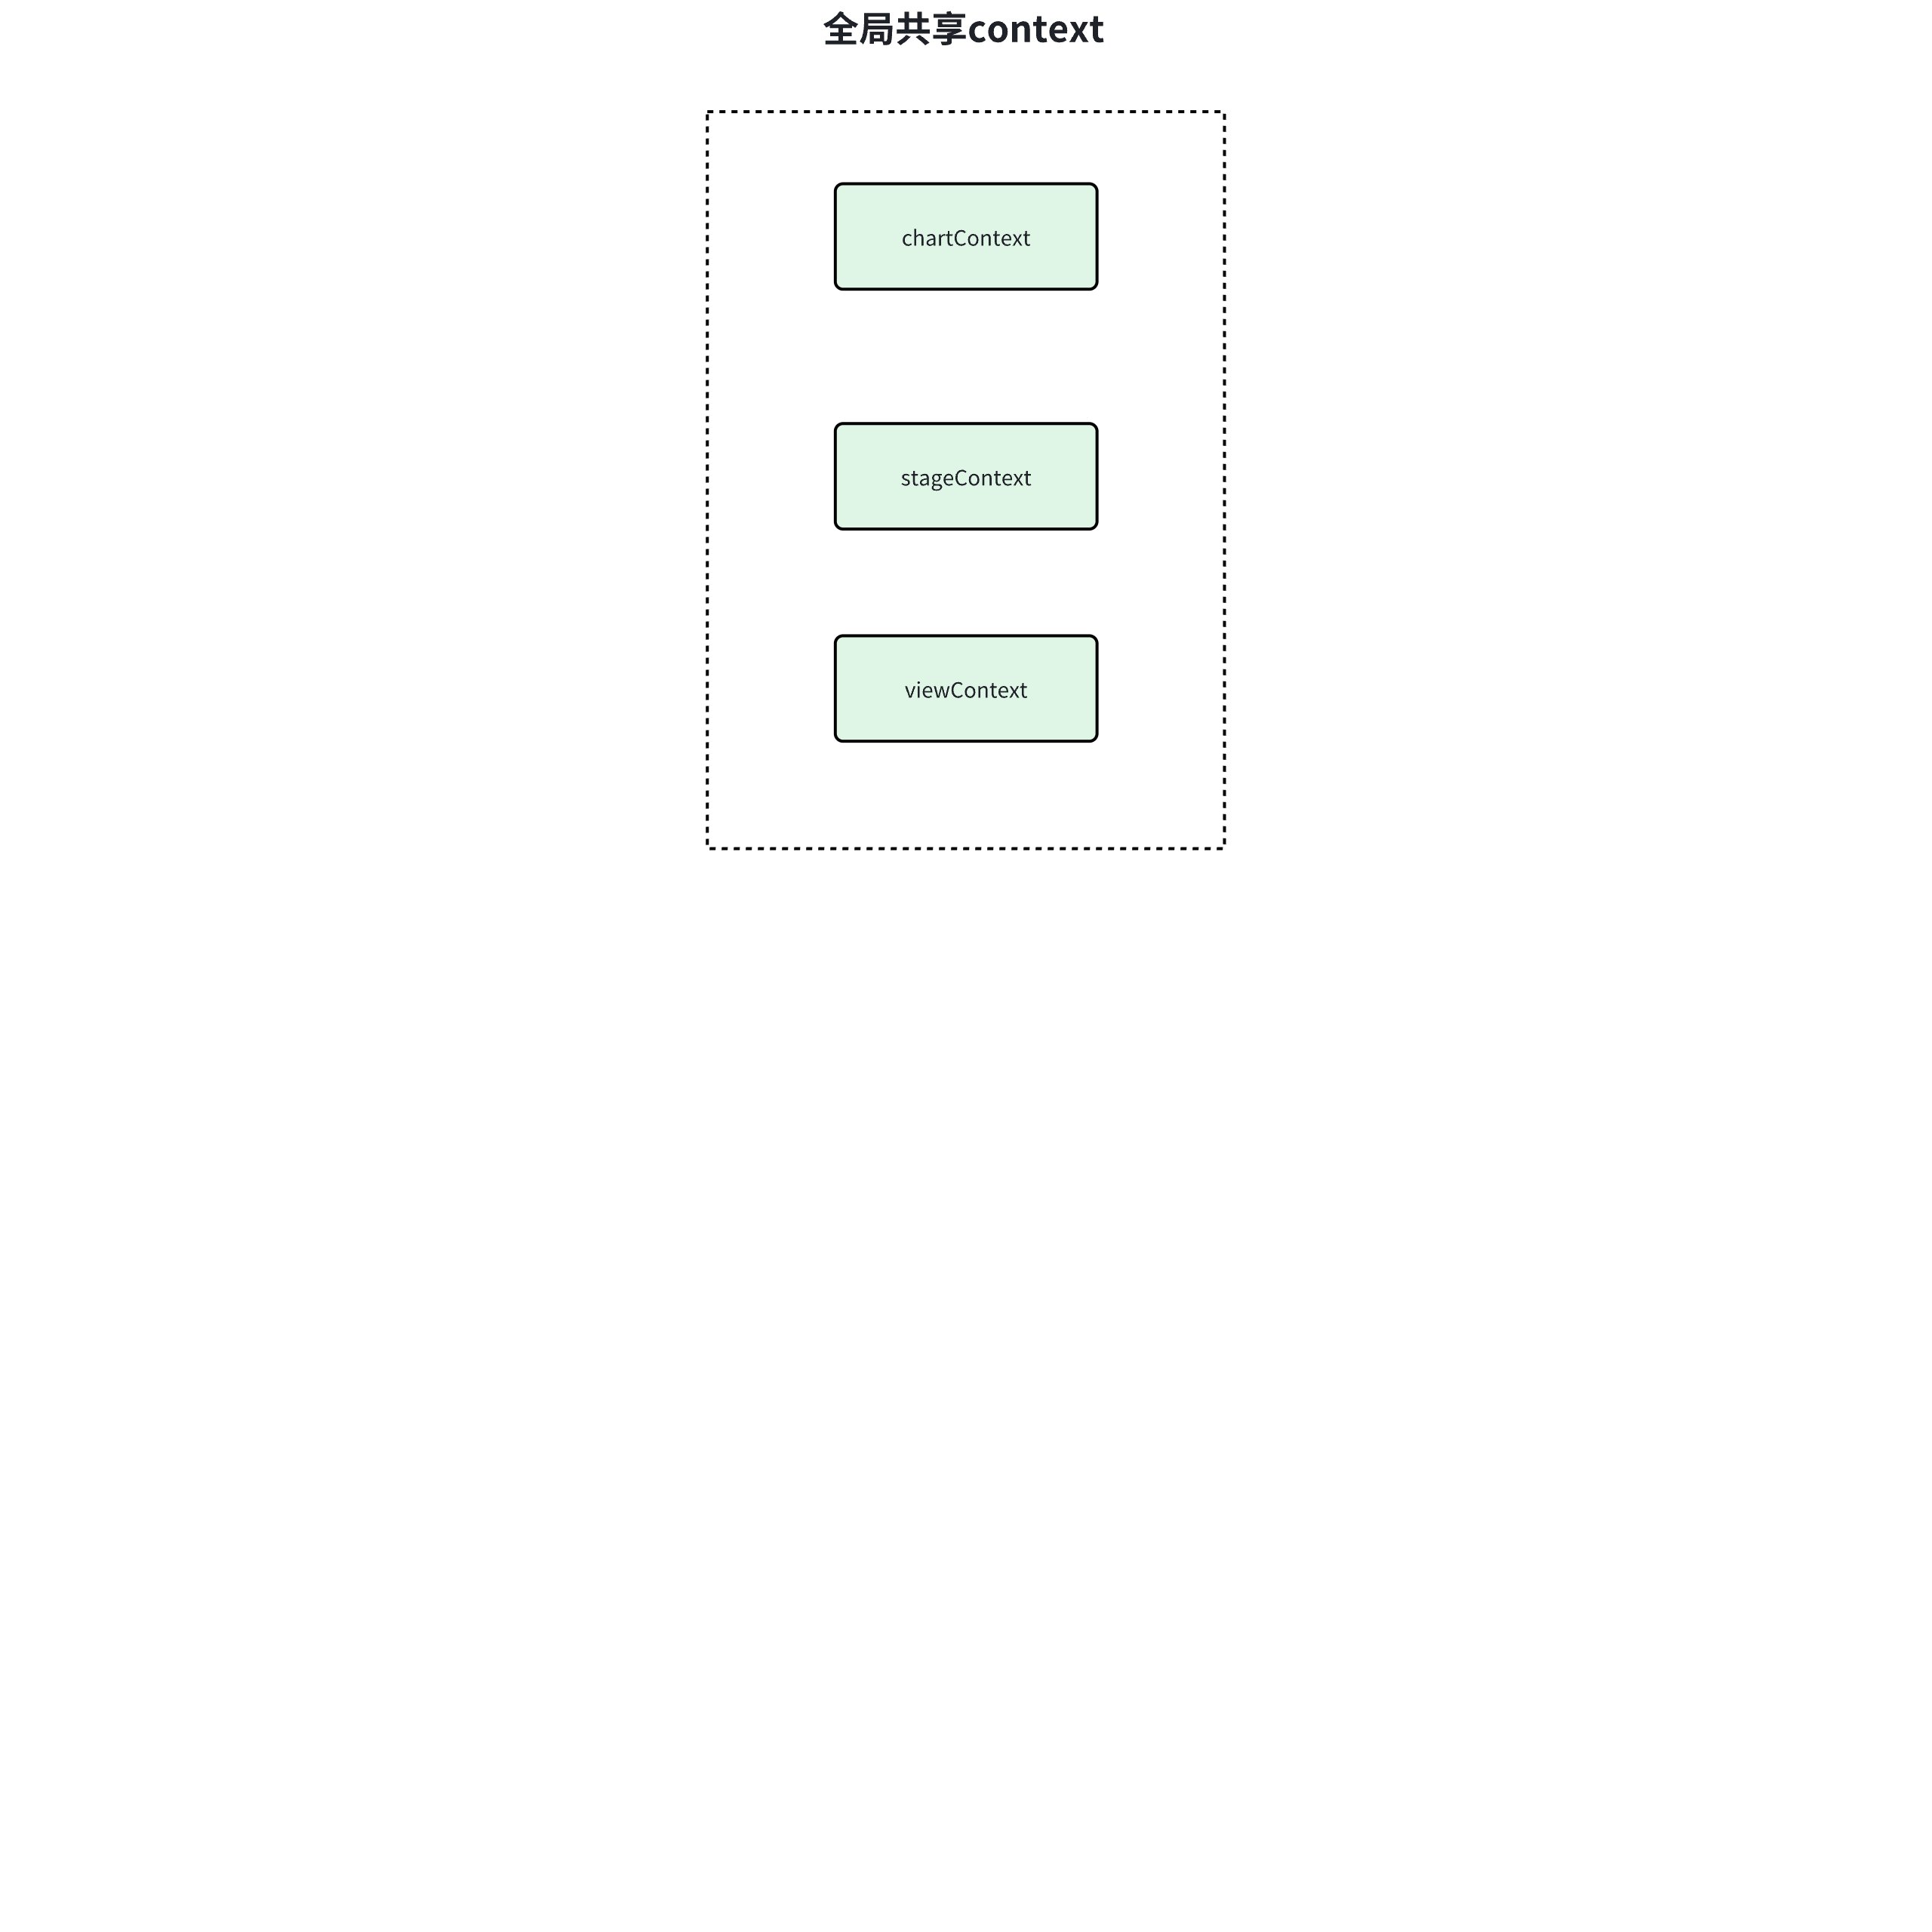 +
+## chartContext
+
+
+```Typescript
+export function withChartInstance
+
+## chartContext
+
+
+```Typescript
+export function withChartInstance(Component: typeof React.Component) {
+ // 1. 创建转发引用组件
+ const Com = React.forwardRef((props: T, ref) => {
+ // 2. 消费图表上下文
+ return (
+
+ {(ctx: ChartContextType) =>
+ // 3. 注入图表实例到被包裹组件
+
+ );
+ });
+
+ // 增强调试信息
+ Com.displayName = Component.name;
+ return Com;
+}
+
+```
+This context is mainly used to share the VChart instance:
+
+Use ChartContext.Consumer to obtain the chart instance from the context and inject it into the target component as a prop, allowing the wrapped component to directly access this.props.chart to obtain the chart instance.
+
+## viewContext
+
+
+```xml
+export function withView(Component: typeof React.Component) {
+ // 1. 创建带ref转发的组件
+ const Com = React.forwardRef((props: T, ref) => {
+ // 2. 消费视图上下文
+ return (
+
+ {/* 3. 注入视图实例到被包裹组件 */}
+ {ctx =>
+
+ );
+ });
+
+ // 增强调试信息
+ Com.displayName = Component.name;
+ return Com;
+}
+
+```
+This context is mainly used to share the VGrammar instance:
+
+Obtain the VGrammar view instance passed from `ViewContext.Provider` through `ViewContext.Consumer`.
+
+## stageContext
+
+
+```Typescript
+export function withStage(Component: typeof React.Component) {
+ // 1. 创建支持ref转发的组件包装器
+ const Com = React.forwardRef((props: T, ref) => {
+ // 2. 消费stage上下文
+ return (
+
+ {/* 3. 将stage实例注入被包装组件 */}
+ {ctx =>
+
+ );
+ });
+
+ // 4. 保留原始组件名称便于调试
+ Com.displayName = Component.name;
+ return Com;
+}
+
+```
+This context is mainly used to share the VRender instance:
+
+Obtain the VRender view instance passed from `StageContext.Provider` through `StageContext.Consumer`.
+
+
+
+# This document was revised and organized by
+[玄魂](https://github.com/xuanhun)
\ No newline at end of file
diff --git a/docs/assets/contributing/en/sourcecode/14.7.1-harmony-vchart-introduction.md b/docs/assets/contributing/en/sourcecode/14.7.1-harmony-vchart-introduction.md
new file mode 100644
index 0000000000..29b1bb2618
--- /dev/null
+++ b/docs/assets/contributing/en/sourcecode/14.7.1-harmony-vchart-introduction.md
@@ -0,0 +1,31 @@
+---
+title: 14.7.1 Harmony-VChart Introduction
+
+key words: VisActor,VChart,VTable,VStrory,VMind,VGrammar,VRender,Visualization,Chart,Data,Table,Graph,Gis,LLM
+---
+## Overview
+
+harmony-vchart is the HarmonyOS encapsulated version of VChart, providing a version of VChart encapsulated for the HarmonyOS environment.
+
+* For more information about the HarmonyOS environment, please refer to the official documentation: https://developer.huawei.com/consumer/cn/doc/harmonyos-guides/application-dev-guide
+
+## Core Code Structure
+
+The core implementation of the harmony-vchart package consists of two parts:
+
+* Harmony environment-related adaptation:
+
+* The component encapsulation logic for the Harmony environment is located in the `packages/harmony_vchart/library/src/main/ets/ChartComponent.ets` directory, which includes components encapsulated based on the Harmony environment.
+
+* Event compatibility logic is in the `packages/harmony_vchart/library/src/main/ets/event.ets` directory.
+
+* Animation Ticker logic is in the `packages/harmony_vchart/library/src/main/ets/ticker.ets` directory.
+
+* VChart products: The capabilities related to the vchart chart library directly reference the packaged products of VChart, and their content is stored in `packages/harmony_vchart/library/src/main/ets/index-harmony.es.min.js`.
+
+
+
+In the following chapters, we will analyze the encapsulation of the Harmony-VChart component in detail.
+
+ # This document was revised and organized by the following personnel
+ [Xuanhun](https://github.com/xuanhun)
\ No newline at end of file
diff --git a/docs/assets/contributing/en/sourcecode/14.7.2-harmony-vchart-source-code-analysis.md b/docs/assets/contributing/en/sourcecode/14.7.2-harmony-vchart-source-code-analysis.md
new file mode 100644
index 0000000000..fbb24e6f42
--- /dev/null
+++ b/docs/assets/contributing/en/sourcecode/14.7.2-harmony-vchart-source-code-analysis.md
@@ -0,0 +1,69 @@
+---
+title: 14.7.2 Harmony-VChart Source Code Explanation
+
+key words: VisActor,VChart,VTable,VStrory,VMind,VGrammar,VRender,Visualization,Chart,Data,Table,Graph,Gis,LLM
+---
+## Compatibility with Host Environment
+
+The HarmonyOS provides the capability to create custom components, where the `@Component` decorator can only decorate data structures declared with the struct keyword. Once a struct is decorated with `@Component`, it gains the ability to be a component. Starting from API version 9, this decorator supports usage in ArkTS cards. (https://developer.huawei.com/consumer/cn/doc/harmonyos-guides-V14/arkts-create-custom-components-V14#component).
+
+
+
+### Component Declaration
+
+1. To ensure the VChart capability in the Harmony environment, the native Canvas in the Harmony environment has been encapsulated to provide the interface of the browser's Canvas2D.
+
+* The component encapsulation logic in the harmony environment is located in the `packages/harmony_vchart/library/src/main/ets/ChartComponent.ets` directory, which includes components encapsulated based on the harmony environment.
+
+1. The events of Harmony have been re-encapsulated to be compatible with the browser's event interface.
+
+
+```xml
+export class HTMLTouchEvent {
+ type: string = '';
+ touches: TouchItem[] = [];
+ changedTouches: TouchItem[] = [];
+ target: Object | null = null;
+
+ constructor(harmonyTouchEvent: TouchEvent) {
+ if (harmonyTouchEvent.type === TouchType.Down) {
+ this.type = 'touchstart';
+ } else if (harmonyTouchEvent.type === TouchType.Up || harmonyTouchEvent.type === TouchType.Cancel) {
+ this.type = 'touchend';
+ } else if (harmonyTouchEvent.type === TouchType.Move) {
+ this.type = 'touchmove';
+ }
+ this.touches = harmonyTouchEvent.touches.map(t => new TouchItem(t));
+ this.changedTouches = harmonyTouchEvent.touches.map(t => new TouchItem(t));
+ }
+}
+
+```
+* The event compatibility logic is located in the `packages/harmony_vchart/library/src/main/ets/event.ets` directory.
+
+1. Since there is no RequestAnimationFrame interface in the Harmony environment, a custom Ticker, HarmonyTickHandler, is implemented based on Harmony's own animation API.
+
+* The animation Ticker logic is located in the `packages/harmony_vchart/library/src/main/ets/ticker.ets` directory.
+
+
+
+### Component Registration
+
+The registration of components includes properties and necessary lifecycle declarations.
+
+**Component Properties:**
+
+* spec: Same as the spec configuration of VChart
+
+* initOption: Same as the initOption configuration of VChart;
+
+**Component Methods:**
+
+* onChartInitCb: Provides a callback for when initialization is complete
+
+* onChartReadyCb: Provides a callback for when the chart is ready to be drawn
+
+
+
+ # This document was revised and organized by the following personnel
+ [Xuanhun](https://github.com/xuanhun)
\ No newline at end of file
diff --git a/docs/assets/contributing/en/sourcecode/14.8.1-vchart-svg-plugin-introduction.md b/docs/assets/contributing/en/sourcecode/14.8.1-vchart-svg-plugin-introduction.md
new file mode 100644
index 0000000000..492a22d5d5
--- /dev/null
+++ b/docs/assets/contributing/en/sourcecode/14.8.1-vchart-svg-plugin-introduction.md
@@ -0,0 +1,53 @@
+---
+title: 14.8.1 vchart-svg-plugin Introduction
+
+key words: VisActor,VChart,VTable,VStrory,VMind,VGrammar,VRender,Visualization,Chart,Data,Table,Graph,Gis,LLM
+---
+## Overview
+
+vchart-svg-plugin is a plugin that converts vchart rendering content into an SVG string, mainly used for printing, server-side rendering, and other scenarios;
+
+
+
+## Basic Principles
+
+Before reading the specific code, we first need to know some implementation principles of vchart. Vchart is rendered based on canvas and relies on the canvas rendering engine library @visactor/vrender at the bottom layer. Vrender generates a graphic scene tree stage based on the chart configuration of vchart:
+
+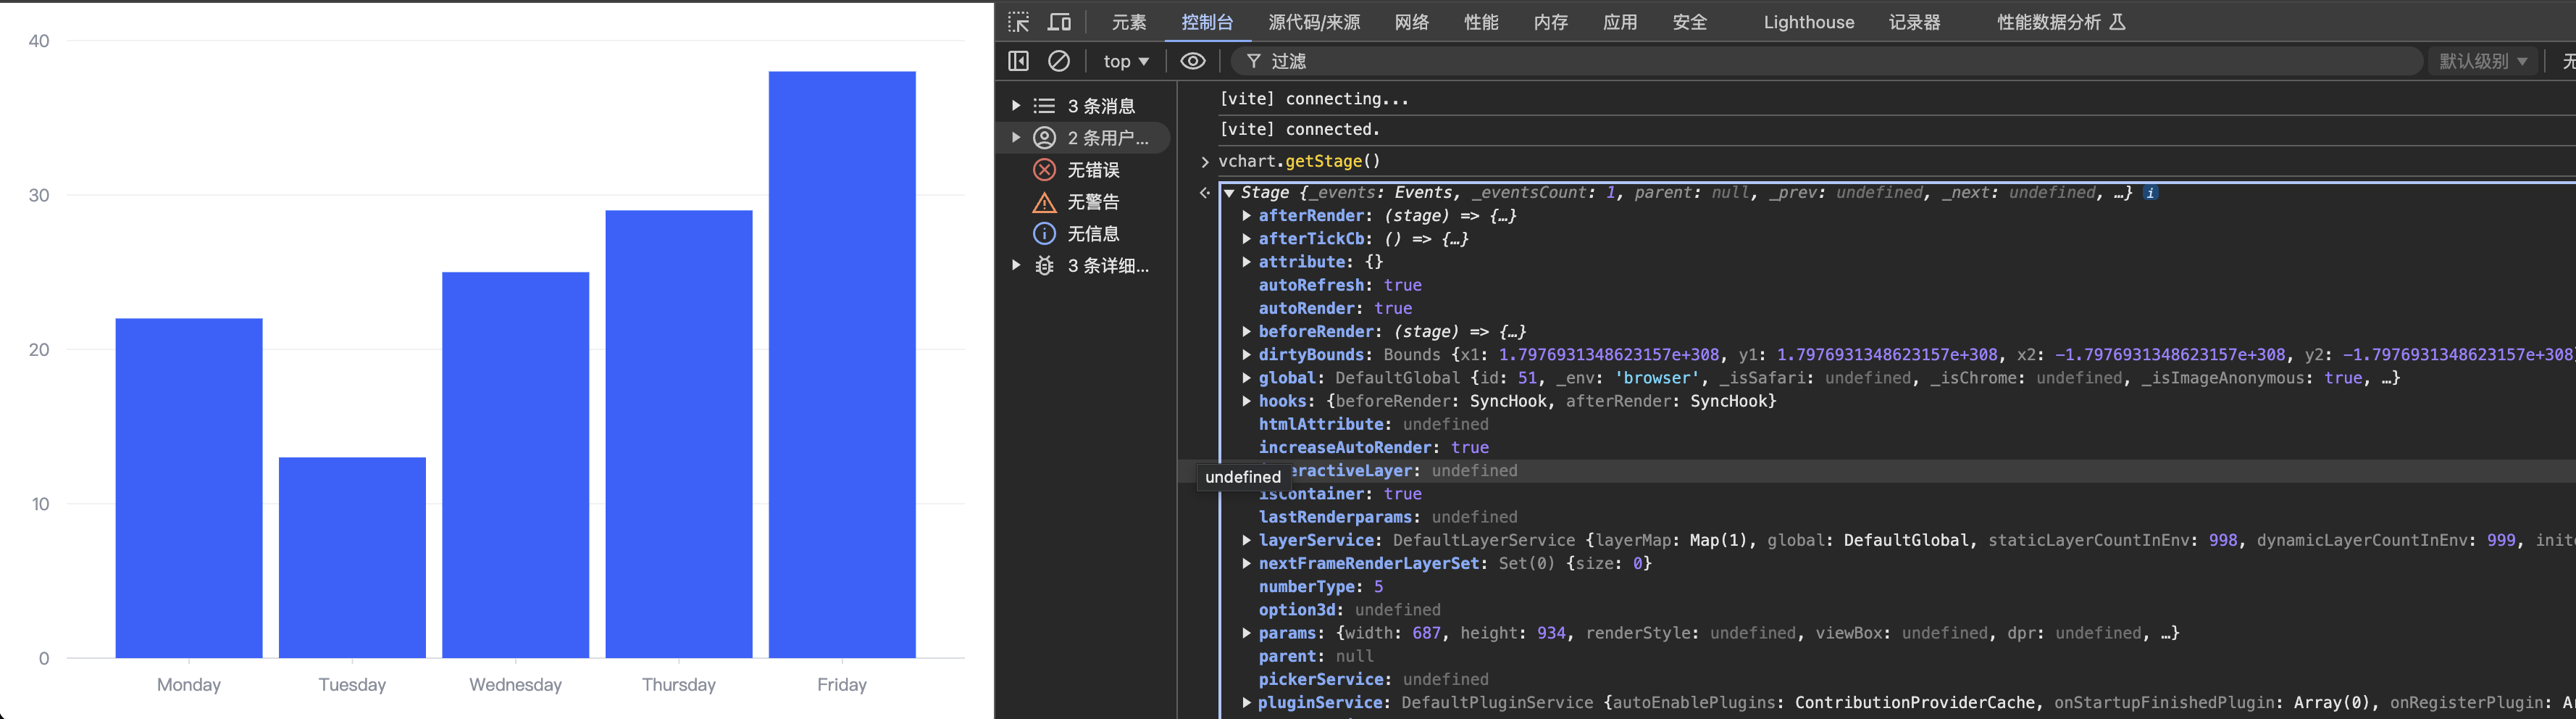 +
+The relationship of graphics-related classes in vrender is as follows:
+
+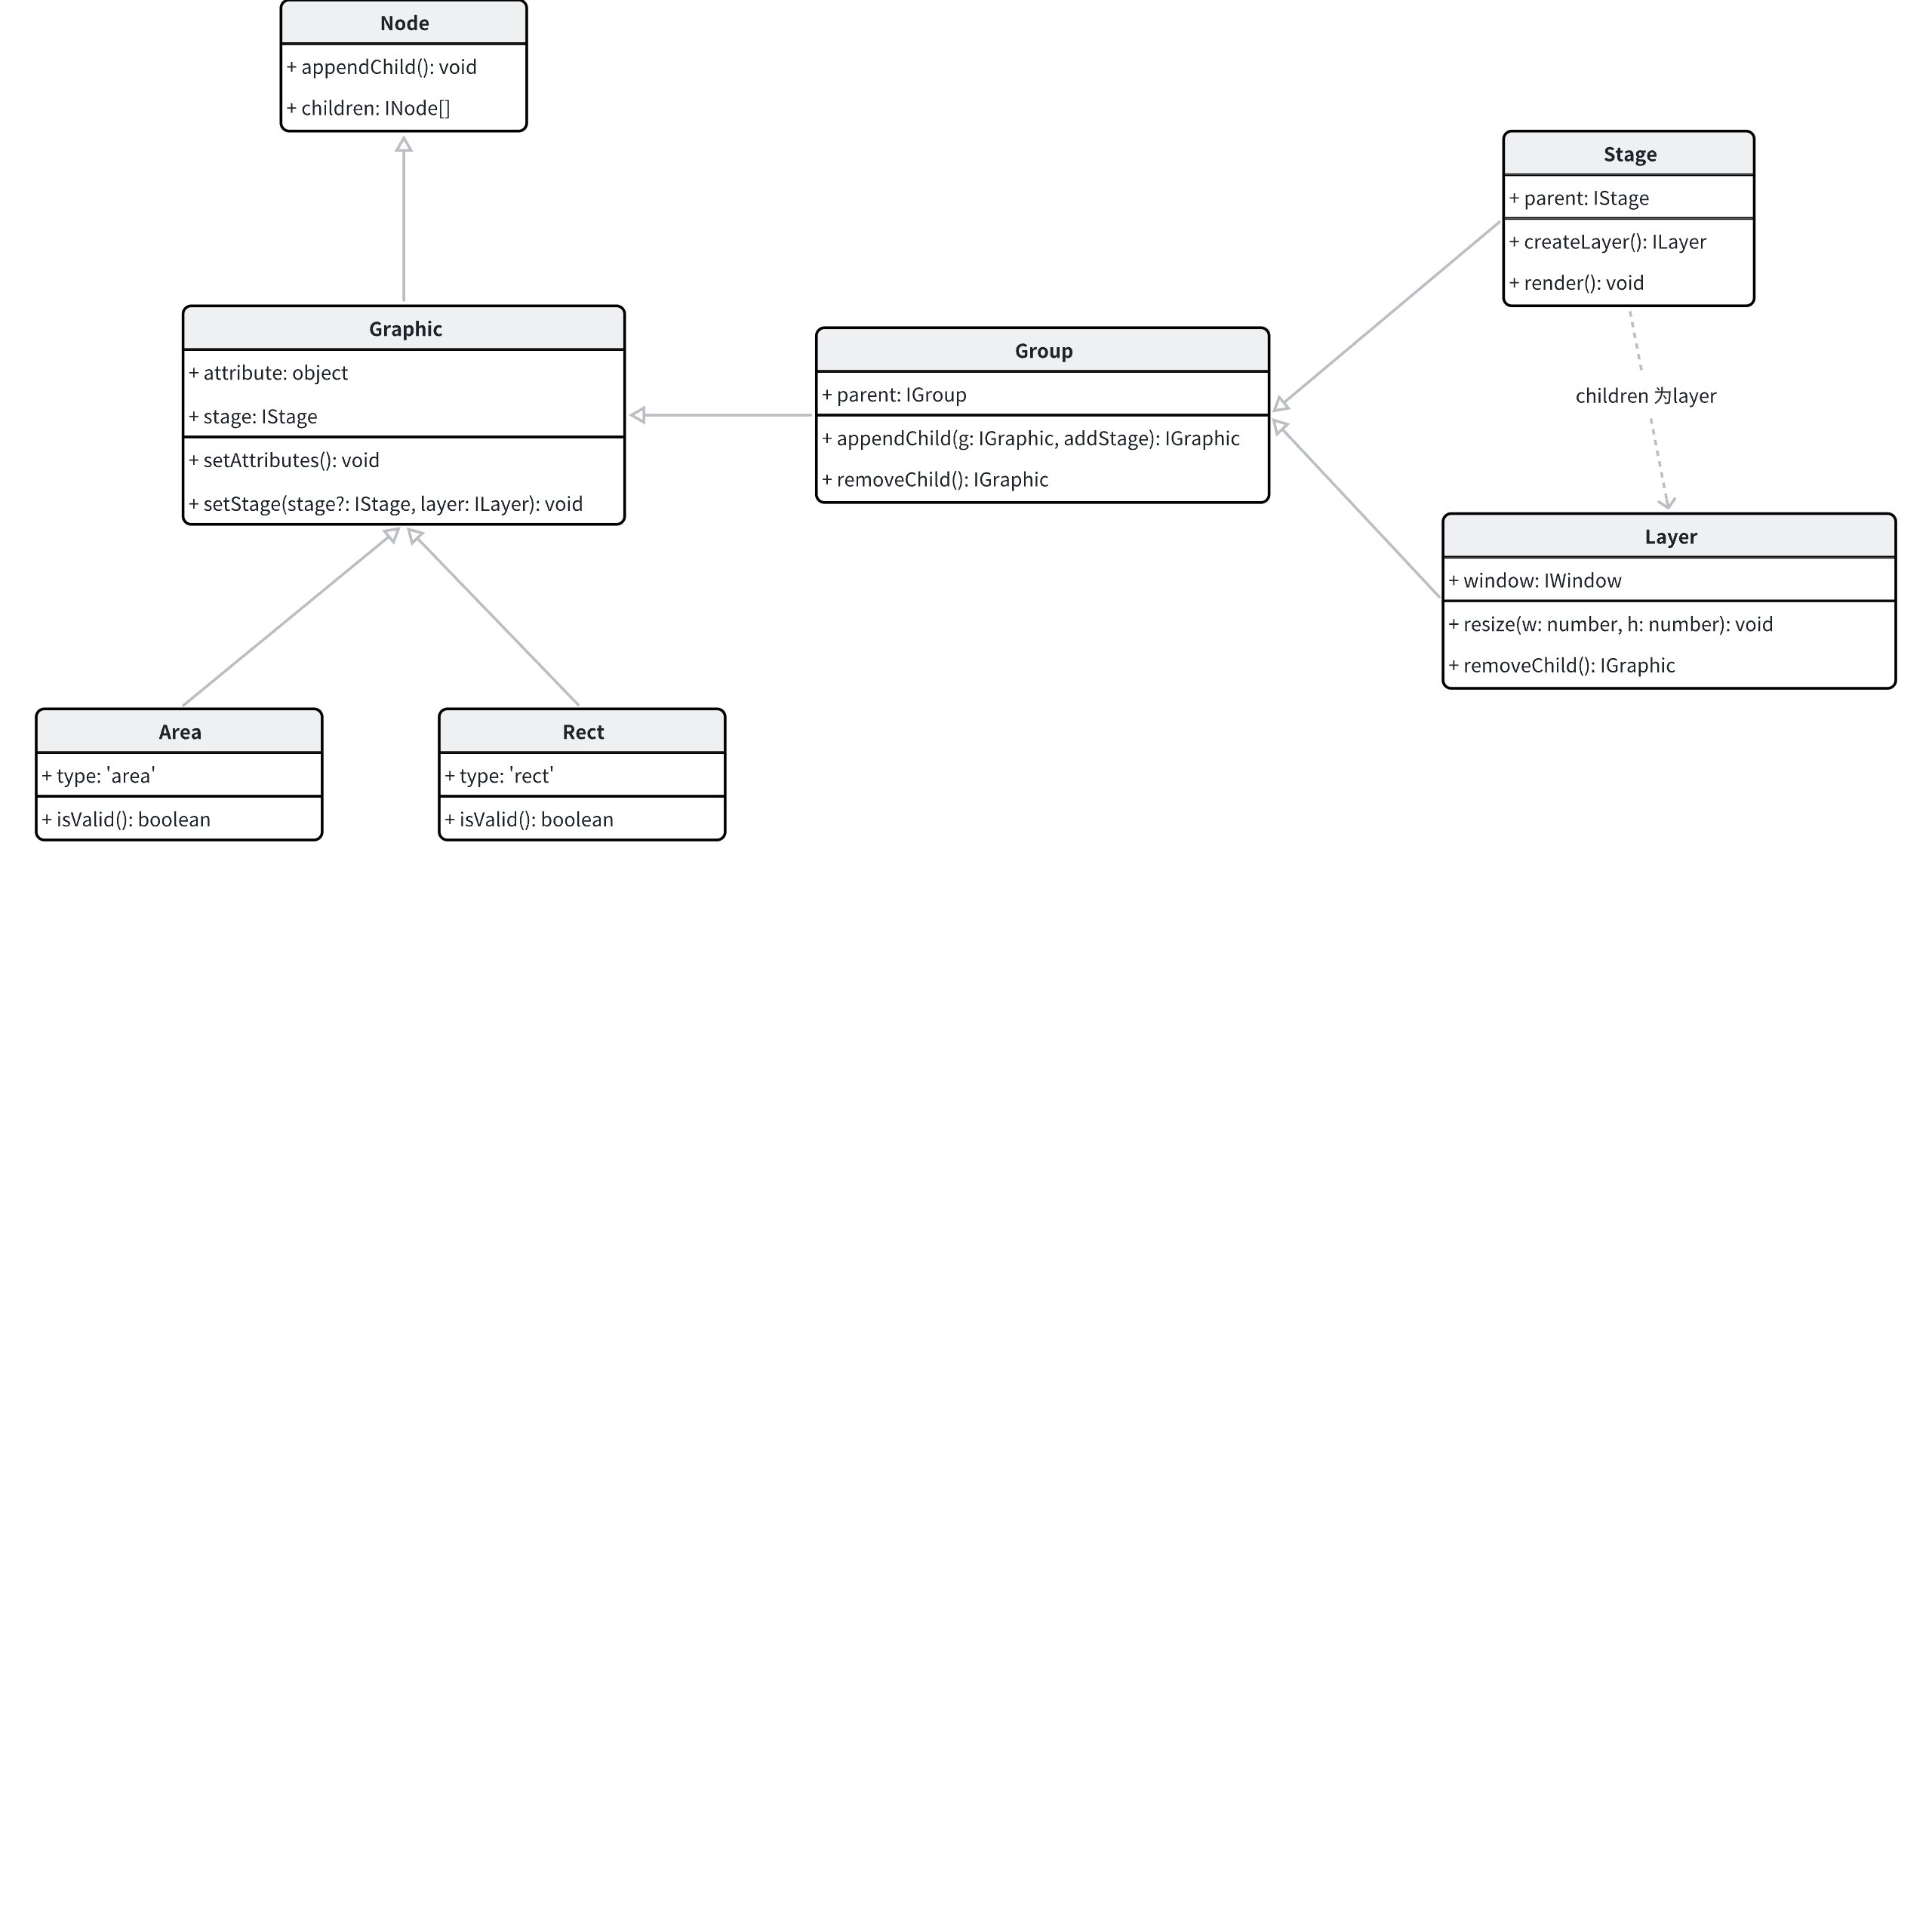
+
+In other words, through the `vchart` instance, we can obtain the root node `stage` of the scene tree. By recursively traversing the child nodes of `stage`, we can get all the rendered graphics. In the implementation of vrender, all graphics have an `attribute` property to maintain the display configuration of the graphics. Therefore, the task is broken down into two parts:
+
+* Construct the child nodes of the svg based on the child nodes of `stage`
+
+* Convert the `attribute` of vrender graphic elements into the corresponding attributes of svg nodes
+
+## Core File Structure
+
+```plaintext
+src/svg/
+├── convert.ts - 转换入口,处理图表到SVG的转换
+├── graphic.ts - 图形元素转换的核心实现
+├── util.ts - 通用工具函数集合
+├── pattern.ts - 纹理属性转换
+├── shadow.ts - shadow属性转换
+├── arc.ts - 圆弧图形相关转换
+├── area.ts - 区域图形相关转换
+├── line.ts - 线图形相关转换
+├── polygon.ts - 多边形图形相关转换
+├── rect.ts - 矩形图形相关转换
+└── symbol.ts - symbol图形相关转换
+
+
+```
+In the following chapters, we will describe in detail some core code implementations
+
+
+
+
+
+ # This document was revised and organized by the following personnel
+ [玄魂](https://github.com/xuanhun)
\ No newline at end of file
diff --git a/docs/assets/contributing/en/sourcecode/14.8.2-vchart-svg-plugin-source-code-analysis.md b/docs/assets/contributing/en/sourcecode/14.8.2-vchart-svg-plugin-source-code-analysis.md
new file mode 100644
index 0000000000..38d040a791
--- /dev/null
+++ b/docs/assets/contributing/en/sourcecode/14.8.2-vchart-svg-plugin-source-code-analysis.md
@@ -0,0 +1,191 @@
+---
+title: 14.8.2 vchart-svg-plugin Source Code Explanation
+
+key words: VisActor,VChart,VTable,VStrory,VMind,VGrammar,VRender,Visualization,Chart,Data,Table,Graph,Gis,LLM
+---
+## Conversion Entry (convert.ts)
+
+The entry file `convert.ts` provides the core method `convertVChartToSvg`, which mainly undertakes the following important responsibilities:
+
+* **Obtain** `**stage**` **information**: By passing in the vchart instance object, the `getStage` method is called to obtain the vrender's graphic scene tree `stage`, which is the basis for subsequent operations.
+
+* **Set viewport attributes**: Extract viewport information `viewBox` from `stage`, and based on this, generate svg viewport attributes. These attributes define the display area and size of the svg graphic, ensuring that the graphic can be correctly presented in the svg environment.
+
+* **Handle background**: Check the background information `background` of `stage`, and if there is a background, call the `convertCommonStyle` method to convert it into the rectangle element style required by svg.
+
+* **Generate SVG tags**: Combine the processed background rectangle elements and the converted svg elements of `stage` child nodes to generate a complete svg tag string and return it.
+
+```xml
+export const convertVChartToSvg = (vchart: any): string => {
+ // 1. 获取舞台信息
+ const stage = vchart.getStage();
+
+ // 2. 设置视口属性
+ const viewBox = stage.viewBox;
+ const attrs = {
+ width: `${width}px`,
+ height: `${height}px`,
+ viewBox: `${x} ${y} ${width} ${height}`,
+ };
+ // 3. 处理背景
+ const background = stage.background;
+ let backgroundRect = "";
+ if (background) {
+ const style = convertCommonStyle({ fill: background }, stage);
+ // ...
+ }
+ // 4. 生成SVG标签
+ return ``;
+};
+
+```
+## Graphic Transformation Core (graphic.ts)
+
+`graphic.ts` serves as the core graphic processing file in the SVG transformation module, responsible for converting various graphic elements into SVG nodes. This module supports the conversion of multiple graphic types, covering basic graphics (such as paths, rectangles, arcs, etc.) and complex graphic groups.
+
+### Composite Graphic Processing
+
+`parseGroup` is the main entry function for parsing graphics. It recursively processes child node types to gradually generate SVG elements. The specific implementation steps are as follows:
+
+* **Basic Check**: First, check whether the passed `group` object is valid. If `group` does not exist or is invalid, return an empty string directly. It should be noted that `stage` itself is also a special kind of `group`.
+
+* **Attribute Merging**: Merge the theme style `theme?.combinedTheme?.[group.type]` of the `group` with its own attributes `group.attribute` to ensure that the graphics can inherit the correct style.
+
+* **Processing by Type**: When the type of `group` is `group`, it indicates a composite graphic. At this point, first call the `convertCommonStyle` method to generate common styles, then sort the child elements of the `group`. The sorting basis is the `zIndex` attribute of the child elements (if `zIndex` does not exist, it defaults to 0). After sorting, recursively call the `parseGroup` method to process each child element and combine the results to generate the final composite graphic SVG element.
+
+* **Processing Other Types**: If `group` is not a composite graphic type, that is, a simple graphic element, call the `parseSimpleGraphic` method to process other types of graphics.
+
+```xml
+export const parseGroup = (group: any): string => {
+ // 1. 基础检查
+ if (!group ||!group.isValid()) {
+ return "";
+ }
+ // 2. 属性合并
+ const attribute = {
+ ...group.theme?.combinedTheme?.[group.type],
+ ...group.attribute
+ };
+ // 3. 根据类型处理
+ if (group.type === "group") {
+ // 处理组合图形
+ const commonStyle = convertCommonStyle(attribute, group);
+ const children = group.children;
+
+ // 排序子元素
+ children.sort((a: any, b: any) => {
+ return (a.attribute.zIndex ?? 0) - (b.attribute.zIndex ?? 0);
+ });
+ // 生成组合内容
+ return `
+
+The relationship of graphics-related classes in vrender is as follows:
+
+
+
+In other words, through the `vchart` instance, we can obtain the root node `stage` of the scene tree. By recursively traversing the child nodes of `stage`, we can get all the rendered graphics. In the implementation of vrender, all graphics have an `attribute` property to maintain the display configuration of the graphics. Therefore, the task is broken down into two parts:
+
+* Construct the child nodes of the svg based on the child nodes of `stage`
+
+* Convert the `attribute` of vrender graphic elements into the corresponding attributes of svg nodes
+
+## Core File Structure
+
+```plaintext
+src/svg/
+├── convert.ts - 转换入口,处理图表到SVG的转换
+├── graphic.ts - 图形元素转换的核心实现
+├── util.ts - 通用工具函数集合
+├── pattern.ts - 纹理属性转换
+├── shadow.ts - shadow属性转换
+├── arc.ts - 圆弧图形相关转换
+├── area.ts - 区域图形相关转换
+├── line.ts - 线图形相关转换
+├── polygon.ts - 多边形图形相关转换
+├── rect.ts - 矩形图形相关转换
+└── symbol.ts - symbol图形相关转换
+
+
+```
+In the following chapters, we will describe in detail some core code implementations
+
+
+
+
+
+ # This document was revised and organized by the following personnel
+ [玄魂](https://github.com/xuanhun)
\ No newline at end of file
diff --git a/docs/assets/contributing/en/sourcecode/14.8.2-vchart-svg-plugin-source-code-analysis.md b/docs/assets/contributing/en/sourcecode/14.8.2-vchart-svg-plugin-source-code-analysis.md
new file mode 100644
index 0000000000..38d040a791
--- /dev/null
+++ b/docs/assets/contributing/en/sourcecode/14.8.2-vchart-svg-plugin-source-code-analysis.md
@@ -0,0 +1,191 @@
+---
+title: 14.8.2 vchart-svg-plugin Source Code Explanation
+
+key words: VisActor,VChart,VTable,VStrory,VMind,VGrammar,VRender,Visualization,Chart,Data,Table,Graph,Gis,LLM
+---
+## Conversion Entry (convert.ts)
+
+The entry file `convert.ts` provides the core method `convertVChartToSvg`, which mainly undertakes the following important responsibilities:
+
+* **Obtain** `**stage**` **information**: By passing in the vchart instance object, the `getStage` method is called to obtain the vrender's graphic scene tree `stage`, which is the basis for subsequent operations.
+
+* **Set viewport attributes**: Extract viewport information `viewBox` from `stage`, and based on this, generate svg viewport attributes. These attributes define the display area and size of the svg graphic, ensuring that the graphic can be correctly presented in the svg environment.
+
+* **Handle background**: Check the background information `background` of `stage`, and if there is a background, call the `convertCommonStyle` method to convert it into the rectangle element style required by svg.
+
+* **Generate SVG tags**: Combine the processed background rectangle elements and the converted svg elements of `stage` child nodes to generate a complete svg tag string and return it.
+
+```xml
+export const convertVChartToSvg = (vchart: any): string => {
+ // 1. 获取舞台信息
+ const stage = vchart.getStage();
+
+ // 2. 设置视口属性
+ const viewBox = stage.viewBox;
+ const attrs = {
+ width: `${width}px`,
+ height: `${height}px`,
+ viewBox: `${x} ${y} ${width} ${height}`,
+ };
+ // 3. 处理背景
+ const background = stage.background;
+ let backgroundRect = "";
+ if (background) {
+ const style = convertCommonStyle({ fill: background }, stage);
+ // ...
+ }
+ // 4. 生成SVG标签
+ return ``;
+};
+
+```
+## Graphic Transformation Core (graphic.ts)
+
+`graphic.ts` serves as the core graphic processing file in the SVG transformation module, responsible for converting various graphic elements into SVG nodes. This module supports the conversion of multiple graphic types, covering basic graphics (such as paths, rectangles, arcs, etc.) and complex graphic groups.
+
+### Composite Graphic Processing
+
+`parseGroup` is the main entry function for parsing graphics. It recursively processes child node types to gradually generate SVG elements. The specific implementation steps are as follows:
+
+* **Basic Check**: First, check whether the passed `group` object is valid. If `group` does not exist or is invalid, return an empty string directly. It should be noted that `stage` itself is also a special kind of `group`.
+
+* **Attribute Merging**: Merge the theme style `theme?.combinedTheme?.[group.type]` of the `group` with its own attributes `group.attribute` to ensure that the graphics can inherit the correct style.
+
+* **Processing by Type**: When the type of `group` is `group`, it indicates a composite graphic. At this point, first call the `convertCommonStyle` method to generate common styles, then sort the child elements of the `group`. The sorting basis is the `zIndex` attribute of the child elements (if `zIndex` does not exist, it defaults to 0). After sorting, recursively call the `parseGroup` method to process each child element and combine the results to generate the final composite graphic SVG element.
+
+* **Processing Other Types**: If `group` is not a composite graphic type, that is, a simple graphic element, call the `parseSimpleGraphic` method to process other types of graphics.
+
+```xml
+export const parseGroup = (group: any): string => {
+ // 1. 基础检查
+ if (!group ||!group.isValid()) {
+ return "";
+ }
+ // 2. 属性合并
+ const attribute = {
+ ...group.theme?.combinedTheme?.[group.type],
+ ...group.attribute
+ };
+ // 3. 根据类型处理
+ if (group.type === "group") {
+ // 处理组合图形
+ const commonStyle = convertCommonStyle(attribute, group);
+ const children = group.children;
+
+ // 排序子元素
+ children.sort((a: any, b: any) => {
+ return (a.attribute.zIndex ?? 0) - (b.attribute.zIndex ?? 0);
+ });
+ // 生成组合内容
+ return `
+ ${children.map(child => parseGroup(child)).join("")}
+ `;
+ }
+
+ // 4. 处理其他类型
+ return parseSimpleGraphic(attribute, group);
+};
+
+```
+Composite graphics processing has the following key features:
+
+* **Support for theme style inheritance**: Ensures that composite graphics can inherit the correct theme style, maintaining consistency in overall style.
+
+* **Maintain rendering order of sub-elements**: Sorts sub-elements using the `zIndex` attribute to ensure the correct order during rendering, avoiding issues such as occlusion.
+
+* **Recursive handling of nested structures**: Capable of handling complex nested composite graphics, ensuring that each layer of sub-elements can be correctly converted into SVG elements.
+
+### SVG Node Generator
+
+
+```xml
+export const generateSvgNode = (
+ graphic: any,
+ type: string,
+ style: any,
+ defs: { shadow?: string; pattern?: string; gradient?: string }
+): string => {
+ const name = graphic.name;
+
+ // 处理样式类名
+ if (name) {
+ style.class = name;
+ }
+
+ // 生成定义内容
+ const defContent = generateDefs(defs);
+ // 生成节点字符串
+ let nodeStr = `${defContent}<${type}
+ ${convertStyleToString(style)}
+ ${defs.shadow? 'filter="url(#' + generateShadowId(graphic) + ')"' : ""}
+ />`;
+ // 处理图案填充
+ if (defs.pattern) {
+ // ...处理 pattern 相关逻辑
+ }
+ return nodeStr;
+};
+
+```
+This function is the core of graphic node generation, mainly featuring the following functions:
+
+* **Handle graphic names and styles**: Apply the graphic's name to the class name of the style, making it convenient for targeted style settings in the stylesheet.
+
+* **Generate definitions for gradients, shadows, etc.**: Based on the passed `defs` object, generate SVG definition content for gradients, shadows, etc., to add rich visual effects to the graphics.
+
+* **Support pattern fills**: If there is a configuration related to pattern fills `defs.pattern`, perform the corresponding processing to enable the graphics to achieve pattern fill effects.
+
+### Basic Graphic Transformation
+
+
+```xml
+export const parseSimpleGraphic = (attribute: any, group: any) => {
+ // 1. 处理通用样式
+ const commonStyle = convertCommonStyle(attribute, group);
+
+ // 2. 生成定义内容
+ const defs = {
+ gradient: generateGradient(attribute, group),
+ pattern: generatePattern(attribute, group),
+ shadow: generateShadow(attribute, group),
+ };
+ // 3. 根据图形类型分发处理
+ if (group.type === "arc") {
+ return generateSvgNode(/*...*/);
+ }
+
+ if (group.type === "polygon") {
+ return generateSvgNode(/*...*/);
+ }
+
+ // ... 其他图形类型处理
+};
+
+```
+The function is responsible for handling the transformation of basic graphics, supporting various types of basic graphics, specifically including:
+
+* **Arc (arc)**
+
+* **Polygon (polygon)**
+
+* **Path (path)**
+
+* **Symbol (symbol)**
+
+* **Text (text)**
+
+* **Richtext (richtext)**
+
+* **Line (line)**
+
+* **Area (area)**
+
+* **Rectangle (rect)**
+
+Through the collaboration of the above parts, the vchart-svg-plugin efficiently and accurately converts vchart rendering content into an SVG string.
+
+# This document was revised and organized by the following personnel
+[玄魂](https://github.com/xuanhun)
\ No newline at end of file
diff --git a/docs/assets/contributing/en/sourcecode/3-how-to-assemble-a-vchart.md b/docs/assets/contributing/en/sourcecode/3-how-to-assemble-a-vchart.md
new file mode 100644
index 0000000000..f6fc15e70d
--- /dev/null
+++ b/docs/assets/contributing/en/sourcecode/3-how-to-assemble-a-vchart.md
@@ -0,0 +1,1158 @@
+---
+title: 3 How to "assemble" a VChart chart
+
+key words: VisActor,VChart,VTable,VStrory,VMind,VGrammar,VRender,Visualization,Chart,Data,Table,Graph,Gis,LLM
+---
+In the previous chapters, we talked about the composition and basic principles of charts. Now let's see how to assemble a VChart chart using declarative syntax.
+
+# 3.1 Interface Definition
+
+A basic spec needs to include the following parts:
+
+* `type` Chart type
+
+* `data` Data source
+
+* Data mapping, in most cases in a Cartesian coordinate system as `xField` and `yField`, in a polar coordinate system as `categoryField` and `valueField`
+
+* Series configuration, VChart charts are composed of series, which include elements and labels. The configuration of elements and labels is in the series configuration
+
+* Component configuration, such as `legends`, `axes`, etc. Except for composite charts that must configure `axes`, the configuration of components for other charts is actually optional and can be configured as needed
+
+## 3.1.1 Chart Type
+
+In the spec, we first need to decide the chart type, for example:
+
+
+```Typescript
+{
+ "type": "bar"
+}
+
+```
+Common chart types include `bar`, `line`, `pie`, and more chart types can be referenced in the API documentation: https://www.visactor.io/vchart/option
+
+Note that there is a special chart type called `common`, which is a composite chart type series. Examples will be provided later.
+
+## 3.1.2 Data Source
+
+Data is the foundation of chart visualization, and we need to specify the data source in the spec. Typically, data is represented in JSON format, using the `data` field to specify it. For example, we can specify the data source in the following format:
+
+```Typescript
+{
+ "data": [
+ {
+ "id": "barData",
+ "values": [
+ { "type": "A", "year": "1930", "value": 129 },
+ { "type": "A", "year": "1940", "value": 133 },
+ { "type": "A", "year": "1950", "value": 130 },
+ { "type": "A", "year": "1960", "value": 126 },
+ { "type": "A", "year": "1970", "value": 117 },
+ { "type": "A", "year": "1980", "value": 114 },
+ { "type": "A", "year": "1990", "value": 111 },
+ { "type": "A", "year": "2000", "value": 89 },
+ { "type": "A", "year": "2010", "value": 80 },
+ { "type": "A", "year": "2018", "value": 80 },
+ { "type": "B", "year": "1930", "value": 22 },
+ { "type": "B", "year": "1940", "value": 13 },
+ { "type": "B", "year": "1950", "value": 25 },
+ { "type": "B", "year": "1960", "value": 29 },
+ { "type": "B", "year": "1970", "value": 38 },
+ { "type": "B", "year": "1980", "value": 41 },
+ { "type": "B", "year": "1990", "value": 57 },
+ { "type": "B", "year": "2000", "value": 87 },
+ { "type": "B", "year": "2010", "value": 98 },
+ { "type": "B", "year": "2018", "value": 99 }
+ ]
+ }
+ ]
+}
+
+```
+The `id` field is used to identify the data source, and the `values` field is used to specify the data of the data source.
+
+In VChart, in most cases, we expect to use `flattened` data objects. The difference between `flattened` and `non-flattened` data objects is shown in the example below
+
+```Typescript
+// 非展平数据对象
+[
+ {date: "Monday", class No.1: 20, class No.2: 30},
+ {date: "Tuesday", class No.1: 25, class No.2: 28},
+]
+// 展平数据对象
+[
+ { date: "Monday", class: "class No.1", score: 20 },
+ { date: "Monday", class: "class No.2", score: 30 },
+
+ { date: "Tuesday", class: "class No.1", score: 25 },
+ { date: "Tuesday", class: "class No.2", score: 28 },
+]
+
+```
+The most important significance of flattening data is that it allows for a one-to-one correspondence between data and graphics.
+
+## 3.1.3 Data Mapping
+
+Next, we need to map the data to the basic graphical elements (marks) of the chart. For the grouped bar chart in this tutorial, we specify `xField`, `yField`, and `seriesField`. Here, `xField` and `yField` are used for position mapping, and `seriesField` is used for color mapping
+
+```Typescript
+{
+ "xField": ["year", "type"],
+ "yField": "value",
+ "seriesField": "type"
+}
+
+```
+## 3.1.4 Series Configuration
+
+A series refers to the main body of the chart in the image, such as the line in a line chart, which will be introduced in more detail later.
+
+
+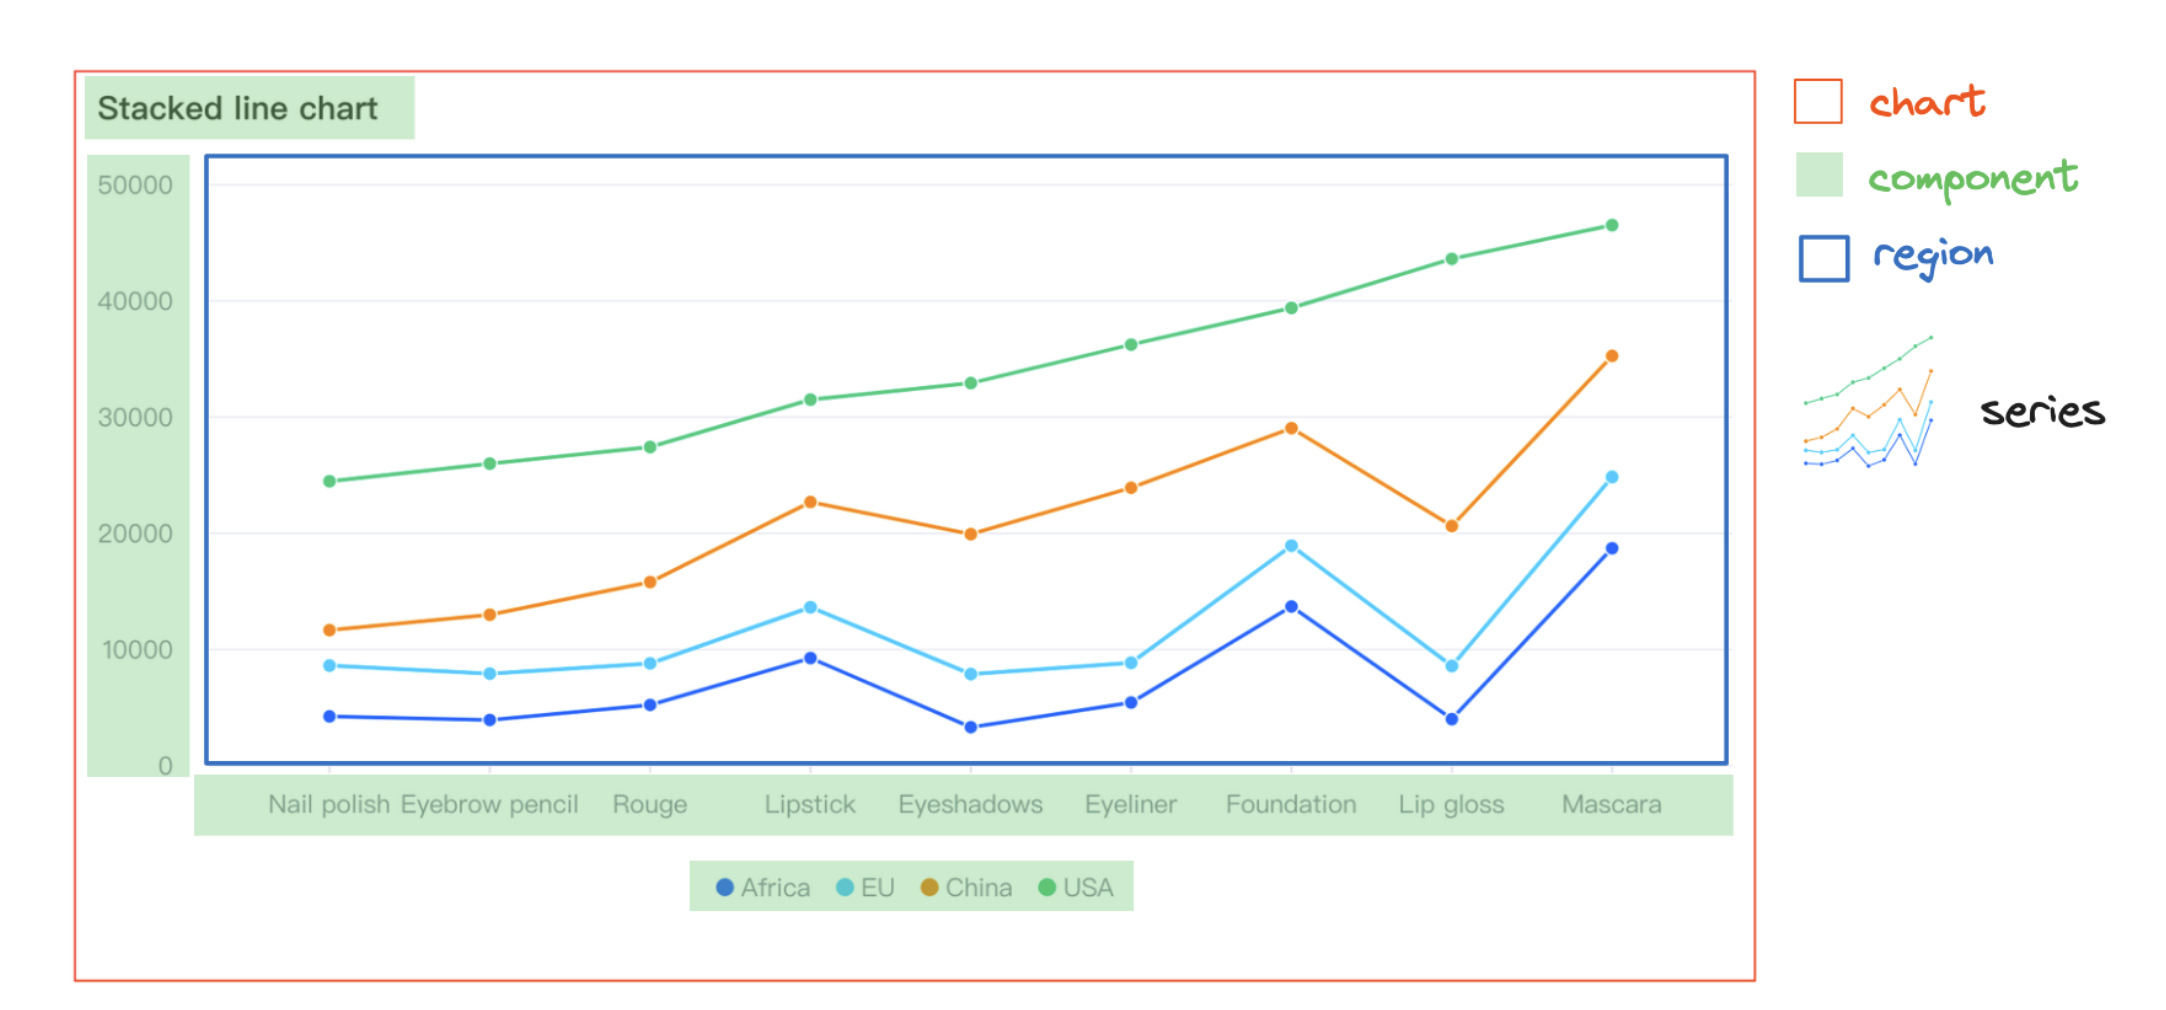 +
+## 3.1.5 Component Configuration
+
+VChart also supports configuring various components of the chart, such as axes, legends, crosshair, and tooltip. Currently, the components supported by VChart are:
+
+# 3.2 Series
+
+## 3.2.1 Concept and Types
+
+In VChart, Series are the core building blocks of visual charts, responsible for mapping data into visual expressions. A series represents a set of related data items that share the same visual representation (such as line, bar, etc.). Series are converters from data to graphics, including data processing, coordinate mapping, visual encoding, and other functions. Each series type corresponds to a specific visual representation form, with unique data structure requirements and visual mapping rules.
+
+### Basic and Coordinate System Classes
+
+* base: Basic implementation of series, providing common functions for all series
+
+* cartesian: Cartesian coordinate system base class, used for X-Y axis series
+
+* polar: Polar coordinate system base class, used for circular and radial series
+
+* geo: Geographic coordinate system base class, used for map-related series
+
+### Cartesian Coordinate System Series
+
+* bar: Bar chart, used for category data comparison
+
+* line: Line chart, showing data trends and changes
+
+* area: Area chart, emphasizing cumulative changes in data volume
+
+* scatter: Scatter plot, showing the distribution of data points
+
+* box-plot: Box plot, displaying data distribution and outliers
+
+* dot: Dot plot, simplified scatter plot
+
+* heatmap: Heatmap, using color intensity to represent value size
+
+* range-area: Range area chart, showing upper and lower boundary areas
+
+* range-column: Range column chart, showing data range
+
+* waterfall: Waterfall chart, showing cumulative effects
+
+### Polar Coordinate System Series
+
+* pie: Pie chart, showing the relationship between part and whole
+
+* rose: Rose chart, circular display of multidimensional data
+
+* radar: Radar chart, radial display of multivariable data
+
+### Hierarchical Series
+
+* treemap: Treemap, nested rectangle display of hierarchical structure
+
+* sunburst: Sunburst chart, circular display of hierarchical data
+
+* circle-packing: Circle packing chart, nested circle display of hierarchical structure
+
+### Relational Series
+
+* sankey: Sankey diagram, showing flow and conversion relationships
+
+* correlation: Correlation chart, showing correlations between different dimensions
+
+* venn: Venn diagram, showing intersection relationships between sets
+
+* link: Link chart, showing connections between entities
+
+### Special Series
+
+* funnel: Funnel chart, showing conversion rates of multi-stage processes
+
+* gauge: Gauge chart, showing the achievement of a single indicator
+
+* liquid: Liquid chart, using liquid fill effect to show progress
+
+* map: Map series, displaying data in geographic space
+
+* mosaic: Mosaic chart, using rectangle area to display multidimensional data relationships
+
+* pictogram: Pictogram chart, using icons to represent data
+
+* progress: Progress bar, linear display of completion
+
+* word-cloud: Word cloud chart, displaying text data based on word frequency
+
+## 3.2.2 Series Data Management
+
+
+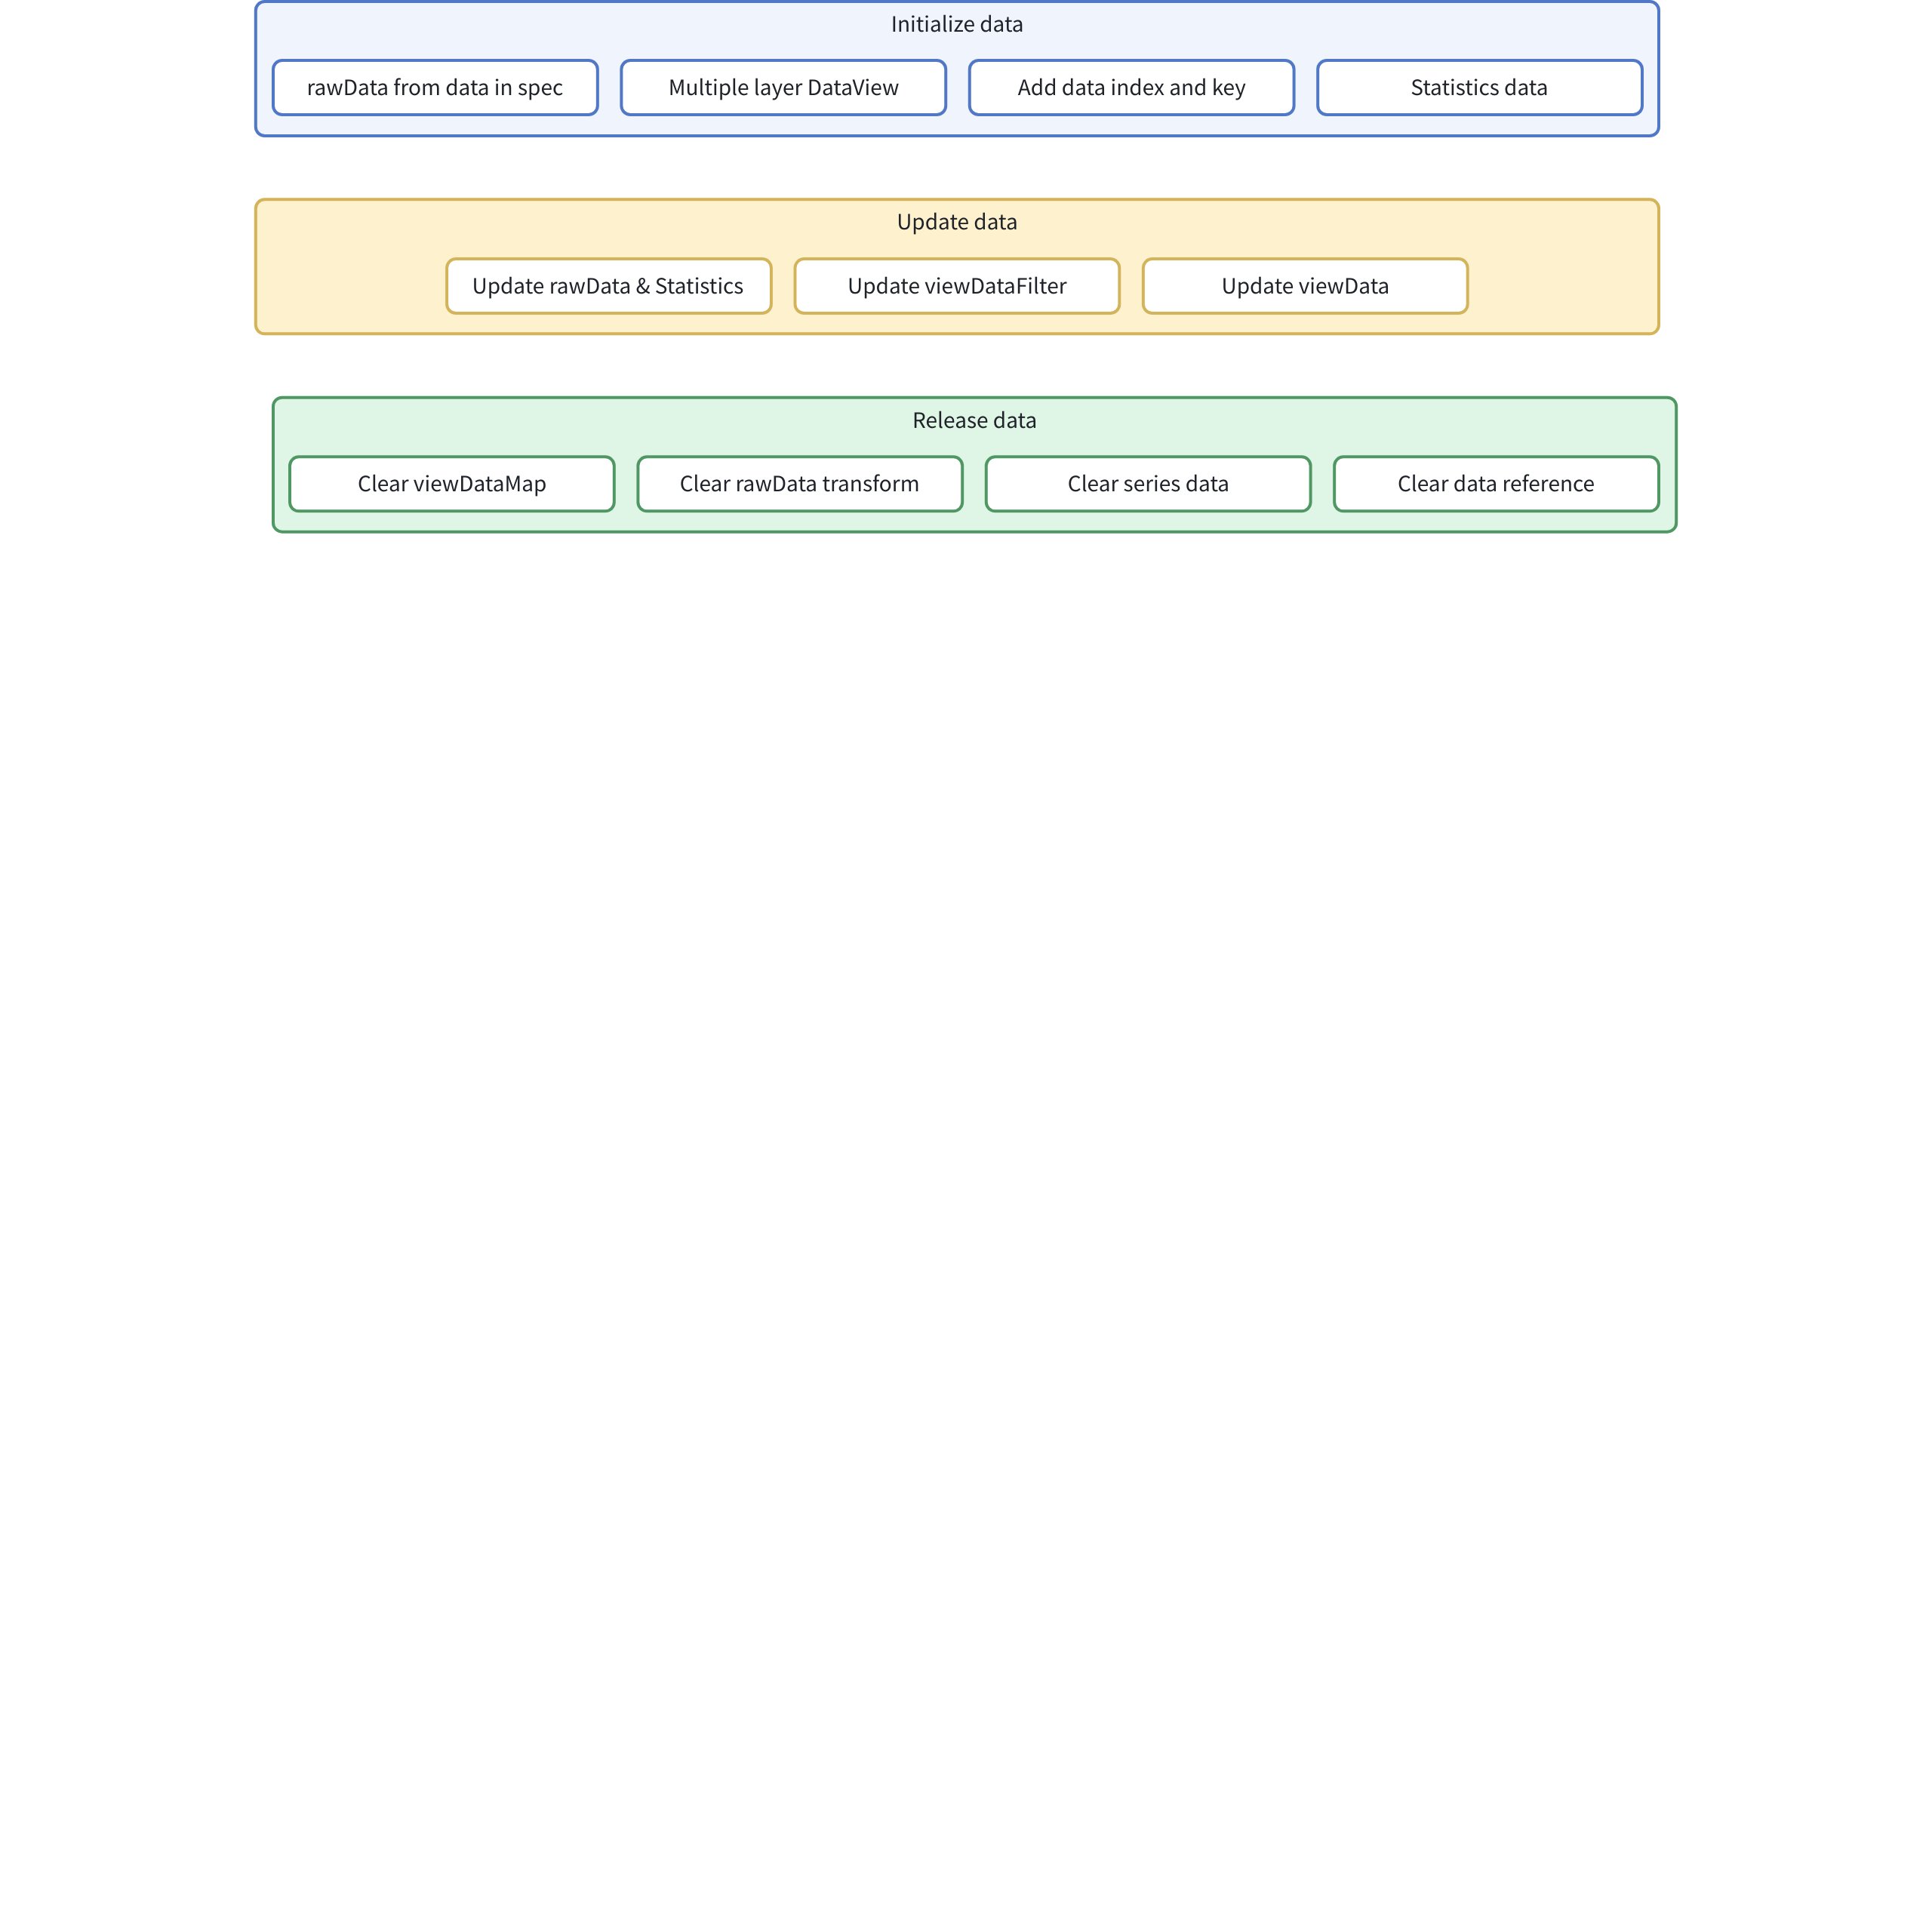
+
+### Initialization Phase
+
+```Typescript
+// packages/vchart/src/series/base/base-series.ts
+ protected initData(): void {
+ const d = this._spec.data ?? this._option.getSeriesData(this._spec.dataId, this._spec.dataIndex);
+ if (d) {
+ this._rawData = dataToDataView(d, this._dataSet, this._option.sourceDataList);
+ }
+ this._rawData?.target?.addListener('change', this.rawDataUpdate.bind(this));
+ this._addDataIndexAndKey();
+ // 初始化viewData
+ if (this._rawData) {
+ if (this.getStack()) {
+ // 初始化viewDataFilter
+ this._viewDataFilter = dataViewFromDataView(this._rawData, this._dataSet, {
+ name: `${this.type}_${this.id}_viewDataFilter`
+ });
+ }
+
+ // 初始化viewData
+ const viewData = dataViewFromDataView(this.getStack() ? this._viewDataFilter : this._rawData, this._dataSet, {
+ name: `${this.type}_${this.id}_viewData`
+ });
+ this._data = new SeriesData(this._option, viewData);
+
+ if (this.getStack()) {
+ this._viewDataFilter.target.removeListener('change', viewData.reRunAllTransform);
+ }
+ }
+
+ this.initInvalidDataTransform();
+ }
+
+```
+1. Extract data from the spec's data or option and convert it into a DataView
+
+1. Then register a Listener, which triggers the rawDataUpdate function when the data changes
+
+1. Add index and key to the Data
+
+1. Then we will generate DataViews of different levels
+
+1. If stacked data is needed, we create an intermediate DataView
+
+1. If stacked data is not needed, directly create viewData, which is used by the chart for statistics and rendering
+
+
+
+## 3.1.5 Component Configuration
+
+VChart also supports configuring various components of the chart, such as axes, legends, crosshair, and tooltip. Currently, the components supported by VChart are:
+
+# 3.2 Series
+
+## 3.2.1 Concept and Types
+
+In VChart, Series are the core building blocks of visual charts, responsible for mapping data into visual expressions. A series represents a set of related data items that share the same visual representation (such as line, bar, etc.). Series are converters from data to graphics, including data processing, coordinate mapping, visual encoding, and other functions. Each series type corresponds to a specific visual representation form, with unique data structure requirements and visual mapping rules.
+
+### Basic and Coordinate System Classes
+
+* base: Basic implementation of series, providing common functions for all series
+
+* cartesian: Cartesian coordinate system base class, used for X-Y axis series
+
+* polar: Polar coordinate system base class, used for circular and radial series
+
+* geo: Geographic coordinate system base class, used for map-related series
+
+### Cartesian Coordinate System Series
+
+* bar: Bar chart, used for category data comparison
+
+* line: Line chart, showing data trends and changes
+
+* area: Area chart, emphasizing cumulative changes in data volume
+
+* scatter: Scatter plot, showing the distribution of data points
+
+* box-plot: Box plot, displaying data distribution and outliers
+
+* dot: Dot plot, simplified scatter plot
+
+* heatmap: Heatmap, using color intensity to represent value size
+
+* range-area: Range area chart, showing upper and lower boundary areas
+
+* range-column: Range column chart, showing data range
+
+* waterfall: Waterfall chart, showing cumulative effects
+
+### Polar Coordinate System Series
+
+* pie: Pie chart, showing the relationship between part and whole
+
+* rose: Rose chart, circular display of multidimensional data
+
+* radar: Radar chart, radial display of multivariable data
+
+### Hierarchical Series
+
+* treemap: Treemap, nested rectangle display of hierarchical structure
+
+* sunburst: Sunburst chart, circular display of hierarchical data
+
+* circle-packing: Circle packing chart, nested circle display of hierarchical structure
+
+### Relational Series
+
+* sankey: Sankey diagram, showing flow and conversion relationships
+
+* correlation: Correlation chart, showing correlations between different dimensions
+
+* venn: Venn diagram, showing intersection relationships between sets
+
+* link: Link chart, showing connections between entities
+
+### Special Series
+
+* funnel: Funnel chart, showing conversion rates of multi-stage processes
+
+* gauge: Gauge chart, showing the achievement of a single indicator
+
+* liquid: Liquid chart, using liquid fill effect to show progress
+
+* map: Map series, displaying data in geographic space
+
+* mosaic: Mosaic chart, using rectangle area to display multidimensional data relationships
+
+* pictogram: Pictogram chart, using icons to represent data
+
+* progress: Progress bar, linear display of completion
+
+* word-cloud: Word cloud chart, displaying text data based on word frequency
+
+## 3.2.2 Series Data Management
+
+
+
+
+### Initialization Phase
+
+```Typescript
+// packages/vchart/src/series/base/base-series.ts
+ protected initData(): void {
+ const d = this._spec.data ?? this._option.getSeriesData(this._spec.dataId, this._spec.dataIndex);
+ if (d) {
+ this._rawData = dataToDataView(d, this._dataSet, this._option.sourceDataList);
+ }
+ this._rawData?.target?.addListener('change', this.rawDataUpdate.bind(this));
+ this._addDataIndexAndKey();
+ // 初始化viewData
+ if (this._rawData) {
+ if (this.getStack()) {
+ // 初始化viewDataFilter
+ this._viewDataFilter = dataViewFromDataView(this._rawData, this._dataSet, {
+ name: `${this.type}_${this.id}_viewDataFilter`
+ });
+ }
+
+ // 初始化viewData
+ const viewData = dataViewFromDataView(this.getStack() ? this._viewDataFilter : this._rawData, this._dataSet, {
+ name: `${this.type}_${this.id}_viewData`
+ });
+ this._data = new SeriesData(this._option, viewData);
+
+ if (this.getStack()) {
+ this._viewDataFilter.target.removeListener('change', viewData.reRunAllTransform);
+ }
+ }
+
+ this.initInvalidDataTransform();
+ }
+
+```
+1. Extract data from the spec's data or option and convert it into a DataView
+
+1. Then register a Listener, which triggers the rawDataUpdate function when the data changes
+
+1. Add index and key to the Data
+
+1. Then we will generate DataViews of different levels
+
+1. If stacked data is needed, we create an intermediate DataView
+
+1. If stacked data is not needed, directly create viewData, which is used by the chart for statistics and rendering
+
+;
+
+// 4. 更新原始数据
+updateRawData(d: any): void {
+ if (!this._rawData) {
+ return;
+ }
+ this._rawData.updateRawData(d);
+}
+
+// 5. 原始数据更新处理
+rawDataUpdate(d: DataView): void {
+ // 重新计算统计信息
+ this._rawDataStatistics?.reRunAllTransform();
+ // 清空缓存
+ this._rawStatisticsCache = null;
+ // 触发事件
+ this.event.emit(ChartEvent.rawDataUpdate, { model: this });
+}
+
+```
+#### Filter Layer
+
+
+```Typescript
+// 1. 数据过滤视图
+protected _viewDataFilter: DataView = null;
+
+// 2. 过滤完成处理
+viewDataFilterOver(d: DataView): void {
+ this.event.emit(ChartEvent.viewDataFilterOver, { model: this });
+}
+
+// 3. 添加数据过滤
+addViewDataFilter(option: ITransformOptions) {
+ (this._viewDataFilter ?? this.getViewData())?.transform(option, false);
+}
+
+// 4. 重新过滤数据
+reFilterViewData() {
+ (this._viewDataFilter ?? this.getViewData())?.reRunAllTransform();
+}
+
+```
+#### View Layer
+
+
+```Typescript
+// 1. 视图数据
+protected _data: SeriesData = null;
+
+// 2. 视图数据统计
+protected _viewDataStatistics!: DataView;
+
+// 3. 视图数据更新处理
+viewDataUpdate(d: DataView): void {
+ this.event.emit(ChartEvent.viewDataUpdate, { model: this });
+ this._data?.updateData();
+ this._viewDataStatistics && this._viewDataStatistics.reRunAllTransform();
+}
+
+// 4. 统计信息更新处理
+viewDataStatisticsUpdate(d: DataView): void {
+ this.event.emit(ChartEvent.viewDataStatisticsUpdate, { model: this });
+}
+
+```
+### Release Phase
+
+Mainly divided into the following processes:
+
+
+```Typescript
+release(): void {
+ super.release();
+
+ // 1. 清理视图数据映射
+ this._viewDataMap.clear();
+
+ // 2. 清理原始数据转换
+ const transformIndex = this._rawData?.transformsArr?.findIndex(t => t.type === 'addVChartProperty');
+ if (transformIndex >= 0) {
+ this._rawData.transformsArr.splice(transformIndex, 1);
+ }
+
+ // 3. 释放系列数据
+ this._data?.release();
+
+ // 4. 清空数据引用
+ this._dataSet = null;
+ this._data = null;
+ this._rawData = null;
+ this._rawDataStatistics = null;
+ this._viewDataStatistics = null;
+ this._viewStackData = null;
+}
+
+```
+## 3.2.3 Creation of Series Primitives
+
+1. Root Primitive:
+
+* Function: Acts as a container to organize and manage other primitives
+
+* Characteristics: Must be of group type
+
+* Position: Topmost level
+
+1. Series Primitive:
+
+* Function: Implements the core visualization functionality of the chart, used for drawing series
+
+* Characteristics: Related to specific chart types
+
+* Position: Main primitive under the root primitive
+
+1. Extension Primitive:
+
+* Function: Provides additional functional support
+
+* Characteristics: Optional, used to enhance chart functionality, such as labels
+
+* Position: Auxiliary primitive under the root primitive
+
+
+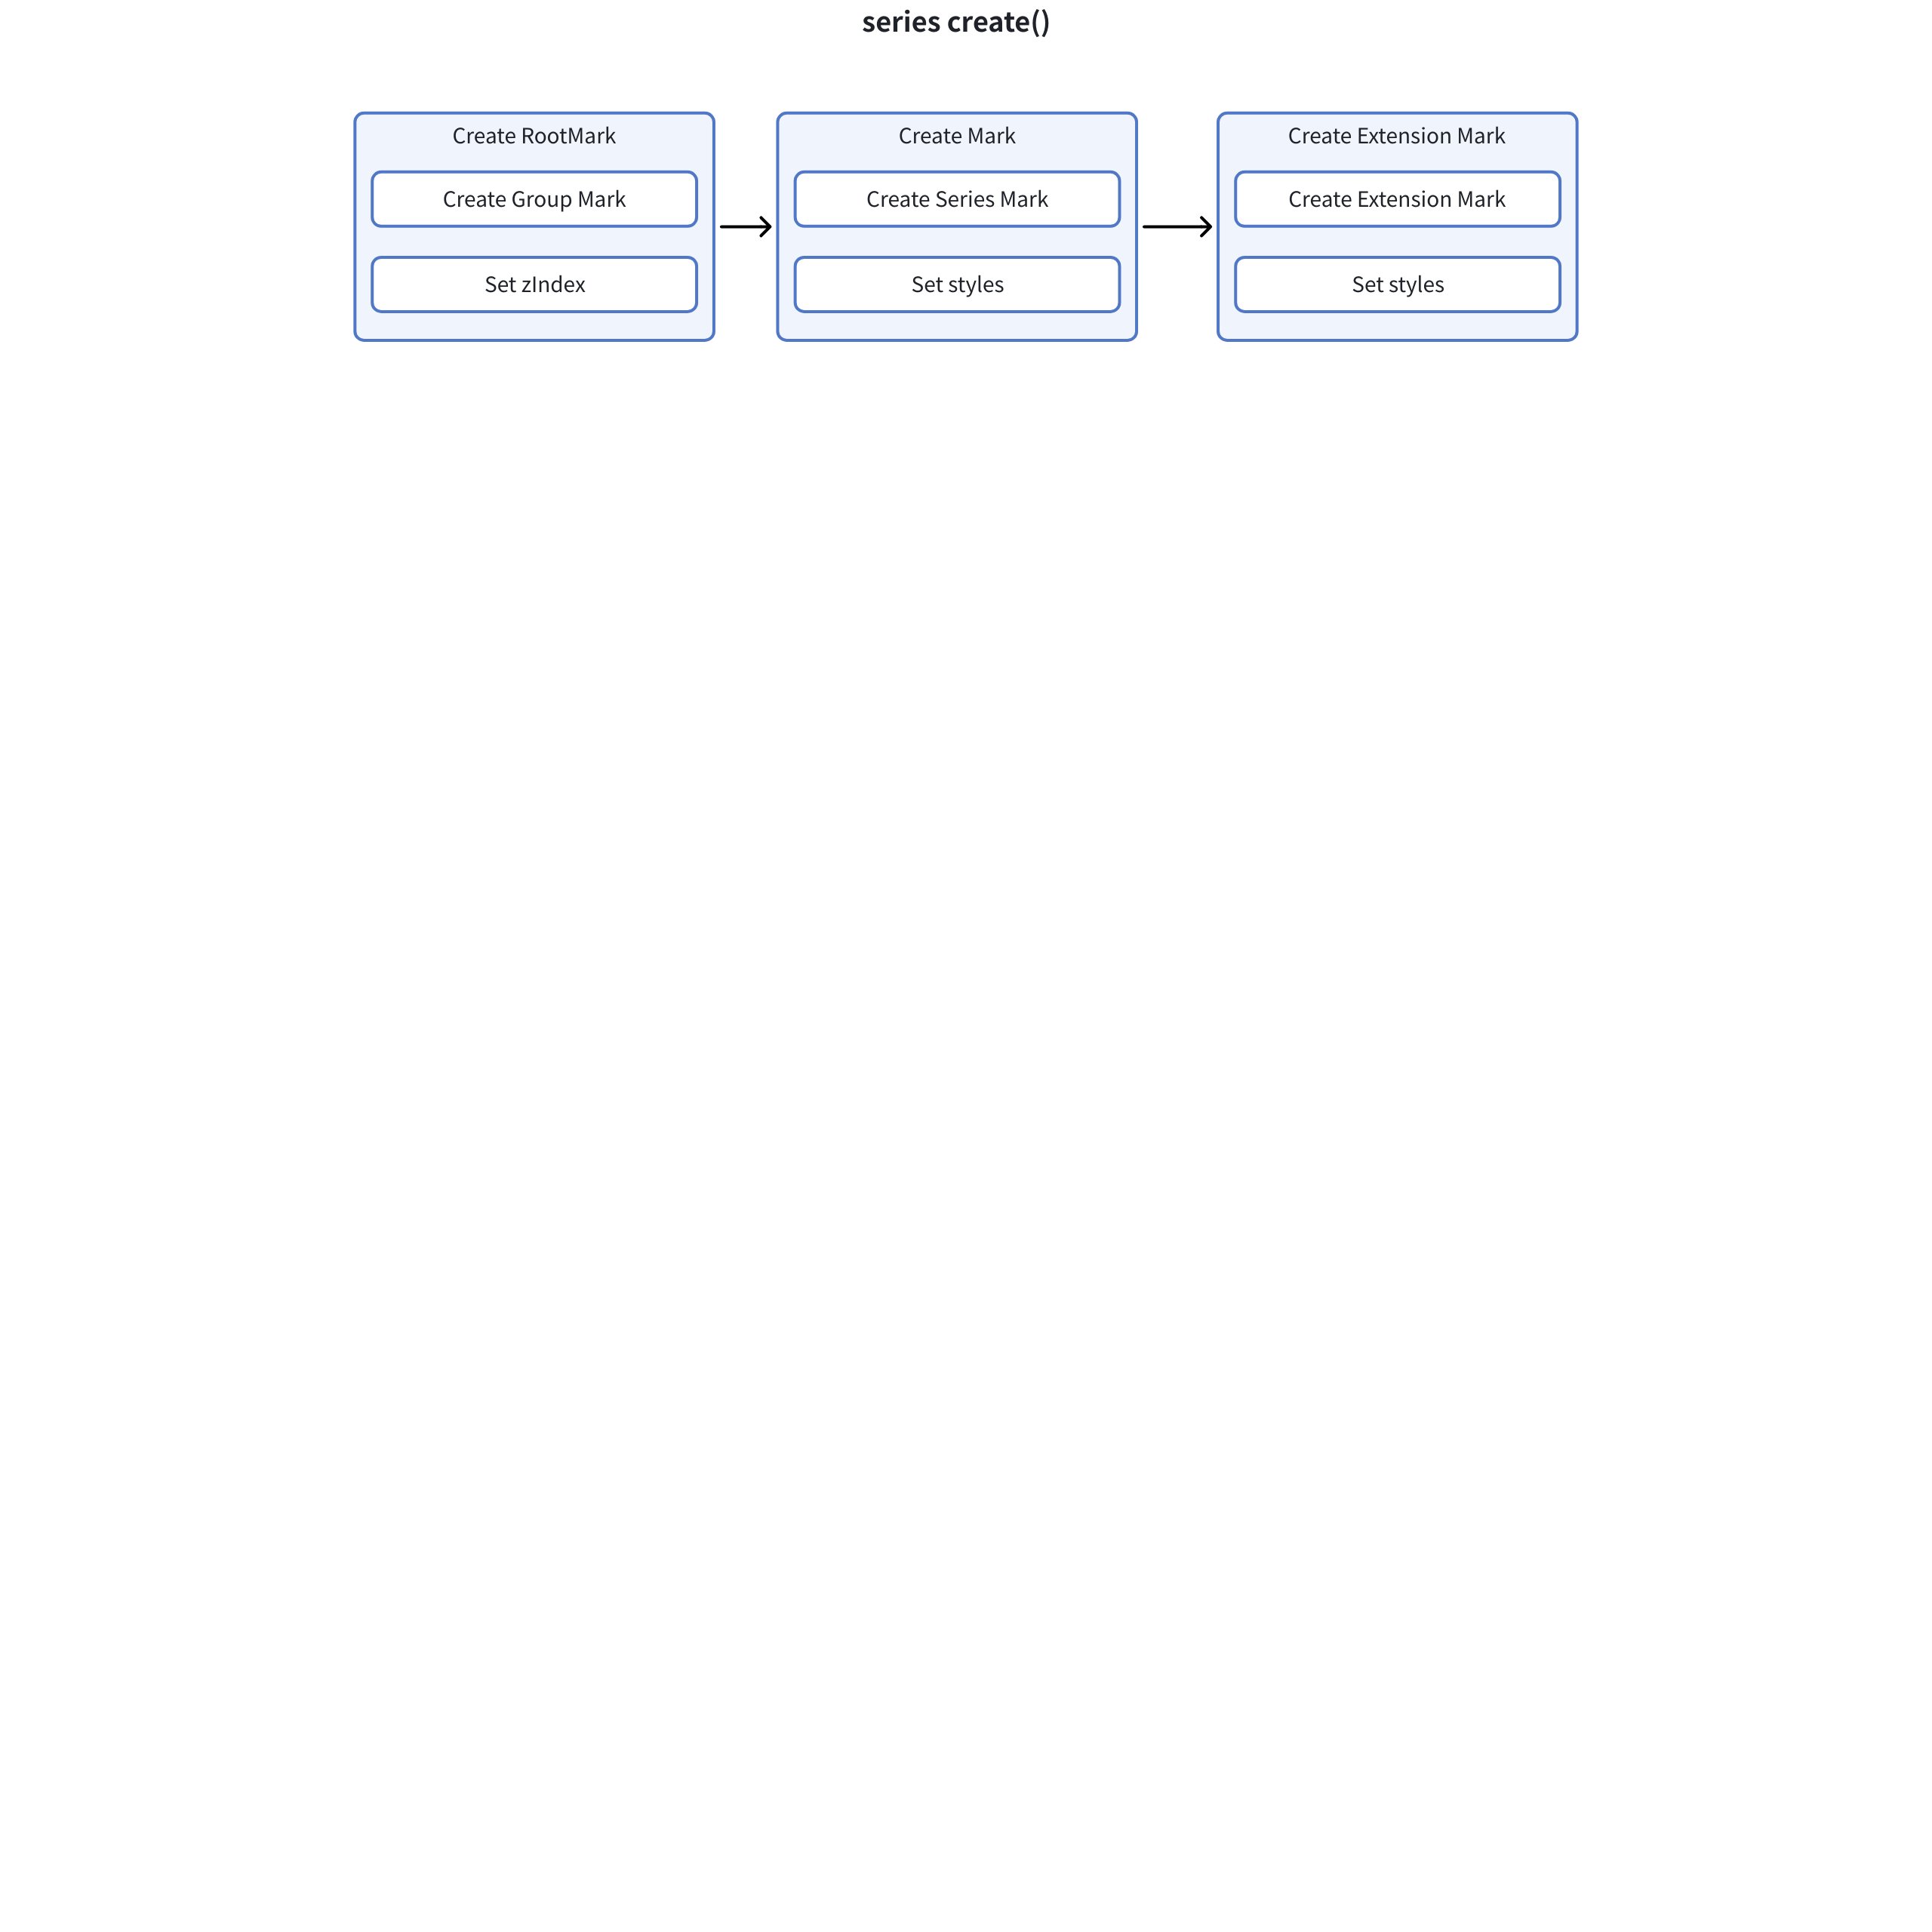
+
+### Create Entry
+
+```Typescript
+// BaseSeries 中的 created 方法
+created(): void {
+ super.created();
+
+ // 1. 构建图元属性上下文
+ this._buildMarkAttributeContext();
+
+ // 2. 初始化数据
+ this.initData();
+ this.initGroups();
+ this.initStatisticalData();
+
+ // 3. 初始化图元
+ this.initRootMark();
+ this.initMark();
+
+ // 4. 初始化扩展图元
+ const hasAnimation = isAnimationEnabledForSeries(this);
+ this._initExtensionMark({ hasAnimation });
+
+ // 5. 初始化样式和状态
+ this.initMarkStyle();
+ this.initMarkState();
+
+ // 6. 初始化动画
+ if (hasAnimation) {
+ this.initAnimation();
+ }
+
+ // 7. 初始化交互
+ if (!this._option.disableTriggerEvent) {
+ this.initInteraction();
+ }
+
+ this.afterInitMark();
+}
+
+```
+### Root Element Creation
+
+
+```Typescript
+initRootMark() {
+ // 1. 创建根图元
+ this._rootMark = this._createMark(
+ {
+ type: MarkTypeEnum.group,
+ name: `seriesGroup_${this.type}_${this.id}`
+ },
+ {
+ parent: this._region.getGroupMark?.(),
+ dataView: false
+ }
+ ) as IGroupMark;
+
+ // 2. 设置层级
+ this._rootMark.setMarkConfig({
+ zIndex: this._spec.zIndex ?? this.layoutZIndex
+ });
+}
+
+```
+### Series Primitive Creation
+
+
+```Typescript
+// 创建图元的通用方法
+protected _createMark(
+ markInfo: ISeriesMarkInfo,
+ option: ISeriesMarkInitOption = {},
+ config: ICompileMarkConfig = {}
+) {
+ const {
+ key,
+ groupKey,
+ skipBeforeLayouted,
+ themeSpec = {},
+ markSpec,
+ dataView,
+ dataProductId,
+ parent,
+ isSeriesMark,
+ depend,
+ stateSort,
+ noSeparateStyle = false
+ } = option;
+
+ // 1. 创建图元
+ const m = super._createMark(markInfo, {
+ key: key ?? this._getDataIdKey(),
+ seriesId: this.id,
+ attributeContext: this._markAttributeContext,
+ componentType: option.componentType,
+ noSeparateStyle
+ });
+
+ if (isValid(m)) {
+ // 2. 添加到图元集合
+ this._marks.addMark(m, { name: markInfo.name });
+
+ // 3. 设置系列图元
+ if (isSeriesMark) {
+ this._seriesMark = m;
+ }
+
+ // 4. 设置父级关系
+ if (isNil(parent)) {
+ this._rootMark?.addMark(m);
+ } else if (parent !== false) {
+ parent.addMark(m);
+ }
+
+ // 5. 设置数据视图
+ if (isNil(dataView)) {
+ m.setDataView(this.getViewData(), this.getViewDataProductId());
+ m.setSkipBeforeLayouted(true);
+ } else if (dataView !== false) {
+ m.setDataView(dataView, dataProductId);
+ }
+
+ // 6. 设置其他属性
+ if (isBoolean(skipBeforeLayouted)) {
+ m.setSkipBeforeLayouted(skipBeforeLayouted);
+ }
+
+ if (isValid(depend)) {
+ m.setDepend(...array(depend));
+ }
+
+ if (!isNil(groupKey)) {
+ m.setGroupKey(groupKey);
+ }
+
+ if (stateSort) {
+ m.setStateSortCallback(stateSort);
+ }
+
+ // 7. 设置图元配置
+ const markConfig: IMarkConfig = {
+ ...config,
+ morph: config.morph ?? false,
+ support3d: is3DMark(markInfo.type as MarkTypeEnum) ||
+ (config.support3d ?? (spec.support3d || !!(spec as any).zField)),
+ morphKey: spec.morph?.morphKey || `${this.getSpecIndex()}_${this.getMarks().length}`,
+ morphElementKey: spec.morph?.morphElementKey ?? config.morphElementKey
+ };
+
+ m.setMarkConfig(markConfig);
+
+ // 8. 初始化样式
+ this.initMarkStyleWithSpec(m, mergeSpec({}, themeSpec, markSpec || spec[m.name]));
+ }
+ return m;
+}
+
+```
+### Extended Primitive Initialization
+
+
+```Typescript
+protected _initExtensionMark(options: { hasAnimation: boolean; depend?: IMark[] }) {
+ if (!this._spec.extensionMark) {
+ return;
+ }
+
+ const mainMarks = this.getMarksWithoutRoot();
+ options.depend = mainMarks;
+
+ // 创建扩展图元
+ this._spec.extensionMark?.forEach((m, i) => {
+ this._createExtensionMark(
+ m,
+ null,
+ this._getExtensionMarkNamePrefix(),
+ i,
+ options
+ );
+ });
+}
+
+private _createExtensionMark(
+ spec: IExtensionMarkSpec> | IExtensionGroupMarkSpec,
+ parentMark: null | IGroupMark,
+ namePrefix: string,
+ index: number,
+ options: { hasAnimation: boolean; depend?: IMark[] }
+) {
+ // 1. 创建扩展图元
+ const mark = this._createMark(
+ {
+ type: spec.type,
+ name: isValid(spec.name) ? `${spec.name}` : `${namePrefix}_${index}`
+ },
+ {
+ skipBeforeLayouted: true,
+ markSpec: spec,
+ parent: parentMark,
+ dataView: false,
+ componentType: spec.componentType,
+ depend: options.depend,
+ key: spec.dataKey
+ },
+ {
+ setCustomizedShape: spec?.customShape
+ }
+ ) as IGroupMark;
+
+ if (!mark) {
+ return;
+ }
+
+ // 2. 设置用户ID
+ if (isValid(spec.id)) {
+ mark.setUserId(spec.id);
+ }
+
+ // 3. 设置动画
+ if (options.hasAnimation) {
+ const config = animationConfig(
+ {},
+ userAnimationConfig(spec.type, spec as any, this._markAttributeContext)
+ );
+ mark.setAnimationConfig(config);
+ }
+
+ // 4. 处理子图元
+ if (spec.type === 'group') {
+ namePrefix = `${namePrefix}_${index}`;
+ spec.children?.forEach((s, i) => {
+ this._createExtensionMark(s as any, mark, namePrefix, i, options);
+ });
+ }
+ // 5. 设置数据视图
+ else if (!parentMark && (!isNil(spec.dataId) || !isNil(spec.dataIndex))) {
+ const dataView = this._option.getSeriesData(spec.dataId, spec.dataIndex);
+ if (dataView === this._rawData) {
+ mark.setDataView(this.getViewData(), this.getViewDataProductId());
+ } else {
+ mark.setDataView(dataView);
+ dataView.target.addListener('change', () => {
+ mark.getData().updateData();
+ });
+ }
+ }
+}
+
+```
+## 3.2.4 Relationship between Series and `Region`
+
+Region is an important concept in VChart, representing an area in the chart used to organize and layout different chart components. Each Region can contain multiple Series and is responsible for managing the layout and rendering of these Series.
+
+Series use the information of the Region to layout:
+
+
+```Typescript
+// packages/vchart/src/series/base/base-series.ts
+export abstract class BaseSeries extends BaseModel implements ISeries {
+ // Region 引用
+ protected _region: IRegion = null as unknown as IRegion;
+
+ // 获取关联的 Region
+ getRegion(): IRegion {
+ return this._region;
+ }
+
+ // 构造函数中设置 Region
+ constructor(spec: T, options: ISeriesOption) {
+ super(spec, options);
+ this._region = options.region;
+ this._dataSet = options.dataSet;
+ this._spec?.name && (this.name = this._spec.name);
+ }
+
+ // 获取布局起始点
+ getLayoutStartPoint(): ILayoutPoint {
+ return this._region.getLayoutStartPoint();
+ }
+
+ // 获取布局矩形
+ getLayoutRect: () => ILayoutRect = () => {
+ return {
+ width: this._layoutRect.width ?? this._region.getLayoutRect().width,
+ height: this._layoutRect.height ?? this._region.getLayoutRect().height
+ };
+ };
+}
+
+```
+Region can add or remove Series \r\n\r
+```Typescript
+// packages/vchart/src/region/base/base-region.ts
+export abstract class BaseRegion extends BaseModel implements IRegion {
+ protected _series: ISeries[] = [];
+ protected _groupMark: IGroupMark;
+
+ // 添加系列
+ addSeries(series: ISeries): void {
+ this._series.push(series);
+ }
+
+ // 移除系列
+ removeSeries(series: ISeries): void {
+ const index = this._series.indexOf(series);
+ if (index > -1) {
+ this._series.splice(index, 1);
+ }
+ }
+
+ // 获取所有系列
+ getSeries(): ISeries[] {
+ return this._series;
+ }
+
+ // 获取区域组图元
+ getGroupMark(): IGroupMark {
+ return this._groupMark;
+ }
+
+ // 等待所有系列过滤完成
+ async waitAllSeriesFilterOver(): Promise {
+ const promises = this._series.map(series => {
+ return new Promise(resolve => {
+ series.event.on(
+ ChartEvent.viewDataFilterOver,
+ { filter: ({ model }) => model?.id === series.id },
+ () => resolve()
+ );
+ });
+ });
+ await Promise.all(promises);
+ }
+}
+
+```
+# 3.3 Chart Assembly
+
+## 3.3.1 How to Implement a Bar Chart
+
+
+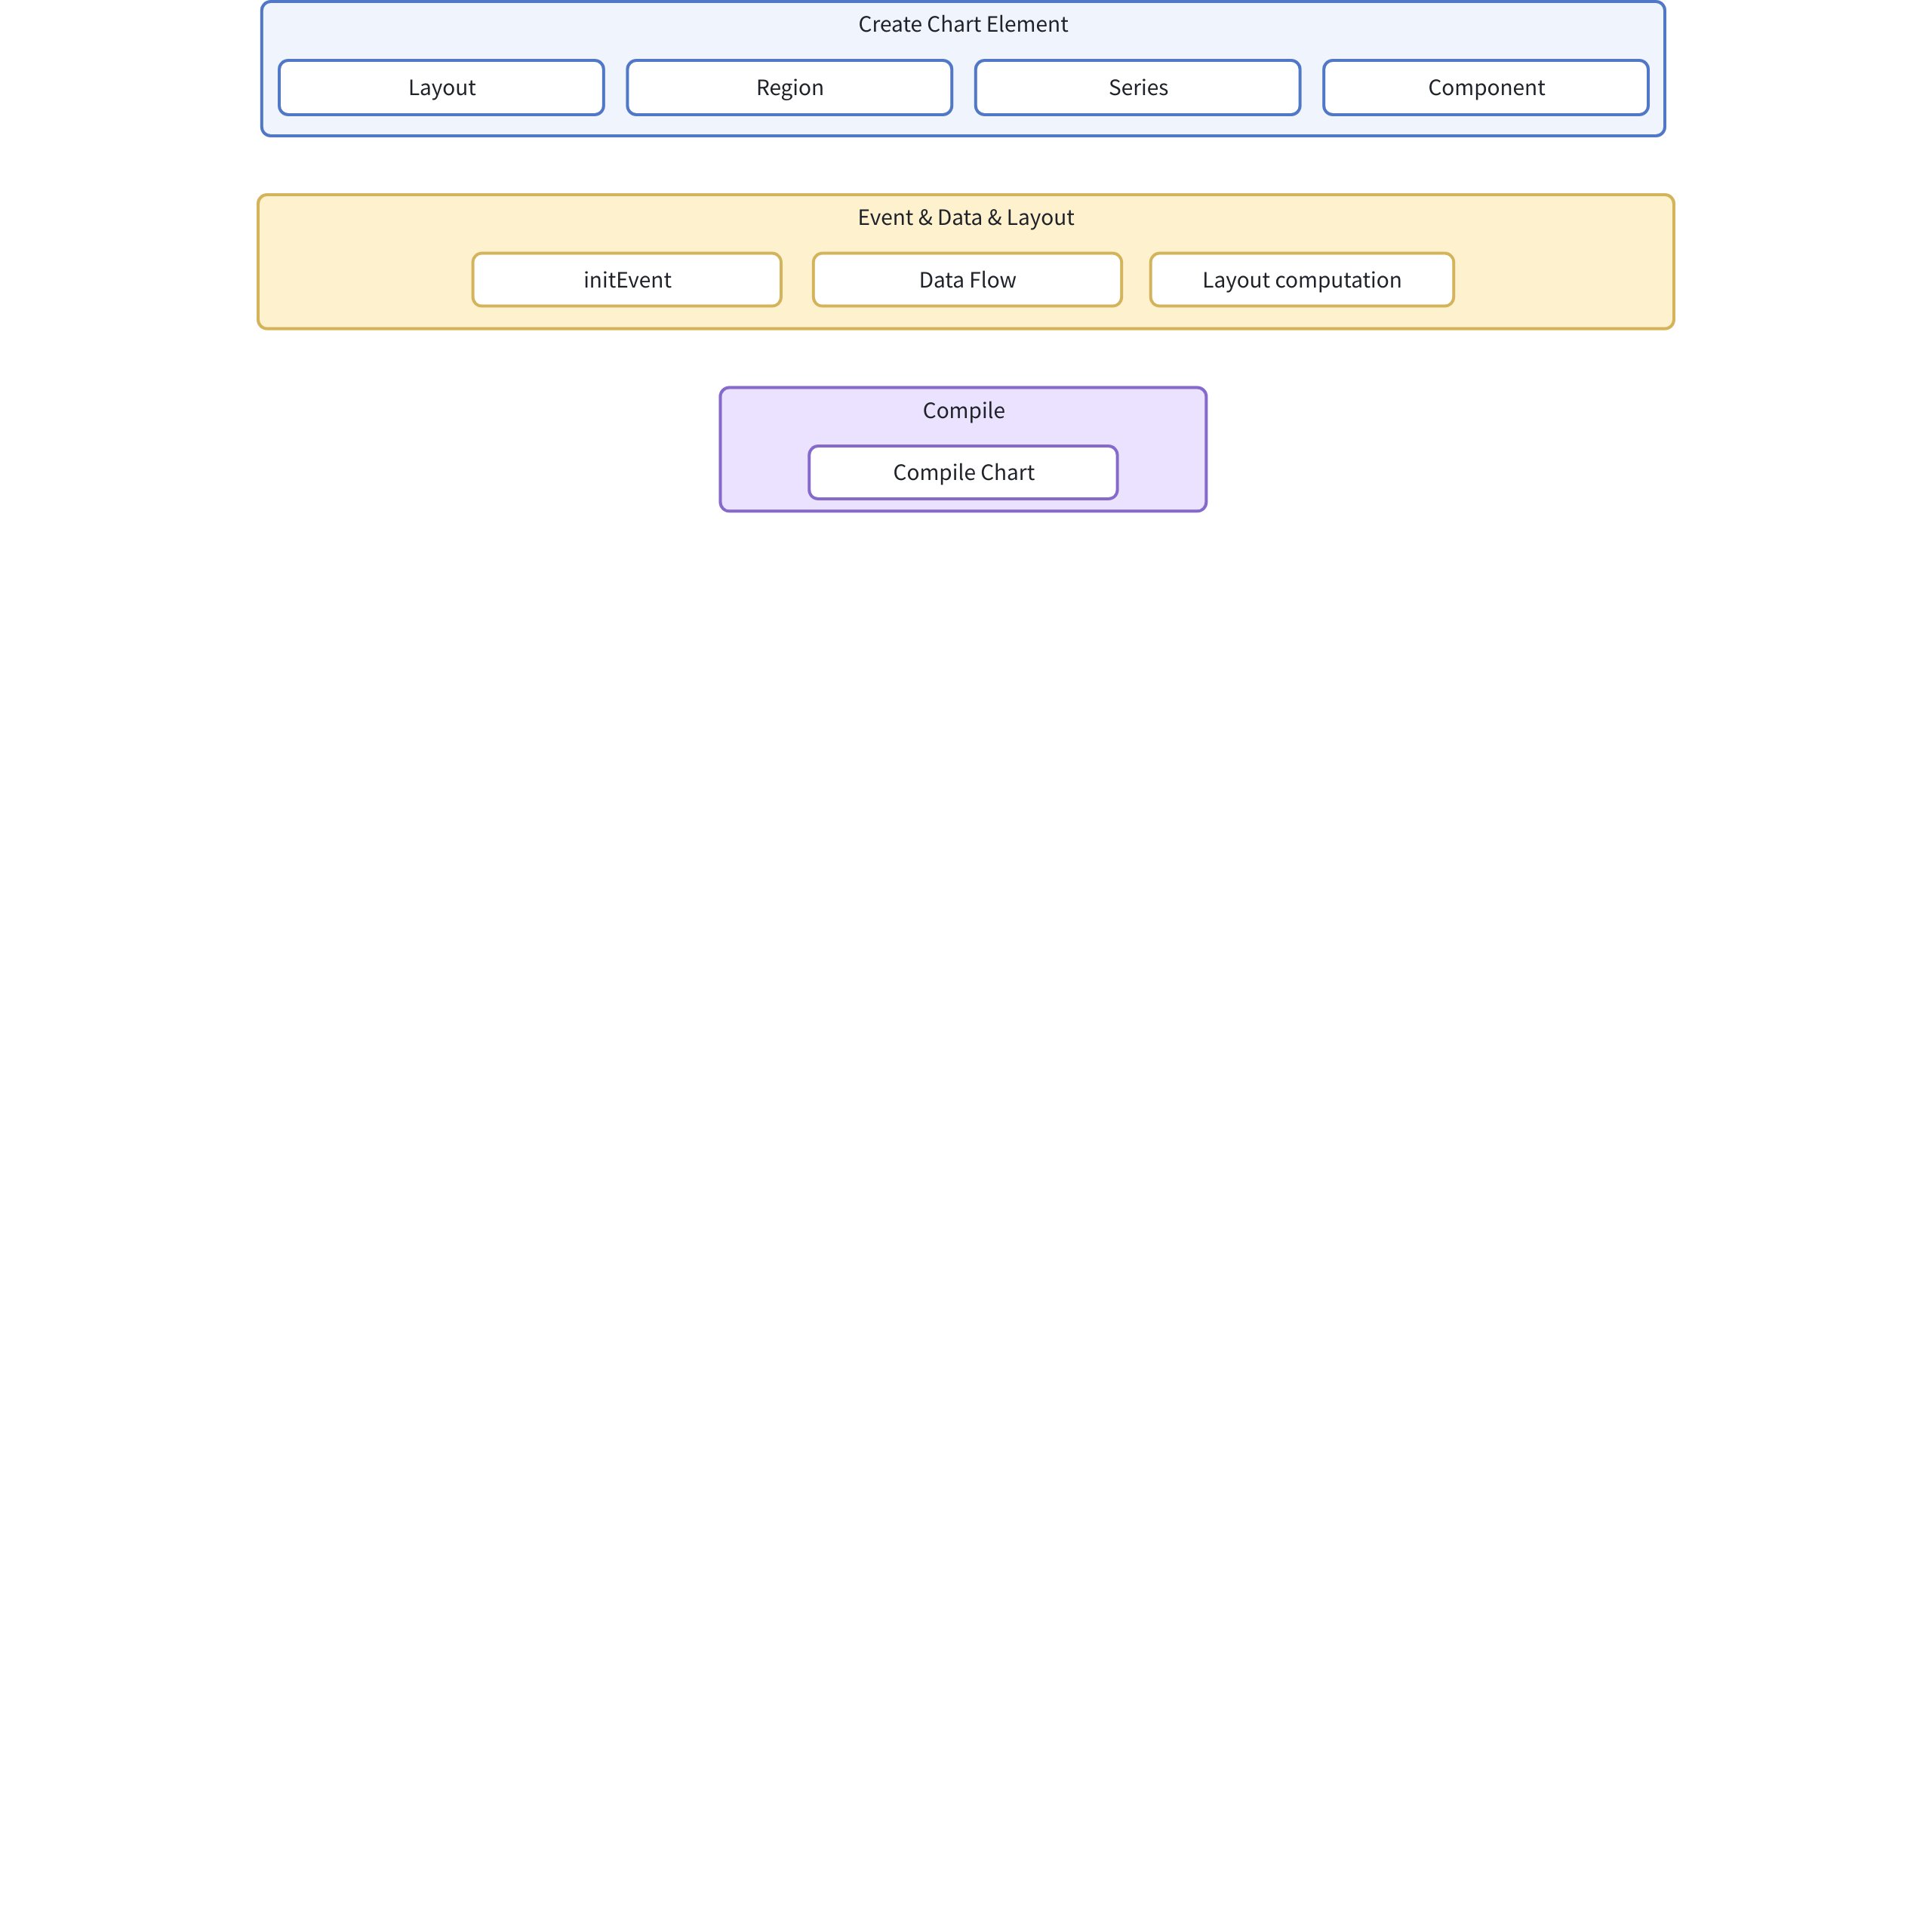
+
+First, we create a BarChart instance:
+
+```Typescript
+// packages/vchart/src/chart/bar/bar.ts
+export class BarChart extends BaseChart {
+ static readonly type: string = ChartTypeEnum.bar;
+ static readonly seriesType: string = SeriesTypeEnum.bar;
+ static readonly transformerConstructor = BarChartSpecTransformer;
+ readonly transformerConstructor = BarChartSpecTransformer;
+ readonly type: string = ChartTypeEnum.bar;
+ readonly seriesType: string = SeriesTypeEnum.bar;
+}
+
+// 注册 Bar Chart
+export const registerBarChart = () => {
+ registerBarSeries();
+ Factory.registerChart(BarChart.type, BarChart);
+};
+
+```
+Then it will trigger the constructor of BaseChart
+
+```Typescript
+// packages/vchart/src/chart/base/base-chart.ts
+constructor(spec: T, option: IChartOption) {
+ super(option);
+ this._paddingSpec = normalizeLayoutPaddingSpec(spec.padding ?? option.getTheme().padding);
+ this._event = new Event(option.eventDispatcher, option.mode);
+ this._dataSet = option.dataSet;
+ this._chartData = new ChartData(this._dataSet);
+ // ... 其他初始化
+}
+
+```
+### Create Element
+
+Layout
+
+
+```Typescript
+private _createLayout() {
+ this._updateLayoutRect(this._viewBox);
+ this._initLayoutFunc();
+}
+
+private _initLayoutFunc() {
+ this._layoutFunc = this._option.layout;
+ if (!this._layoutFunc) {
+ const constructor = Factory.getLayoutInKey(this._spec.layout?.type ?? 'base');
+ if (constructor) {
+ const layout = new constructor(this._spec.layout, {
+ onError: this._option?.onError
+ });
+ this._layoutFunc = layout.layoutItems.bind(layout);
+ }
+ }
+}
+
+```
+Create Region and Series
+
+```Typescript
+protected _createRegion(constructor: IRegionConstructor, specInfo: IModelSpecInfo) {
+ if (!constructor) return;
+ const { spec, ...others } = specInfo;
+ const region = new constructor(spec, {
+ ...this._modelOption,
+ ...others
+ });
+ if (region) {
+ region.created();
+ this._regions.push(region);
+ }
+}
+
+protected _createSeries(constructor: ISeriesConstructor, specInfo: IModelSpecInfo) {
+ if (!constructor) return;
+ const { spec, ...others } = specInfo;
+
+ // 获取对应的区域
+ let region: IRegion | undefined;
+ if (isValid(spec.regionId)) {
+ region = this.getRegionsInUserId(spec.regionId);
+ } else if (isValid(spec.regionIndex)) {
+ region = this.getRegionsInIndex([spec.regionIndex])[0];
+ }
+
+ if (!region && !(region = this._regions[0])) return;
+
+ // 创建系列
+ const series = new constructor(spec, {
+ ...this._modelOption,
+ ...others,
+ type: spec.type,
+ region,
+ globalScale: this._globalScale,
+ sourceDataList: this._chartData.dataList
+ });
+
+ if (series) {
+ series.created();
+ this._series.push(series);
+ region.addSeries(series);
+ }
+}
+
+```
+Create Component
+
+```xml
+ protected _createComponent(constructor: IComponentConstructor, specInfo: IModelSpecInfo) {
+ const component = constructor.createComponent(specInfo, {
+ ...this._modelOption,
+ type: constructor.type,
+ getAllRegions: this.getAllRegions,
+ getRegionsInIndex: this.getRegionsInIndex,
+ getRegionsInIds: this.getRegionsInIds,
+ getRegionsInUserIdOrIndex: this.getRegionsInUserIdOrIndex,
+ getAllSeries: this.getAllSeries,
+ getSeriesInIndex: this.getSeriesInIndex,
+ getSeriesInIds: this.getSeriesInIds,
+ getSeriesInUserIdOrIndex: this.getSeriesInUserIdOrIndex,
+ getAllComponents: this.getComponents,
+ getComponentByIndex: this.getComponentByIndex,
+ getComponentByUserId: this.getComponentByUserId,
+ getComponentsByKey: this.getComponentsByKey,
+ getComponentsByType: this.getComponentsByType
+ });
+ if (!component) {
+ return;
+ }
+ component.created();
+ this._components.push(component);
+ }
+
+```
+### Other Parts Besides Chart Visual Elements
+
+Initialization Event
+
+
+```Typescript
+ private _initEvent() {
+ [ChartEvent.dataZoomChange, ChartEvent.scrollBarChange].forEach(event => {
+ this._event.on(event, ({ value }) => {
+ this._disableMarkAnimation(['exit', 'update']);
+ const enableMarkAnimate = () => {
+ this._enableMarkAnimation(['exit', 'update']);
+ this._event.off(VGRAMMAR_HOOK_EVENT.AFTER_MARK_RENDER_END, enableMarkAnimate);
+ };
+ this._event.on(VGRAMMAR_HOOK_EVENT.AFTER_MARK_RENDER_END, enableMarkAnimate);
+ });
+ });
+ }
+
+```
+Data Stream Processing
+
+```Typescript
+reDataFlow() {
+ this._series.forEach(s => s.getRawData()?.markRunning());
+ this._series.forEach(s => s.fillData());
+ this.updateGlobalScaleDomain();
+}
+
+```
+Layout Calculation
+
+```xml
+layout(params: ILayoutParams): void {
+ if (this.getLayoutTag()) {
+ this._event.emit(ChartEvent.layoutStart, { chart: this });
+ this.onLayoutStart(params);
+ const elements = this.getLayoutElements();
+ this._layoutFunc(this, elements, this._layoutRect, this._viewBox);
+ this._event.emit(ChartEvent.afterLayout, { elements, chart: this });
+ this.setLayoutTag(false);
+ this.onLayoutEnd(params);
+ this._event.emit(ChartEvent.layoutEnd, { chart: this });
+ }
+}
+
+```
+### Compile Rendering
+
+
+```Typescript
+compile() {
+ this.compileBackground();
+ this.compileLayout();
+ this.compileRegions();
+ this.compileSeries();
+ this.compileComponents();
+}
+
+compileSeries() {
+ this._option.performanceHook?.beforeSeriesCompile?.();
+ this.getAllSeries().forEach(s => {
+ s.compile();
+ });
+ this._option.performanceHook?.afterSeriesCompile?.();
+}
+
+```
+## 3.3.2 Common chart
+
+Common Chart is a general chart type in VChart, which allows users to combine multiple different types of series in one chart. Let me analyze its implementation in detail.
+
+### Create adaptive series type
+
+
+```Typescript
+// packages/vchart/src/chart/common/common.ts
+export class CommonChart extends BaseChart> {
+ static readonly type: string = ChartTypeEnum.common;
+ static readonly transformerConstructor = CommonChartSpecTransformer;
+ readonly transformerConstructor = CommonChartSpecTransformer;
+ readonly type: string = ChartTypeEnum.common;
+}
+
+```
+`AdaptiveSpec`, allows Common Chart to accept any type of series configuration.
+
+### Series Registration Mechanism
+
+```Typescript
+// packages/vchart/src/core/factory.ts
+export class Factory {
+ private static _seriesMap: Map = new Map();
+
+ static registerSeries(type: string, constructor: ISeriesConstructor) {
+ this._seriesMap.set(type, constructor);
+ }
+
+ static getSeries(type: string): ISeriesConstructor {
+ return this._seriesMap.get(type);
+ }
+}
+
+```
+Common Chart achieves dynamic series registration through the Factory pattern, allowing Common Chart to register multiple series.
+
+### Special Handling of Series
+
+We need to take a closer look at the following three functions
+
+```xml
+// packages/vchart/src/chart/common/common-transformer.ts
+protected _getDefaultSeriesSpec(spec: AdaptiveSpec) {
+ const defaultSpec = super._getDefaultSeriesSpec(spec);
+ // 删除默认的 data 配置
+ delete defaultSpec.data;
+ return defaultSpec;
+}
+
+```
+The function's purpose is to:
+
+* Obtain the default configuration of the series
+
+* Inherit the default configuration of the parent class
+
+* Remove the default data configuration
+
+* Reason: In a composite chart, each series needs to decide its own data configuration and cannot use a unified default configuration
+
+```Typescript
+protected _transformAxisSpec(spec: AdaptiveSpec) {
+ if (!spec.axes) return;
+
+ if (!!spec.autoBandSize) {
+ spec.series.forEach((series: any, seriesIndex: number) => {
+ // 只处理柱状图系列
+ if (series.type === 'bar') {
+ // 找到对应的坐标轴
+ const relatedAxis = this._findBandAxisBySeries(series, seriesIndex, spec.axes);
+ if (relatedAxis && !relatedAxis.bandSize && !relatedAxis.maxBandSize && !relatedAxis.minBandSize) {
+ // 处理柱状图的宽度配置
+ const extend = isObject(series.autoBandSize) ? series.autoBandSize.extend ?? 0 : 0;
+ const { barMaxWidth, barMinWidth, barWidth, barGapInGroup } = series;
+ this._applyAxisBandSize(relatedAxis, extend, { barMaxWidth, barMinWidth, barWidth, barGapInGroup });
+ }
+ }
+ });
+ }
+}
+
+```
+The function's purpose is to:
+
+* Handle the configuration of the axes
+
+* Specifically handle the width configuration of bar charts
+
+* When autoBandSize is enabled:
+
+* Iterate over all series
+
+* Find the bar chart series
+
+* Find the corresponding axis
+
+* Calculate and set the width of the bars
+
+* Handle the spacing of the bars
+
+
+```Typescript
+transformSpec(spec: AdaptiveSpec): void {
+ // 1. 调用父类的转换方法
+ super.transformSpec(spec);
+
+ // 2. 处理系列配置
+ if (spec.series && spec.series.length) {
+ const defaultSeriesSpec = this._getDefaultSeriesSpec(spec);
+ spec.series.forEach((s: ISeriesSpec) => {
+ // 验证系列类型
+ if (!this._isValidSeries(s.type)) {
+ return;
+ }
+ // 应用默认配置
+ Object.keys(defaultSeriesSpec).forEach(k => {
+ if (!(k in s)) {
+ s[k] = defaultSeriesSpec[k];
+ }
+ });
+ });
+ }
+
+ // 3. 处理坐标轴配置
+ if (spec.axes && spec.axes.length) {
+ spec.axes.forEach((axis: any) => {
+ // 处理坐标轴内边距
+ if (get(axis, 'trimPadding')) {
+ mergeSpec(axis, getTrimPaddingConfig(this.type, spec));
+ }
+ });
+ }
+
+ // 4. 处理坐标轴的 bandSize 配置
+ this._transformAxisSpec(spec);
+}
+
+```
+This function is the main entry point for conversion, and its functions include:
+
+* Calling the conversion method of the parent class
+
+* Handling series configuration:
+
+* Obtaining default configuration
+
+* Validating series type
+
+* Applying default configuration
+
+* Handling axis configuration:
+
+* Handling padding
+
+* Handling bandSize
+
+These three functions together form the configuration conversion system of Common Chart, mainly solving:
+
+1. Handling of multi-series configuration
+
+1. Handling of special configuration for bar charts
+
+1. Handling of axis configuration
+
+This is the key implementation that distinguishes Common Chart from other chart types.
+
+
+
+# This document was revised and organized by
+[玄魂](https://github.com/xuanhun)
\ No newline at end of file
diff --git a/docs/assets/contributing/en/sourcecode/6.1-primitive-basic-concepts.md b/docs/assets/contributing/en/sourcecode/6.1-primitive-basic-concepts.md
new file mode 100644
index 0000000000..323e88a4e4
--- /dev/null
+++ b/docs/assets/contributing/en/sourcecode/6.1-primitive-basic-concepts.md
@@ -0,0 +1,237 @@
+---
+title: 6.1 Basic Concepts of Marks
+
+key words: VisActor,VChart,VTable,VStrory,VMind,VGrammar,VRender,Visualization,Chart,Data,Table,Graph,Gis,LLM
+---
+# Basic Concepts
+
+In VChart, **Marks** are the basic drawing units that make up a chart, representing the basic visual elements in a chart, such as points, lines, rectangles, polygons, etc. Generally, the users of marks mainly include:
+
+* `Series`: The part of the chart used to display data. Different types of series are composed of different types of marks. For example, a line chart is composed of point marks (endpoints) and line marks, while a pie chart is mainly composed of arc marks and area marks... At this time, the types of marks contained in the series are determined by the type of series.
+
+* `Component`: Chart elements that provide auxiliary capabilities in the chart, helping with chart reading and interaction, such as axes, legends, annotations, etc. These components are also composed of marks. Thus, marks are not only used to display data but also serve as the basic units that make up various elements in a chart.
+
+# Functions of Marks
+
+Overall, the functions of marks can be summarized as:
+
+1. **Constituting Charts**
+
+* Composing various components of a chart, for example, a legend item is composed of `symbol` marks and `text` marks.
+
+1. **Displaying Data**
+
+* Data Mapping: Marks map data into visual elements, making abstract data intuitive and understandable.
+
+* Information Conveyance: Through different types and styles of marks, convey the characteristics and trends of data.
+
+* Interaction Support: Marks support user interaction with the chart, such as hover, click, etc., enhancing the explorability of data.
+
+# Overview of Mark Types
+
+VChart defines various basic and composite mark types, including but not limited to:
+
+**Basic Marks:**
+
+* **Symbol:** Used to represent basic shapes of data points, such as points in a scatter plot.
+
+* **Rectangle (rect):** Used to draw bars in a bar chart, etc.
+
+* **Line:** Used to connect data points, commonly seen in line charts.
+
+* **Rule:** Draws a straight line at a specific position, can be used to indicate thresholds, etc.
+
+* **Arc:** Used to draw arcs, such as sectors in a pie chart.
+
+* **Area:** Represents filled areas, commonly used in area charts.
+
+* **Text:** Adds text annotations in the chart.
+
+* **Path:** Draws paths of arbitrary shapes.
+
+* **Image:** Embeds images in the chart.
+
+* **3D Rectangle (rect3d):** Used to draw 3D bar charts, etc.
+
+* **3D Arc (arc3d):** Used to draw sectors of 3D pie charts, etc.
+
+* **Polygon:** Draws polygonal areas.
+
+**Custom Marks:** See details
+
+# Code Structure
+
+The core code entry for implementing marks is `packages/vchart/src/mark`. This section provides a brief description of the code structure and functionality. For the specific logic of marks, see .
+
+The `mark` module can be divided into the following core modules:
+
+
+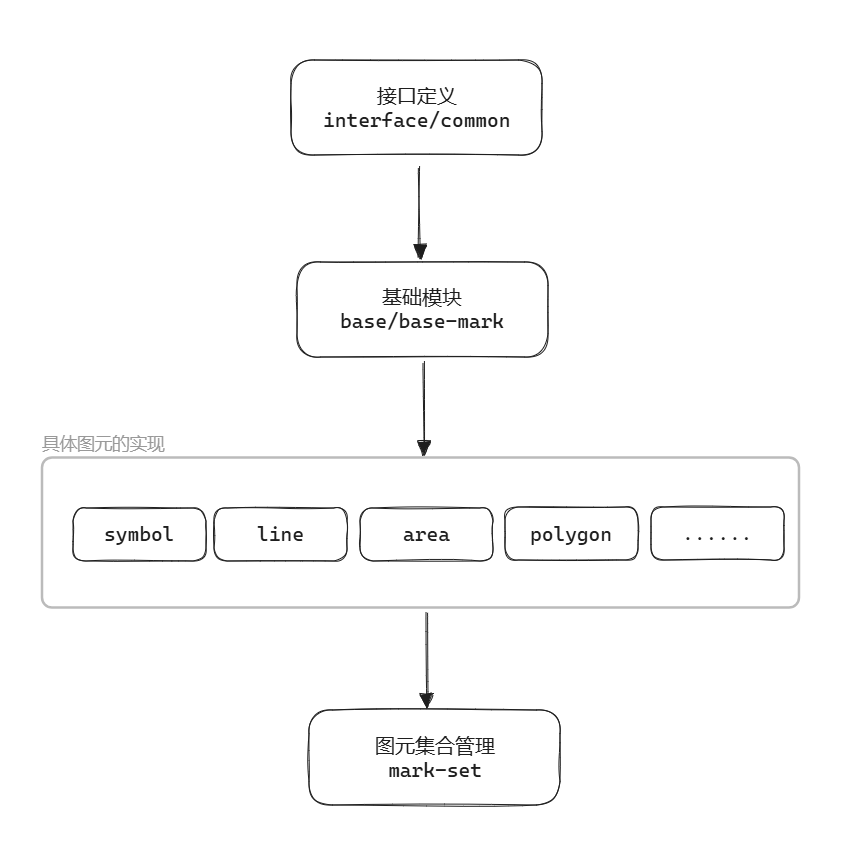 +
+Among them:
+
+* All specific Marks inherit from `BaseMark` and bridge with vgrammar through `CompilableMark`
+
+* All Marks implement the `IMarkRaw` interface, and for the style system, the `IVisualSpecStyle` interface needs to be implemented
+
+The inheritance chain where the graphic element is located:
+
+
+
+
+Among them:
+
+* All specific Marks inherit from `BaseMark` and bridge with vgrammar through `CompilableMark`
+
+* All Marks implement the `IMarkRaw` interface, and for the style system, the `IVisualSpecStyle` interface needs to be implemented
+
+The inheritance chain where the graphic element is located:
+
+
+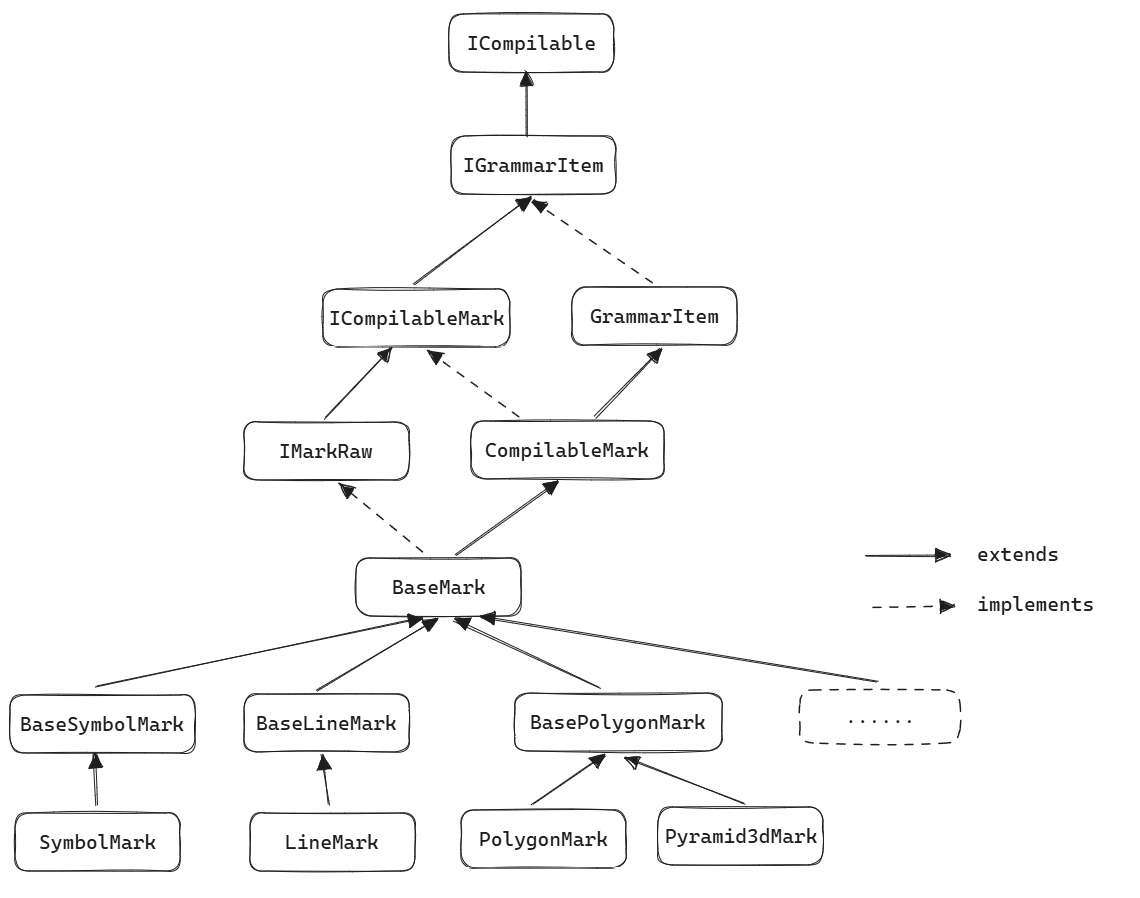 +
+
+
+1. Basic Module (base/)
+
+* Core file: `base-mark.ts`
+
+* Function overview: The base class for all graphic elements, containing common attributes and operations of the elements. Key attributes include:
+
+```Typescript
+ // 存储图元的样式状态,包括 normal、hover、selected 等状态的样式配置。
+ declare stateStyle: IMarkStateStyle
+
+
+
+1. Basic Module (base/)
+
+* Core file: `base-mark.ts`
+
+* Function overview: The base class for all graphic elements, containing common attributes and operations of the elements. Key attributes include:
+
+```Typescript
+ // 存储图元的样式状态,包括 normal、hover、selected 等状态的样式配置。
+ declare stateStyle: IMarkStateStyle;
+
+ // 图元的初始化选项,包含上下文、全局缩放、模型等信息。
+ protected declare _option: IMarkOption;
+
+ // 图元的属性上下文,通常与图元的使用者(如 series 或 component)相关。
+ protected _attributeContext: IModelMarkAttributeContext;
+
+ // 扩展通道,用于在计算通道时添加默认通道以确保更新有效。
+ _extensionChannel: {
+ [key: string | number | symbol]: string[];
+ } = {};
+
+ // 扩展计算通道,用于在计算属性时添加额外的计算逻辑。
+ _computeExChannel: {
+ [key: string | number | symbol]: ExChannelCall;
+ } = {};
+
+```
+The key interfaces provided externally are:
+
+```Typescript
+// *根据 spec 初始化 style*
+initStyleWithSpec(spec: IMarkSpec, key?: string);
+
+// 设置图元style
+setStyle(style: Partial>,state: StateValueType = 'normal',level: number = 0,stateStyle = this.stateStyle);
+
+// 获取style
+getStyle(key: string, state: StateValueType = 'normal'): any {return this.stateStyle[state][key]?.style;};
+
+// 计算属性值 这些属性值最终会被传递给底层渲染引擎(如 VGrammar)进行绘制
+getAttribute(key: U, datum: Datum, state: StateValueType = 'normal', opt?: IAttributeOpt);
+
+// 设置属性值
+setAttribute(attr: U,style: MarkInputStyle,state: StateValueType = 'normal',level: number = 0,stateStyle = this.stateStyle);
+
+```
+1. Interface Definition (interface/)
+
+* Core File: `common.ts`
+
+* Key Interfaces:
+
+```Typescript
+// IMarkRaw
+export interface IMarkRaw extends ICompilableMark {
+ // 图元状态样式(例如:hover,selected分别是什么样式)
+ readonly stateStyle: IMarkStateStyle;
+ // 图元属性
+ getAttribute: (key: U, datum: any, state?: StateValueType, opt?: any) => unknown;
+ setAttribute: (attr: U, style: StyleConvert, state?: StateValueType, level?: number) => void;
+ // 图元样式
+ setStyle: (style: Partial>, state?: StateValueType, level?: number) => void;
+ initStyleWithSpec: (spec: any, key?: string) => void;
+}
+
+// IMarkOption 用于初始化和管理图元的上下文、全局映射等信息。
+export interface IMarkOption extends ICompilableMarkOption {
+ model: IModel;
+ map: Map;
+ // 全局映射
+ globalScale: IGlobalScale;
+ // 关联系列编号
+ seriesId?: number;
+ // 组件图元具体类型
+ componentType?: string;
+ attributeContext?: IModelMarkAttributeContext;
+}
+
+
+```
+1. Specific Primitive Implementation:
+
+* Representative files: `line.ts` / `symbol.ts` / `arc-3d.ts`, etc.
+
+* Define additional configurations and operations for each type of primitive, generally need to implement:
+
+
+```Typescript
+protected _getDefaultStyle() {
+ const defaultStyle: IMarkStyle = {
+ ...super._getDefaultStyle()
+ // 图元特有的配置
+ };
+ return defaultStyle;
+}
+
+```
+For example, for the line element, the `_getIgnoreAttributes` method has been added to obtain the ignored attributes:
+
+
+```Typescript
+protected _getIgnoreAttributes(): string[] {
+ if (this.model?.type === SeriesTypeEnum.radar && this.model?.coordinate === *'polar'*) {
+ return [];
+ }
+ return [*'fill'*, *'fillOpacity'*];
+}
+
+```
+1. Primitive Set Management (mark-set)
+
+* Core file: `index.ts`
+
+* Main functions:
+
+* Provides unified management of multiple primitive instances, supporting add, delete, search, and update operations;
+
+* Supports searching primitives by name, type, ID, additional information, and other dimensions;
+
+* Stores metadata associated with Mark (`IMarkInfo`), used for style control and business logic judgment
+
+```xml
+export class MarkSet {
+ protected _children: IMark[] = []; // 存储所有 Mark 实例
+ protected _markNameMap: Record = {}; // 名称索引
+ protected readonly _infoMap = new Map(); // Mark 附加信息
+ // 添加 Mark 并关联信息
+ addMark(mark?: IMark, markInfo?: IMarkInfo) {
+ this._children.push(mark);
+ this._markNameMap[mark.name] = mark;
+ this._infoMap.set(mark, merge({}, MarkSet.defaultMarkInfo, markInfo));
+ }
+ // 按类型过滤 Mark
+ getMarksInType(type: string | string[]): IMark[] {
+ const types = array(type);
+ return this._children.filter(m => types.includes(m.type));
+ }
+ // 按自定义信息查找 Mark
+ getMarkWithInfo(info: Partial) {
+ return this._children.find(mark => {
+ return Object.keys(info).every(key => info[key] === this._infoMap.get(mark)[key]);
+ });
+ }
+ // 其他核心方法
+ removeMark() { /* 删除逻辑 */ }
+ clear() { /* 清空集合 */ }
+ get() { /* 多方式获取 Mark */ }
+}
+
+```
+
+
+ # This document was revised and organized by the following person
+ [玄魂](https://github.com/xuanhun)
\ No newline at end of file
diff --git a/docs/assets/contributing/en/sourcecode/6.2-visual-channel-mapping.md b/docs/assets/contributing/en/sourcecode/6.2-visual-channel-mapping.md
new file mode 100644
index 0000000000..48e587c0de
--- /dev/null
+++ b/docs/assets/contributing/en/sourcecode/6.2-visual-channel-mapping.md
@@ -0,0 +1,414 @@
+---
+title: 6.2 Visual Channel Mapping
+
+key words: VisActor,VChart,VTable,VStrory,VMind,VGrammar,VRender,Visualization,Chart,Data,Table,Graph,Gis,LLM
+---
+# Introduction
+
+**Visual mapping** is the bridge between data and images, mapping the "data model" to the "image model" and selecting suitable visual variables for different types of data. For example, if we use a bar chart to represent the average scores of boys and girls in a class, we can map the gender attribute in the data to the color attribute in the image, and map the score attribute in the data to the height (Y-axis coordinate) attribute of the bar chart in the image. Below, we analyze how data is mapped to the final image through a simple use case.
+
+
+
+# Mapping Process of Graphical Elements
+
+### Usage Example
+
+
+```xml
+const spec = {
+ type: 'line',
+ data: [
+ {
+ id: 'lineData',
+ values: [
+ { date: 'Monday', class: 'class No.1', score: 20 },
+ { date: 'Monday', class: 'class No.2', score: 30 },
+
+ { date: 'Tuesday', class: 'class No.1', score: 25 },
+ { date: 'Tuesday', class: 'class No.2', score: 28 }
+ ]
+ }
+ ],
+ seriesField: 'class',
+ xField: 'date',
+ yField: 'score',
+ point: {
+ style: {
+ fill: 'blue'
+ }
+ }
+};
+
+const vchart = new VChart(spec, { dom: CONTAINER_ID });
+vchart.renderSync();
+
+```
+This example creates a line type glyph series to display 4 data points, where points with the same `class` attribute will be connected into a line. The `date` attribute is mapped to the X-axis coordinate, and the `score` attribute is mapped to the Y-axis coordinate. The effect is as follows:
+
+
+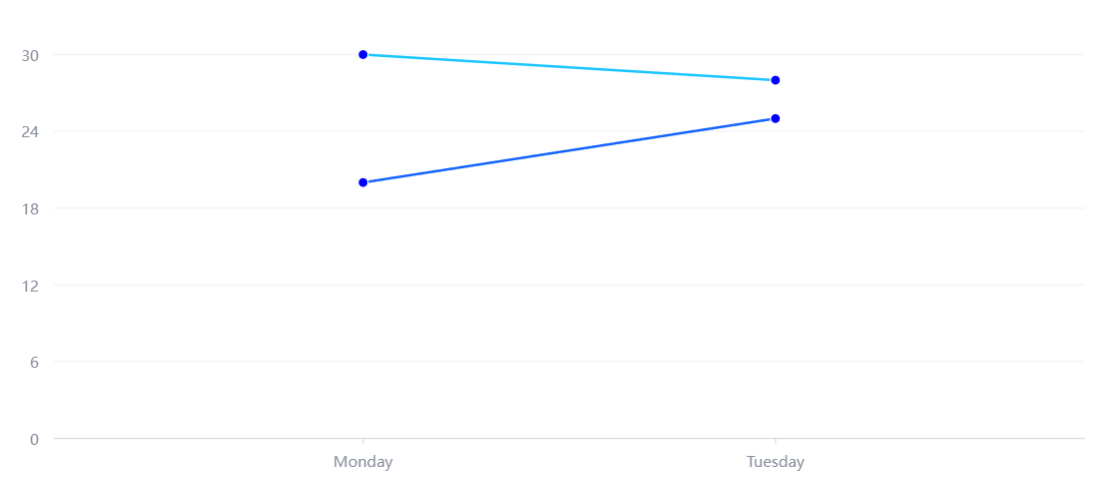 +
+### Creation of Primitives
+
+Below we analyze through code how `renderSync()` parses the configuration `spec` and generates various primitives on the graph. Overall, `renderSync()` includes the following three stages: pre-rendering, rendering, and post-rendering.
+
+```Typescript
+ // packages/vchart/src/core/vchart.ts
+ protected ***_renderSync*** = (option: IVChartRenderOption = {}) => {
+ const self = this as unknown as IVChart;
+ if (!this.***_beforeRender***(option)) {
+ return self;
+ }
+ this._compiler?.***render***(option.morphConfig);
+ this.***_afterRender***();
+ return self;
+ };
+
+```
+The rendering process belongs to the domain of `VGrammar`, and after rendering, the main focus is on updating the animation state. We mainly focus on the **pre-render preparation** related to the graphics, including initializing chart configurations, instantiating charts, and compiling rendering instructions.
+
+##### 1. Initialize Chart Configurations
+
+
+
+### Creation of Primitives
+
+Below we analyze through code how `renderSync()` parses the configuration `spec` and generates various primitives on the graph. Overall, `renderSync()` includes the following three stages: pre-rendering, rendering, and post-rendering.
+
+```Typescript
+ // packages/vchart/src/core/vchart.ts
+ protected ***_renderSync*** = (option: IVChartRenderOption = {}) => {
+ const self = this as unknown as IVChart;
+ if (!this.***_beforeRender***(option)) {
+ return self;
+ }
+ this._compiler?.***render***(option.morphConfig);
+ this.***_afterRender***();
+ return self;
+ };
+
+```
+The rendering process belongs to the domain of `VGrammar`, and after rendering, the main focus is on updating the animation state. We mainly focus on the **pre-render preparation** related to the graphics, including initializing chart configurations, instantiating charts, and compiling rendering instructions.
+
+##### 1. Initialize Chart Configurations
+
+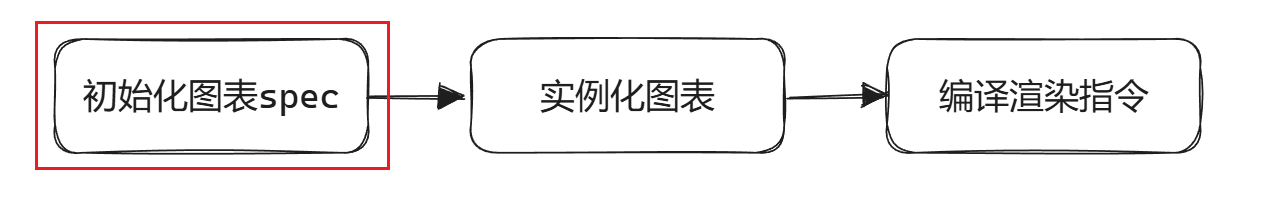 +
+```Typescript
+ // packages/vchart/src/core/vchart.ts
+ private ***_initChartSpec***(spec: any, actionSource: VChartRenderActionSource) {
+ // 如果用户注册了函数,在配置中替换相应函数名为函数内容
+ if (VChart.***getFunctionList***() && VChart.***getFunctionList***().length) {
+ spec = ***functionTransform***(spec, VChart);
+ }
+ this._spec = spec;
+ // 创建图表配置转换器,并转换为common chart的配置
+ if (!this._chartSpecTransformer) {
+ this._chartSpecTransformer = Factory.***createChartSpecTransformer***(
+ this._spec.type,
+ this.***_getChartOption***(this._spec.type)
+ );
+ }
+ this._chartSpecTransformer?.***transformSpec***(this._spec);
+ // 转换模型配置
+ this._specInfo = this._chartSpecTransformer?.***transformModelSpec***(this._spec);
+ }
+
+```
+First, replace the function name registered by the user with the corresponding function entity. Then, according to the chart type, create the corresponding chart configuration converter to convert the configuration of this type of chart into the configuration of the `common` type chart. This includes creating a default `series` based on the chart type and completing the user-defined `series` configuration:
+
+
+```xml
+ // packages/vchart/src/chart/cartesian/cartesian-transformer.ts
+ const defaultSeriesSpec = this.***_getDefaultSeriesSpec***(spec);
+ if (!spec.series || spec.series.length === 0) { // 没有用户定义的系列 采用默认
+ spec.series = [defaultSeriesSpec];
+ } else {
+ spec.series.***forEach***((s: ISeriesSpec) => {
+ if (!this.***_isValidSeries***(s.type)) { // 判断用户定义系列是否有效
+ return;
+ }
+ Object.***keys***(defaultSeriesSpec).***forEach***(k => { // 补全配置
+ if (!(k in s)) {
+ s[k] = defaultSeriesSpec[k];
+ }
+ });
+ });
+ }
+
+```
+
+
+##### 2. Instantiate the Chart
+
+
+
+```Typescript
+ // packages/vchart/src/core/vchart.ts
+ private ***_initChartSpec***(spec: any, actionSource: VChartRenderActionSource) {
+ // 如果用户注册了函数,在配置中替换相应函数名为函数内容
+ if (VChart.***getFunctionList***() && VChart.***getFunctionList***().length) {
+ spec = ***functionTransform***(spec, VChart);
+ }
+ this._spec = spec;
+ // 创建图表配置转换器,并转换为common chart的配置
+ if (!this._chartSpecTransformer) {
+ this._chartSpecTransformer = Factory.***createChartSpecTransformer***(
+ this._spec.type,
+ this.***_getChartOption***(this._spec.type)
+ );
+ }
+ this._chartSpecTransformer?.***transformSpec***(this._spec);
+ // 转换模型配置
+ this._specInfo = this._chartSpecTransformer?.***transformModelSpec***(this._spec);
+ }
+
+```
+First, replace the function name registered by the user with the corresponding function entity. Then, according to the chart type, create the corresponding chart configuration converter to convert the configuration of this type of chart into the configuration of the `common` type chart. This includes creating a default `series` based on the chart type and completing the user-defined `series` configuration:
+
+
+```xml
+ // packages/vchart/src/chart/cartesian/cartesian-transformer.ts
+ const defaultSeriesSpec = this.***_getDefaultSeriesSpec***(spec);
+ if (!spec.series || spec.series.length === 0) { // 没有用户定义的系列 采用默认
+ spec.series = [defaultSeriesSpec];
+ } else {
+ spec.series.***forEach***((s: ISeriesSpec) => {
+ if (!this.***_isValidSeries***(s.type)) { // 判断用户定义系列是否有效
+ return;
+ }
+ Object.***keys***(defaultSeriesSpec).***forEach***(k => { // 补全配置
+ if (!(k in s)) {
+ s[k] = defaultSeriesSpec[k];
+ }
+ });
+ });
+ }
+
+```
+
+
+##### 2. Instantiate the Chart
+
+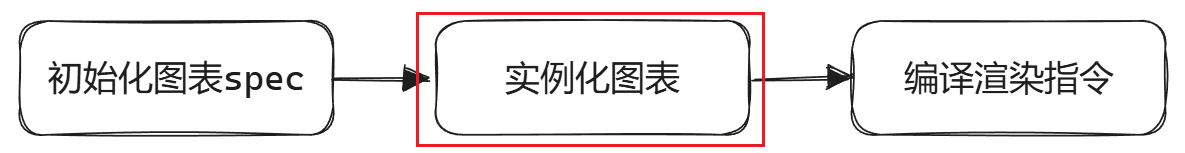 +
+Next, create a chart object of the corresponding type. The chart object here does not refer to the `VChart` object created below. `VChart` encapsulates the chart, serving as the entry point for user operations, responsible for global management and external interfaces of the chart;
+
+```xml
+const vchart = new VChart(spec, { dom: CONTAINER_ID });
+
+```
+The instantiated chart here is responsible for the specific chart construction (such as creating and managing series, components) and internal logic processing (managing data flow, global mapping, graphic element states, etc.).
+
+```Typescript
+ // packages/vchart/src/core/vchart.ts
+ private ***_initChart***(spec: any) {
+ // 创建真正的图表对象
+ const chart = Factory.***createChart***(spec.type, spec, this.***_getChartOption***(spec.type));
+ this._chart = chart;
+ // 进行图表初始化
+ this._chart.***setCanvasRect***(this._currentSize.width, this._currentSize.height);
+ this._chart.***created***();
+ this._chart.***init***();
+ this._event.***emit***(ChartEvent.initialized, {
+ chart,
+ vchart: this
+ });
+ }
+
+```
+The core steps are `created` and `init`, the former creates various elements according to `spec`, such as `region`, `series`, `components`, and the latter initializes each element. We focus on the graphic elements in the creation of `series`.
+
+```xml
+ // packages/vchart/src/series/base/base-series.ts
+ ***created***(): void {
+ ...
+ this.***initMark***();
+ ...
+ }
+
+```
+Since the type of our chart is `line`, there is a default `line` series. We look at the implementation of `initMark` in the `line-series`:
+
+```xml
+ // packages/vchart/src/series/line/line.ts
+ ***initMark***(): void {
+ ...
+ const seriesMark = this._spec.seriesMark ?? *'line'*;
+ this.***initLineMark***(progressive, seriesMark === *'line'*);
+ this.***initSymbolMark***(progressive, seriesMark === *'point'*);
+ }
+
+```
+It was found that indeed the `line` primitives and `symbol` primitives continued to be created:
+
+
+
+
+Next, create a chart object of the corresponding type. The chart object here does not refer to the `VChart` object created below. `VChart` encapsulates the chart, serving as the entry point for user operations, responsible for global management and external interfaces of the chart;
+
+```xml
+const vchart = new VChart(spec, { dom: CONTAINER_ID });
+
+```
+The instantiated chart here is responsible for the specific chart construction (such as creating and managing series, components) and internal logic processing (managing data flow, global mapping, graphic element states, etc.).
+
+```Typescript
+ // packages/vchart/src/core/vchart.ts
+ private ***_initChart***(spec: any) {
+ // 创建真正的图表对象
+ const chart = Factory.***createChart***(spec.type, spec, this.***_getChartOption***(spec.type));
+ this._chart = chart;
+ // 进行图表初始化
+ this._chart.***setCanvasRect***(this._currentSize.width, this._currentSize.height);
+ this._chart.***created***();
+ this._chart.***init***();
+ this._event.***emit***(ChartEvent.initialized, {
+ chart,
+ vchart: this
+ });
+ }
+
+```
+The core steps are `created` and `init`, the former creates various elements according to `spec`, such as `region`, `series`, `components`, and the latter initializes each element. We focus on the graphic elements in the creation of `series`.
+
+```xml
+ // packages/vchart/src/series/base/base-series.ts
+ ***created***(): void {
+ ...
+ this.***initMark***();
+ ...
+ }
+
+```
+Since the type of our chart is `line`, there is a default `line` series. We look at the implementation of `initMark` in the `line-series`:
+
+```xml
+ // packages/vchart/src/series/line/line.ts
+ ***initMark***(): void {
+ ...
+ const seriesMark = this._spec.seriesMark ?? *'line'*;
+ this.***initLineMark***(progressive, seriesMark === *'line'*);
+ this.***initSymbolMark***(progressive, seriesMark === *'point'*);
+ }
+
+```
+It was found that indeed the `line` primitives and `symbol` primitives continued to be created:
+
+
+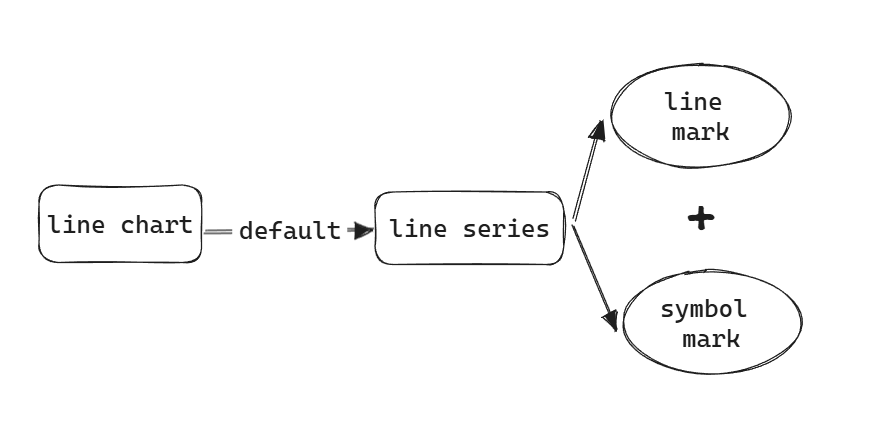 +
+After a series of function calls (`LineLikeSeriesMixin.initLineMark` -> `BaseSeries._createMark` -> `BaseModel._createMark` -> `Factory.createMark`), it finally reaches the constructor of the corresponding graphic element, which is the "implementation of specific graphic elements" mentioned earlier.
+
+
+
+##### **3. Compile Rendering Instructions**
+
+Compile various `VChart` models (`region`, `series`, `component`) into renderable `VGrammar` syntax elements, involving the content of the `VGrammar` syntax layer, which will not be analyzed in detail.
+
+
+
+### Mapping of Graphic Element Visual Configuration
+
+In the `BaseMark` class, graphic elements achieve the mapping from data to visual channels through a series of methods and logic. This can be roughly divided into two processes: the storage of attributes and the calculation of attribute values. The former simply parses the user-defined `spec` and stores it in the style sheets of various states of the graphic element, during which some simple conversions are made; the latter is where the user of the graphic element truly obtains and calculates specific attribute values when laying out the graphic element.
+
+
+
+After a series of function calls (`LineLikeSeriesMixin.initLineMark` -> `BaseSeries._createMark` -> `BaseModel._createMark` -> `Factory.createMark`), it finally reaches the constructor of the corresponding graphic element, which is the "implementation of specific graphic elements" mentioned earlier.
+
+
+
+##### **3. Compile Rendering Instructions**
+
+Compile various `VChart` models (`region`, `series`, `component`) into renderable `VGrammar` syntax elements, involving the content of the `VGrammar` syntax layer, which will not be analyzed in detail.
+
+
+
+### Mapping of Graphic Element Visual Configuration
+
+In the `BaseMark` class, graphic elements achieve the mapping from data to visual channels through a series of methods and logic. This can be roughly divided into two processes: the storage of attributes and the calculation of attribute values. The former simply parses the user-defined `spec` and stores it in the style sheets of various states of the graphic element, during which some simple conversions are made; the latter is where the user of the graphic element truly obtains and calculates specific attribute values when laying out the graphic element.
+
+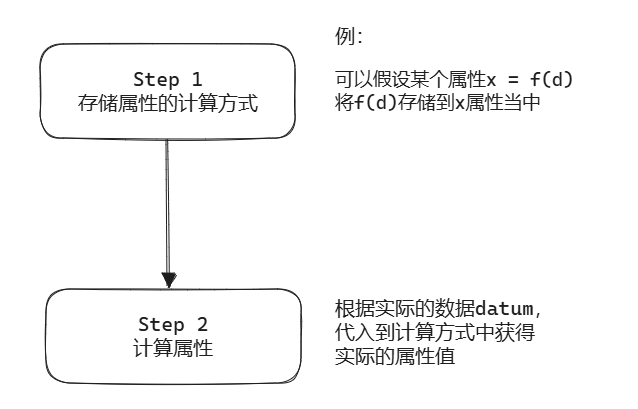 +
+
+
+#### Step1 Store Style
+
+##### 1. Initialize Style
+
+Initialize the default style of the graphic element, call the `setStyle` method to set the default value for the `normal` state:
+
+```xml
+private ***_initStyle***(): void {
+ const defaultStyle = this.***_getDefaultStyle***();
+ this.***setStyle***(defaultStyle, *'normal'*, 0);
+}
+
+```
+* Default styles include `visible`: true, `x`: 0, `y`: 0, etc.
+
+* These default values ensure that the elements render correctly even without user-defined styles.
+
+The `initStyleWithSpec` method initializes styles based on the user-provided `spec`:
+
+```Typescript
+initStyleWithSpec(spec: IMarkSpec
+
+
+
+#### Step1 Store Style
+
+##### 1. Initialize Style
+
+Initialize the default style of the graphic element, call the `setStyle` method to set the default value for the `normal` state:
+
+```xml
+private ***_initStyle***(): void {
+ const defaultStyle = this.***_getDefaultStyle***();
+ this.***setStyle***(defaultStyle, *'normal'*, 0);
+}
+
+```
+* Default styles include `visible`: true, `x`: 0, `y`: 0, etc.
+
+* These default values ensure that the elements render correctly even without user-defined styles.
+
+The `initStyleWithSpec` method initializes styles based on the user-provided `spec`:
+
+```Typescript
+initStyleWithSpec(spec: IMarkSpec, key?: string) {
+ if (!spec) return;
+
+ if (isValid(spec.id)) this._userId = spec.id;
+ if (isBoolean(spec.interactive)) this._markConfig.interactive = spec.interactive;
+ if (isValid(spec.zIndex)) this._markConfig.zIndex = spec.zIndex;
+ if (isBoolean(spec.visible)) this.setVisible(spec.visible);
+
+ this._initSpecStyle(spec, this.stateStyle, key);
+}
+
+```
+* Parse user-defined attributes such as `interactive`, `zIndex`, `visible`, etc.
+
+* Call the `_initSpecStyle` method to handle `style` and `state`. This part mainly involves calling `setStyle` to set the corresponding style for each state (including the initial `normal` state) and storing the state information in the state manager. We explain the state in detail.
+
+
+
+The above methods all call the core function `setStyle`, which is used to set styles for specified states:
+
+
+```Typescript
+ ***setStyle***(
+ style: Partial>, // 样式
+ state: StateValueType = *'normal'*, // 状态
+ level: number = 0, // 状态层级 当处于不同状态产生冲突时 根据层级设置样式
+ stateStyle = this.stateStyle // 存储状态样式
+ ): void {
+ if (***isNil***(style)) {
+ return;
+ }
+ if (stateStyle[state] === undefined) {
+ stateStyle[state] = {};
+ }
+ const isUserLevel = this.***isUserLevel***(level);
+ Object.***keys***(style).***forEach***((attr: string) => {
+ let attrStyle = style[attr] as MarkInputStyle;
+ if (***isNil***(attrStyle)) {
+ return;
+ }
+ // 过滤和转化样式
+ attrStyle = this.***_filterAttribute***(attr as any, attrStyle, state, level, isUserLevel, stateStyle);
+ // 设置样式
+ this.***setAttribute***(attr as any, attrStyle, state, level, stateStyle);
+ /* 在setAttribute中设置属性计算方式/样式
+ stateStyle[state][attr] = {
+ level,
+ style,
+ referer: undefined
+ };
+ */
+ });
+ }
+
+```
+
+
+##### 2. Filter and Transform Styles
+
+The `_filterAttribute` called in `setStyle` is used to filter and transform individual style attributes, ensuring that the style attributes conform to internal usage standards. These transformations are relatively simple, as noted in the comments.
+
+
+```Typescript
+ protected ***_filterAttribute***(
+ attr: U,
+ style: MarkInputStyle,
+ state: StateValueType,
+ level: number,
+ isUserLevel: boolean,
+ stateStyle = this.stateStyle
+ ): StyleConvert {
+ // *** **将visual spec转换为 scale 类型的 mark style** ***
+ // 用于后续计算属性值
+ let newStyle = this.***_styleConvert***(style);
+
+ if (isUserLevel) {
+ switch (attr) {
+ case *'angle'*:
+ // 角度值转弧度值
+ newStyle = this.***convertAngleToRadian***(newStyle);
+ break;
+ case *'innerPadding'*:
+ case *'outerPadding'*:
+ // VRender 的 padding 定义基于 centent-box 盒模型,默认正方向是向外扩,与 VChart 不一致。这里将 padding 符号取反
+ newStyle = this.***_transformStyleValue***(newStyle, (value: number) => -value);
+ break;
+ case *'curveType'*:
+ // 根据direction返回'*monotoneY*'(*Direction.horizontal*)或'*monotoneX*'
+ newStyle = this.***_transformStyleValue***(newStyle, (value: string) =>
+ ***curveTypeTransform***(value, (this._option.model as any).direction)
+ );
+ break;
+ }
+ }
+ return newStyle;
+ }
+
+```
+It is particularly important to note that in `styleConvert`, some styles that need to be converted to `scale` type are transformed for subsequent attribute value calculations. For example, convert `yField: 'score'` to:
+
+```xml
+{
+ scale, // 映射对象,用于数据到视觉通道的映射,可以理解为一个函数,输入数据对应的值,输出视觉通道的值
+ field: 'score', // 数据字段名,表示映射的输入字段。
+ changeDomain: true // 布尔值,表示是否允许动态更新比例尺的定义域(domain)
+};
+
+```
+This is a `scale` type style, where the first field `scale` calculates the value of the data corresponding field `datum['score']` as the `y` coordinate of the graphic element.
+
+
+
+#### Step2 Calculate Attribute Values
+
+`BaseMark` provides an interface `getAttribute` for its users to calculate and obtain attribute values based on actual data.
+
+```xml
+ ***getAttribute***(key: U, datum: Datum, state: StateValueType = *'normal'*, opt?: IAttributeOpt) {
+ return this.***_computeAttribute***(key, state)(datum, opt);
+ }
+
+```
+Here, the `compteAttribute(key, state)` returns a function for calculating an attribute, where `key` is the attribute name and `state` is the current state; `(datum, opt)` is used as the parameter for this function, returning the calculation result, consistent with our above description of **“the method of storing attribute calculations”**.
+
+```Typescript
+ protected ***_computeAttribute***(key: U, state: StateValueType) {
+ let stateStyle = this.stateStyle[state]?.[key];
+ if (!stateStyle) {
+ stateStyle = this.stateStyle.normal[key];
+ }
+ const baseValueFunctor = this.***_computeStateAttribute***(stateStyle, key, state);
+ const hasPostProcess = ***isFunction***(stateStyle?.***postProcess***);
+ const hasExCompute = key in this._computeExChannel;
+ // ...
+ // 叠加后处理函数和额外计算函数
+ // ...
+ return baseValueFunctor;
+ }
+
+```
+Continuing to delve into `computeStateAttribute`, you will find that an attribute calculation function is constructed here. The input of this function is `(datum, opt)`, and the output is the calculated attribute value. If the attribute value is a constant (unrelated to the data, fixed on `spec`), then this constructed function directly returns `style`; what really needs to be calculated are some complex styles and mappings from data to visuals~~(recycling theme)~~.
+
+```Typescript
+ protected ***_computeStateAttribute***(stateStyle: any, key: U, state: StateValueType) {
+ if (!stateStyle) { // 处理空样式
+ return (datum: Datum, opt: IAttributeOpt) => undefined as any;
+ }
+ if (stateStyle.referer) { // 处理引用样式
+ return stateStyle.referer.***_computeAttribute***(key, state);
+ }
+ if (!stateStyle.style) { // 处理空样式
+ return (datum: Datum, opt: IAttributeOpt) => stateStyle.style;
+ }
+ // =====================================================================
+ // **处理函数样式**:如果 stateStyle.style 是函数,调用该函数计算属性值。
+ if (typeof stateStyle.style === *'function'*) {
+ return (datum: Datum, opt: IAttributeOpt) =>
+ stateStyle.***style***(datum, this._attributeContext, opt, this.***getDataView***());
+ }
+ // **渐变色处理**,支持各个属性回调
+ if (GradientType.***includes***(stateStyle.style.gradient)) {
+ return this.***_computeGradientAttr***(stateStyle.style);
+ }
+ // **内外描边处理**,支持各个属性回调
+ if ([*'outerBorder'*, *'innerBorder'*].***includes***(key as string)) {
+ return this.***_computeBorderAttr***(stateStyle.style);
+ }
+ // **处理映射样式**:如果 stateStyle.style 包含映射关系(scale),根据数据字段映射值。
+ if (***isValidScaleType***(stateStyle.style.scale?.type)) {
+ return (datum: Datum, opt: IAttributeOpt) => {
+ let data = datum;
+ if (this.model.modelType === *'series'* && (this.model as ISeries).***getMarkData***) {
+ data = (this.model as ISeries).***getMarkData***(datum);
+ }
+ return stateStyle.style.scale.***scale***(data[stateStyle.style.field]);
+ };
+ }
+ // =====================================================================
+ // **处理常量样式**:如果 stateStyle.style 是常量值,直接返回该值。
+ return (datum: Datum, opt: IAttributeOpt) => {
+ return stateStyle.style;
+ };
+ }
+
+```
+Emphasize the `scale` style, which includes the data-to-visual mapping part. Continuing with the above example, we have already constructed a `scale` style:
+
+```xml
+style: {
+ scale,
+ field: 'score',
+ changeDomain: true,
+}
+
+```
+If we need to calculate the `y` coordinate of the graphic element, first obtain the data bound to the graphic element (see Chapter 5 VChart Data Processing), and then use the `scale` mapping object to input `data['score']` to get the corresponding `y` value. For more information about `scale`, see Chapter 7 VChart Scale.
+
+
+
+# This document was revised and organized by the following personnel
+[玄魂](https://github.com/xuanhun)
\ No newline at end of file
diff --git a/docs/assets/contributing/en/sourcecode/6.3-primitive-interaction-and-state-handling.md b/docs/assets/contributing/en/sourcecode/6.3-primitive-interaction-and-state-handling.md
new file mode 100644
index 0000000000..5b83bd8f2e
--- /dev/null
+++ b/docs/assets/contributing/en/sourcecode/6.3-primitive-interaction-and-state-handling.md
@@ -0,0 +1,383 @@
+---
+title: 6.3 Interaction and State Management of Primitives
+
+key words: VisActor,VChart,VTable,VStrory,VMind,VGrammar,VRender,Visualization,Chart,Data,Table,Graph,Gis,LLM
+---
+# Introduction
+
+VChart instances provide methods related to event listening, allowing you to meet business needs and interact with charts by listening to events. For all events supported by VChart, refer to the documentation [event api](https://www.visactor.io/vchart/api/API/event). You can listen to a specific event on a primitive in the following two ways:
+
+* Use `markName` for filtering, such as:
+
+
+```xml
+// 监听 bar 图元 上的 pointerdown 事件
+vchart.on('pointerdown', { markName: 'bar' }, (e: EventParams) => {
+ console.log('bar pointerdown', e);
+});
+
+```
+* Use the "level-type" rule with `{ level: 'mark', type: 'bar' }` for filtering, such as:
+
+```xml
+// 监听 bar 图元 上的 pointerdown 事件
+vchart.on('pointerdown', { level: 'mark', type: 'bar' }, (e: EventParams) => {
+ console.log('bar pointerdown', e);
+});
+
+```
+
+
+# States of Primitives
+
+In VChart, primitives can be in several states, and different states can display different styles. The built-in states are:
+
+* `default` default state;
+
+* `hover` / `hover_reverse` When the mouse hovers over a primitive, it enters the `hover` state, and other primitives enter the `hover_reverse` state;
+
+* `selected` / `selected_reverse` When the mouse clicks on a primitive, it enters the `selected` state, and other primitives enter the `selected_reverse` state;
+
+* `dimension_hover` / `dimension_hover_reverse` Dimension hover state, when the mouse pointer hovers over a certain section of the `x` axis area, the primitives in the area enter the `dimension_hover` state, and other primitives enter the `dimension_hover_reverse` state.
+
+##### State Definition
+
+The state types are defined in `packages/vchart/src/compile/mark/interface.ts` for convenient use later:
+
+```xml
+export enum STATE_VALUE_ENUM {
+ STATE_NORMAL = *'normal'*,
+ STATE_HOVER = *'hover'*,
+ STATE_HOVER_REVERSE = *'hover_reverse'*,
+ STATE_DIMENSION_HOVER = *'dimension_hover'*,
+ STATE_DIMENSION_HOVER_REVERSE = *'dimension_hover_reverse'*,
+ STATE_SELECTED = *'selected'*,
+ STATE_SELECTED_REVERSE = *'selected_reverse'*,
+}
+export enum STATE_VALUE_ENUM_REVERSE {
+ STATE_HOVER_REVERSE = *'hover_reverse'*,
+ STATE_DIMENSION_HOVER_REVERSE = *'dimension_hover_reverse'*,
+ STATE_SELECTED_REVERSE = *'selected_reverse'*
+}
+export type STATE_NORMAL = typeof STATE_VALUE_ENUM.STATE_NORMAL;
+export type STATE_HOVER = typeof STATE_VALUE_ENUM.STATE_HOVER;
+export type STATE_HOVER_REVERSE = typeof STATE_VALUE_ENUM.STATE_HOVER_REVERSE;
+export type STATE_CUSTOM = string;
+export type StateValueNot = STATE_HOVER_REVERSE | STATE_CUSTOM;
+export type StateValue = STATE_NORMAL | STATE_HOVER | STATE_CUSTOM;
+export type StateValueType = StateValue | StateValueNot;
+
+```
+Notice that there is also a `STATE_CUSTOM` state, which is a user-defined state. We will introduce the usage of custom states later.
+
+##### State Style Storage
+
+In order for the graphic elements to display different styles in different states, the structure for storing different state styles is defined in the graphic element interface IMarkRaw:
+
+```Typescript
+export type IMarkStateStyle = Record>>;
+
+export interface IMarkRaw extends ICompilableMark {
+ readonly stateStyle: IMarkStateStyle; // 存储状态样式
+ ...
+
+```
+These styles are defined by the user in `spec` and stored in `stateStyle` after parsing.
+
+
+
+# Interaction and State Switching of Primitives
+
+The states and corresponding styles of the primitives have been defined. So, how can we switch the state of the primitives through event interaction and display different styles? The general process is as follows:
+
+
+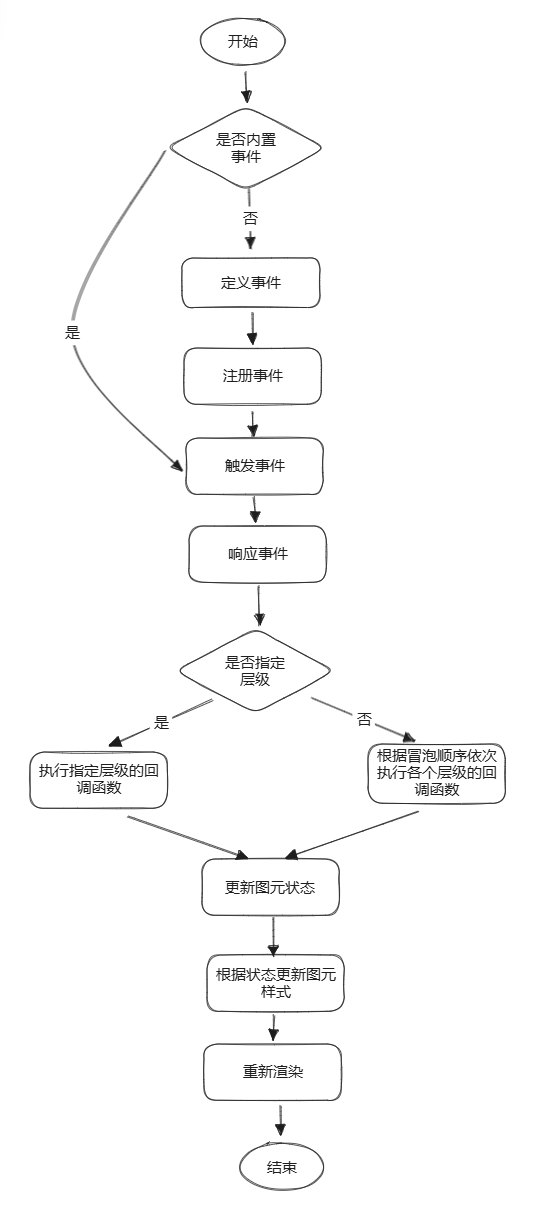 +
+
+
+##### Register Event
+
+The entry point for interactive events is the `on` method of the `Event` class,
+
+```xml
+***on***
+
+
+
+##### Register Event
+
+The entry point for interactive events is the `on` method of the `Event` class,
+
+```xml
+***on***(
+ eType: Evt,
+ query: EventQuery | EventCallback,
+ ***callback***?: EventCallback
+ )
+
+```
+* `eventType` is the type of event, such as `pointerdown`, `dimensionHover`, etc.
+
+* `query` is the event filter, such as element name, event level, component type, etc.
+
+* `callback` is the callback function triggered by the event.
+
+This will call the core function `register` of `EventDispatcher`:
+
+```xml
+ // vchart/src/event/event-dispatcher.ts
+ ***register***(eType: Evt, handler: EventHandler): this {
+ // 解析 query 配置并生成最终 handler 内容
+ this.***_parseQuery***(handler);
+
+ // 获取相应的bubble对象
+ const bubbles = this.***getEventBubble***(handler.filter?.source || Event_Source_Type.chart);
+ const listeners = this.***getEventListeners***(handler.filter?.source || Event_Source_Type.chart);
+ if (!bubbles.***get***(eType)) {
+ bubbles.***set***(eType, new ***Bubble***());
+ }
+
+ // 挂载事件监听
+ const bubble = bubbles.***get***(eType) as Bubble;
+ bubble.***addHandler***(handler, handler.filter?.level as EventBubbleLevel);
+ if (this.***_isValidEvent***(eType) && !listeners.***has***(eType)) {
+ const ***callback*** = this.***_onDelegate***.***bind***(this);
+ this._compiler.***addEventListener***(handler.filter?.source as EventSourceType, eType, ***callback***);
+ listeners.***set***(eType, ***callback***);
+ } else if (this.***_isInteractionEvent***(eType) && !listeners.***has***(eType)) {
+ const ***callback*** = this.***_onDelegateInteractionEvent***.***bind***(this);
+ this._compiler.***addEventListener***(handler.filter?.source as EventSourceType, eType, ***callback***);
+ listeners.***set***(eType, ***callback***);
+ }
+ return this;
+ }
+
+```
+* Parse the event configuration (`query`) passed by the user and generate the final event filter (`filter`).
+
+* Retrieve the corresponding event `Bubble` object from the internally maintained Map (such as `_viewBubbles`) based on the source (`chart`, `window`, or `canvas`) in the filter; if not present, create a new one.
+
+* Add the event handler (`handler`) to the Bubble; if there is no listener for this event type in the corresponding scenario, register a callback for the underlying syntax layer through the compiler (`this._compiler.addEventListener`).
+
+;
+ level: EventBubbleLevel;
+};
+
+export class Bubble {
+ private _map: Map, BubbleNode> = new ***Map***();
+ private _levelNodes: Map = new ***Map***();
+
+ constructor() {
+ this._levelNodes.***set***(Event_Bubble_Level.vchart, []);
+ this._levelNodes.***set***(Event_Bubble_Level.chart, []);
+ this._levelNodes.***set***(Event_Bubble_Level.model, []);
+ this._levelNodes.***set***(Event_Bubble_Level.mark, []);
+ }
+ ...... // 管理 Map 的增删改方法
+}
+
+```
+
+
+##### Response Event
+
+When an interaction event is triggered, another core function `dispatch` of `EventDispatcher` will be called:
+
+```Typescript
+ // vchart/src/event/event-dispatcher.ts
+ ***dispatch***(eType: Evt, params: EventParamsDefinition[Evt], level?: EventBubbleLevel): this {
+ // 默认事件类别为 view
+ const bubble = this.***getEventBubble***((params as BaseEventParams).source || Event_Source_Type.chart).***get***(
+ eType
+ ) as Bubble;
+ // 没有任何监听事件时,bubble 不存在
+ if (!bubble) {
+ return this;
+ }
+
+ // 事件冒泡逻辑:Mark -> Model -> Chart -> VChart
+ let stopBubble: boolean = false;
+
+ if (level) {
+ // 如果指定了 level,则直接处理,不进行冒泡
+ const handlers = bubble.***getHandlers***(level);
+ stopBubble = this.***_invoke***(handlers, eType, params);
+ } else {
+ const levels = [
+ Event_Bubble_Level.mark,
+ Event_Bubble_Level.model,
+ Event_Bubble_Level.chart,
+ Event_Bubble_Level.vchart
+ ];
+ let i = 0;
+
+ // Mark 级别的事件只包含对语法层代理的基础事件
+ while (!stopBubble && i < levels.length) {
+ stopBubble = this.***_invoke***(bubble.***getHandlers***(levels[i]), eType, params);
+ i++;
+ }
+ }
+
+ return this;
+ }
+
+```
+* Retrieve the corresponding `Bubble Map` based on the event source (source: view, window, canvas), and then extract the `Bubble` corresponding to the event type from it.
+
+* If a `Bubble` is found, obtain the registered handlers (`handlers`) according to the bubbling hierarchy (`Mark`→ `Model`→ `Chart`→ `VChart`) and call the `_invoke` method to execute them.
+
+* The `_invoke` method checks for matches based on the event filter (`filter`), and if it passes, it calls the callback function; if the callback returns a truthy value, it indicates preventing subsequent bubbling processing.
+
+
+
+##### State Switching
+
+Switch the state of the graphic elements in the mounted callback function. By default, vchart mounts handlers for `hover`, `selected`, `dimensionHover`/`dimensionClick` events. The first two are implemented and proxied by the `VGrammar` syntax layer, while events related to `dimension` are implemented in `VChart`. Taking `hover` as an example, first define and register the `dimensionHover` event:
+
+```Typescript
+// packages/vchart/src/event/events/dimension/dimension-hover.ts
+export class DimensionHoverEvent extends DimensionEvent {
+ private _cacheDimensionInfo: IDimensionInfo[] | null = null;
+ ***register***(eType: Evt, handler: EventHandler) {
+ this.***_callback*** = handler.***callback***;
+ this._eventDispatcher.***register***<*'pointermove'*>(*'pointermove'*, {
+ query: { ...handler.query, source: Event_Source_Type.chart },
+ ***callback***: this.***onMouseMove***
+ });
+ ...
+ }
+ private ***onMouseMove*** = (params: BaseEventParams) => {
+ if (!params) {
+ return;
+ }
+ const x = (params.event as any).viewX;
+ const y = (params.event as any).viewY;
+ const targetDimensionInfo = this.***getTargetDimensionInfo***(x, y);
+ if (targetDimensionInfo === null && this._cacheDimensionInfo !== null) {
+ // 鼠标移出某维度
+ this.***_callback***.***call***(null, {
+ ...params,
+ action: *'leave'*,
+ dimensionInfo: this._cacheDimensionInfo.***slice***()
+ });
+ this._cacheDimensionInfo = targetDimensionInfo;
+ } else if (
+ targetDimensionInfo !== null &&
+ (this._cacheDimensionInfo === null ||
+ targetDimensionInfo.length !== this._cacheDimensionInfo.length ||
+ targetDimensionInfo.***some***((info, i) => !***isSameDimensionInfo***(info, this._cacheDimensionInfo![i])))
+ ) {
+ // 鼠标移入某维度
+ this.***_callback***.***call***(null, {
+ ...params,
+ action: *'enter'*,
+ dimensionInfo: targetDimensionInfo.***slice***()
+ });
+ this._cacheDimensionInfo = targetDimensionInfo;
+ } else if (targetDimensionInfo !== null) {
+ // 鼠标在某维度上滑动
+ this.***_callback***.***call***(null, {
+ ...params,
+ action: *'move'*,
+ dimensionInfo: targetDimensionInfo.***slice***()
+ });
+ }
+ };
+
+ private ***onMouseOut*** = (params: BaseEventParams) => {
+ ...
+ }
+}
+
+```
+In `onMouseMove` is a callback function, which is the entry point for subsequent changes to the element state, where `_callback` is as follows:
+
+```Typescript
+ // packages/vchart/src/interaction/dimension-trigger.ts
+ private ***onHover*** = (params: DimensionEventParams) => {
+ switch (params.action) {
+ case *'enter'*:
+ // 清理之前的hover元素
+ const lastHover = this.interaction.***getEventElement***(STATE_VALUE_ENUM.STATE_DIMENSION_HOVER);
+ lastHover.***forEach***(e => this.interaction.***addEventElement***(STATE_VALUE_ENUM.STATE_DIMENSION_HOVER_REVERSE, e));
+ this.interaction.***clearEventElement***(STATE_VALUE_ENUM.STATE_DIMENSION_HOVER, false);
+ // 添加新的hover元素
+ const elements = this.***getEventElement***(params);
+ elements.***forEach***(el => this.interaction.***addEventElement***(STATE_VALUE_ENUM.STATE_DIMENSION_HOVER, el));
+ this.interaction.***reverseEventElement***(STATE_VALUE_ENUM.STATE_DIMENSION_HOVER);
+ break;
+ case *'leave'*:
+ // 清空所有元素
+ this.interaction.***clearEventElement***(STATE_VALUE_ENUM.STATE_DIMENSION_HOVER, true);
+ params = null;
+ break;
+ case *'click'*:
+ case *'move'*:
+ default:
+ break;
+ }
+ };
+
+```
+In simple terms, it involves adding or removing elements under corresponding events, and the specific change in element state is managed and implemented through the `Interaction` class. For example, in `addEventElement`, a new graphic element is added to the specified state and the element is marked for that state.
+
+
+```xml
+ ***addEventElement***(stateValue: StateValue, element: IElement) {
+ if (this._disableTriggerEvent) {
+ return;
+ }
+ if (!element.***getStates***().***includes***(stateValue)) {
+ element.***addState***(stateValue); // 改变元素内部图元样式
+ }
+ const list = this._stateElements.***get***(stateValue) ?? [];
+ list.***push***(element);
+ this._stateElements.***set***(stateValue, list);
+ }
+
+```
+Finally, the element changes the style of the internal graphic elements according to the state through the `addState` function, which calls the interface of the syntax layer `VGrammar`.
+
+
+
+# Custom State and Interaction Example
+
+As mentioned above, we can customize some states of the graphic elements, and `VChart` provides the `updateState` interface to update states, which allows us to achieve more requirements based on this. For example, we want to highlight the neighboring points in another style when `hovering` over a point.
+
+First, define a new state `as_neighbor` for the points in the `spec` and specify its style:
+
+```xml
+point: {
+ ...
+ state: {
+ as_neighbor: {
+ scaleX: 2,
+ scaleY: 2,
+ fill:"red",
+ fillOpacity: 0.5
+ }
+ }
+ ...
+ }
+
+```
+After that, register the event, when `hover` over a point, use `updateState` to set the state of its neighboring points to `as_neighbor`:
+
+```xml
+vchart.***on***(*'pointerover'*, { id: *'point-series'* }, e => {
+ // 找到邻居点
+ const selectedNeighbors: number[] = findNeighbors();
+ // 更新邻居点的状态 使用filter
+ vchart.***updateState***({
+ as_neighbor: {
+ ***filter***: datum => {
+ return selectedNeighbors.***includes***(datum.id);
+ }
+ }
+ });
+});
+
+```
+In this way, the state of the neighboring point is set to `as_neighbor`, and through the above process, the specified style is finally displayed (enlarged to 2 times, 0.5 transparency, and turned red):
+
+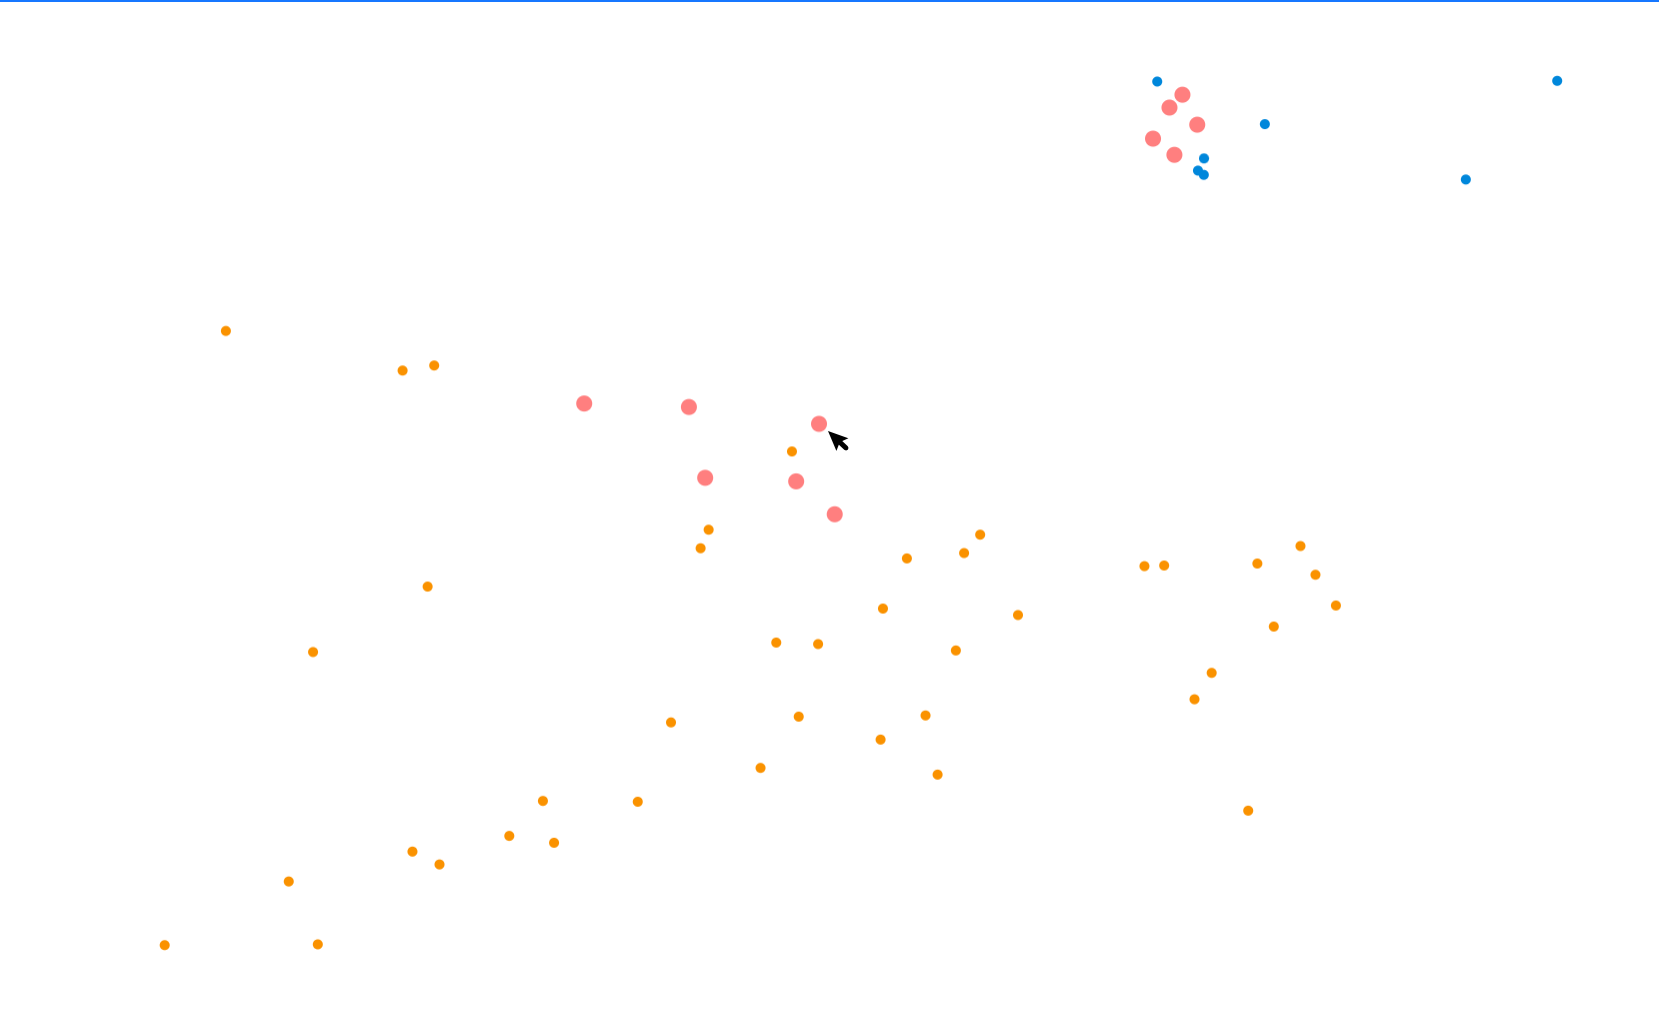 +
+
+
+ # This document was revised and organized by the following person
+ [玄魂](https://github.com/xuanhun)
\ No newline at end of file
diff --git a/docs/assets/contributing/en/sourcecode/6.4-custom-primitives.md b/docs/assets/contributing/en/sourcecode/6.4-custom-primitives.md
new file mode 100644
index 0000000000..ec09e5c01b
--- /dev/null
+++ b/docs/assets/contributing/en/sourcecode/6.4-custom-primitives.md
@@ -0,0 +1,487 @@
+---
+title: 6.4 Custom Marks
+
+key words: VisActor,VChart,VTable,VStrory,VMind,VGrammar,VRender,Visualization,Chart,Data,Table,Graph,Gis,LLM
+---
+# Introduction
+
+When we have a large amount of data to display on a chart, we usually need to define a specific type of series (see section 3.2: `series`) and create marks within the series to represent the data. However, if we only need to display a little extra information, such as an image, a title, or a path, and do not want to create a separate series for it, we can use custom marks (`customMark`). Custom marks allow users to add custom annotations to the chart, such as adding some text, images, line segments, etc.
+
+# Types and Examples
+
+Currently, the supported types of custom marks are as follows:
+
+* `symbol`: Point graphic
+
+* `rule`: Line segment
+
+* `text`: Text
+
+* `rect`: Rectangle
+
+* `path`: Path
+
+* `arc`: Sector
+
+* `polygon`: Polygon
+
+* `group`: Group, which can contain other marks
+
+In the following example, in addition to the two data points in the chart (which can be considered a `scatter series`), three custom marks are added above, namely `text`, `symbol`, and `rule`.
+
+
+
+
+
+ # This document was revised and organized by the following person
+ [玄魂](https://github.com/xuanhun)
\ No newline at end of file
diff --git a/docs/assets/contributing/en/sourcecode/6.4-custom-primitives.md b/docs/assets/contributing/en/sourcecode/6.4-custom-primitives.md
new file mode 100644
index 0000000000..ec09e5c01b
--- /dev/null
+++ b/docs/assets/contributing/en/sourcecode/6.4-custom-primitives.md
@@ -0,0 +1,487 @@
+---
+title: 6.4 Custom Marks
+
+key words: VisActor,VChart,VTable,VStrory,VMind,VGrammar,VRender,Visualization,Chart,Data,Table,Graph,Gis,LLM
+---
+# Introduction
+
+When we have a large amount of data to display on a chart, we usually need to define a specific type of series (see section 3.2: `series`) and create marks within the series to represent the data. However, if we only need to display a little extra information, such as an image, a title, or a path, and do not want to create a separate series for it, we can use custom marks (`customMark`). Custom marks allow users to add custom annotations to the chart, such as adding some text, images, line segments, etc.
+
+# Types and Examples
+
+Currently, the supported types of custom marks are as follows:
+
+* `symbol`: Point graphic
+
+* `rule`: Line segment
+
+* `text`: Text
+
+* `rect`: Rectangle
+
+* `path`: Path
+
+* `arc`: Sector
+
+* `polygon`: Polygon
+
+* `group`: Group, which can contain other marks
+
+In the following example, in addition to the two data points in the chart (which can be considered a `scatter series`), three custom marks are added above, namely `text`, `symbol`, and `rule`.
+
+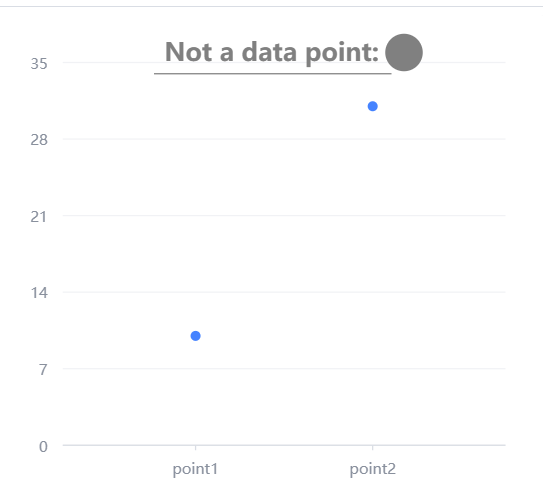 +
+# 代码实现
+
+自定义图元的代码入口:`packages/vchart/src/component/custom-mark`
+
+1. 自定义图元的创建和管理
+
+* 通过 `initMarks `方法,根据用户提供的配置`spec`创建自定义图元。
+
+* 支持嵌套的图元结构(如`group`类型的图元可以包含子图元)。
+
+```Typescript
+ protected ***initMarks***() {
+ if (!this._spec) {
+ return;
+ }
+ const series = this._option && this._option.***getAllSeries***();
+ const hasAnimation = this._option.animation !== false;
+ const depend: IMark[] = [];
+
+ if (series && series.length) {
+ series.***forEach***(s => {
+ const marks = s && s.***getMarksWithoutRoot***();
+
+ if (marks && marks.length) {
+ marks.***forEach***(mark => {
+ depend.***push***(mark);
+ });
+ }
+ });
+ }
+ // Set the parent mark of the group mark
+ let parentMark: IGroupMark | null = null;
+ if (this._spec.parent) {
+ const mark = this.***getChart***()
+ .***getAllMarks***()
+ .***find***(m => m.***getUserId***() === this._spec.parent) as IGroupMark;
+ if (mark.type === *'group'*) {
+ parentMark = mark;
+ }
+ }
+ // Entry point for recursive calls, recursively create each mark
+ this.***_createExtensionMark***(this._spec, parentMark, *`${PREFIX}_series_${this.id}_extensionMark`*, 0, {
+ depend,
+ hasAnimation
+ });
+ }
+
+```
+1. 图元的样式和数据绑定
+
+* 使用 `_createExtensionMark `方法为每个图元设置样式、动画配置和数据绑定。
+
+* 支持通过 `dataId`或 `dataIndex`绑定数据视图(`DataView`)。
+
+```Typescript
+ private ***_createExtensionMark***(
+ spec: ICustomMarkSpec
+
+# 代码实现
+
+自定义图元的代码入口:`packages/vchart/src/component/custom-mark`
+
+1. 自定义图元的创建和管理
+
+* 通过 `initMarks `方法,根据用户提供的配置`spec`创建自定义图元。
+
+* 支持嵌套的图元结构(如`group`类型的图元可以包含子图元)。
+
+```Typescript
+ protected ***initMarks***() {
+ if (!this._spec) {
+ return;
+ }
+ const series = this._option && this._option.***getAllSeries***();
+ const hasAnimation = this._option.animation !== false;
+ const depend: IMark[] = [];
+
+ if (series && series.length) {
+ series.***forEach***(s => {
+ const marks = s && s.***getMarksWithoutRoot***();
+
+ if (marks && marks.length) {
+ marks.***forEach***(mark => {
+ depend.***push***(mark);
+ });
+ }
+ });
+ }
+ // Set the parent mark of the group mark
+ let parentMark: IGroupMark | null = null;
+ if (this._spec.parent) {
+ const mark = this.***getChart***()
+ .***getAllMarks***()
+ .***find***(m => m.***getUserId***() === this._spec.parent) as IGroupMark;
+ if (mark.type === *'group'*) {
+ parentMark = mark;
+ }
+ }
+ // Entry point for recursive calls, recursively create each mark
+ this.***_createExtensionMark***(this._spec, parentMark, *`${PREFIX}_series_${this.id}_extensionMark`*, 0, {
+ depend,
+ hasAnimation
+ });
+ }
+
+```
+1. 图元的样式和数据绑定
+
+* 使用 `_createExtensionMark `方法为每个图元设置样式、动画配置和数据绑定。
+
+* 支持通过 `dataId`或 `dataIndex`绑定数据视图(`DataView`)。
+
+```Typescript
+ private ***_createExtensionMark***(
+ spec: ICustomMarkSpec | ICustomMarkGroupSpec,
+ parentMark: null | IGroupMark,
+ namePrefix: string,
+ index: number = 0,
+ options: { hasAnimation?: boolean; depend?: IMark[] }
+ ) {
+ // Create the mark
+ const mark = this.***_createMark***(
+ {
+ type: spec.type,
+ name: ***isValid***(spec.name) ? *`${spec.name}`* : *`${namePrefix}_${index}`*
+ },
+ {
+ // Avoid double dataflow
+ skipBeforeLayouted: true,
+ attributeContext: this.***_getMarkAttributeContext***(),
+ componentType: spec.componentType,
+ key: spec.dataKey
+ }
+ ) as IGroupMark;
+ if (!mark) {
+ return;
+ }
+ if (***isValid***(spec.id)) {
+ mark.***setUserId***(spec.id);
+ }
+ // Handle animation
+ if (options.hasAnimation && spec.animation) {
+ const config = ***animationConfig***({}, ***userAnimationConfig***(spec.type, spec as any, this._markAttributeContext));
+ mark.***setAnimationConfig***(config);
+ }
+ // Build the hierarchical structure of group marks
+ if (options.depend && options.depend.length) {
+ mark.***setDepend***(...options.depend);
+ }
+ if (***isNil***(parentMark)) {
+ this._marks.***addMark***(mark);
+ } else if (parentMark) {
+ parentMark.***addMark***(mark);
+ }
+ // Set style
+ this.***initMarkStyleWithSpec***(mark, spec);
+ // Recursively handle group marks
+ if (spec.type === *'group'*) {
+ namePrefix = *`${namePrefix}_${index}`*;
+ spec.children?.***forEach***((s, i) => {
+ this.***_createExtensionMark***(s as any, mark, namePrefix, i, options);
+ });
+ }
+ // Handle data binding
+ if (***isValid***(spec.dataId) || ***isValidNumber***(spec.dataIndex)) {
+ const dataview = this.***getChart***().***getSeriesData***(spec.dataId, spec.dataIndex);
+ if (dataview) {
+ dataview.target.***addListener***(*'change'*, () => {
+ mark.***getData***().***updateData***();
+ });
+ mark.***setDataView***(dataview);
+ }
+ }
+ }
+
+```
+1. 图元的上下文管理
+
+* 提供 `getMarkAttributeContext`和 `_getMarkAttributeContext `方法,定义图元的上下文信息(如全局映射、布局边界等)。
+
+```xml
+ protected _markAttributeContext: IModelMarkAttributeContext;
+ ***getMarkAttributeContext***() {
+ return this._markAttributeContext;
+ }
+
+ private ***_getMarkAttributeContext***() {
+ return {
+ vchart: this._option.globalInstance,
+ chart: this.***getChart***(),
+ ***globalScale***: (key: string, value: string | number) => {
+ return this._option.globalScale.***getScale***(key)?.***scale***(value);
+ },
+ ***getLayoutBounds***: () => {
+ const { x, y } = this.***getLayoutStartPoint***();
+ const { width, height } = this.***getLayoutRect***();
+ return new ***Bounds***().***set***(x, y, x + width, y + height);
+ }
+ };
+ }
+
+```
+1. 布局和边界计算
+
+* 提供 `getBoundsInRect `和 `_getLayoutRect `方法,用于计算图元的布局边界和尺寸。
+
+```Typescript
+ ***getBoundsInRect***(rect: ILayoutRect) {
+ this.***setLayoutRect***(rect);
+
+ const result = this.***_getLayoutRect***();
+ const { x, y } = this.***getLayoutStartPoint***();
+ return {
+ x1: x,
+ y1: y,
+ x2: x + result.width,
+ y2: y + result.height
+ };
+ }
+
+ private ***_getLayoutRect***() {
+ const bounds = new ***Bounds***();
+
+ this.***getMarks***().***forEach***(mark => {
+ const product = mark.***getProduct***();
+
+ if (product) {
+ bounds.***union***(product.***getBounds***());
+ }
+ });
+
+ if (bounds.***empty***()) {
+ return {
+ width: 0,
+ height: 0
+ };
+ }
+
+ return {
+ width: bounds.***width***(),
+ height: bounds.***height***()
+ };
+ }
+
+```
+
+
+# Mark的比较
+
+### CustomMark 与 BaseMark 的区别
+
+##### 1. 定义的层次
+
+* `BaseMark`:
+
+* 是一个基础类,直接定义了图元(`Mark`)的行为和样式。
+
+* 主要用于处理单个图元的样式、状态、属性计算等逻辑。
+
+* 继承自 `CompilableMark`,提供`_computeAttribute `和 `_computeStateAttribute `方法,将高层配置转换为底层渲染指令。与底层渲染引擎(如 `VGrammar`)直接交互。
+
+* `CustomMark`:
+
+* 是一个组件类,负责管理多个图元的创建和行为。
+
+* 继承自 `BaseComponent`,用于定义更高层次的自定义图元逻辑。
+
+* 通过调用 `BaseMark`或其他图元类的方法,间接与底层渲染引擎交互。
+
+##### 2. 主要职责
+
+* `BaseMark`:
+
+* 负责单个图元的样式、状态和属性计算。
+
+* 提供方法如 `setStyle`、`getStyle`、`setAttribute `等,用于操作单个图元的样式和属性。
+
+* 直接处理图元的渐变色、边框、角度转换等细节。
+
+* `CustomMark`:
+
+* 负责管理多个图元的创建、样式设置和数据绑定。
+
+* 提供方法如 `initMarks`和 `_createExtensionMark`,用于根据配置动态创建图元。
+
+* 处理图元的上下文信息(如全局映射、布局边界)和与其他组件的依赖关系。
+
+##### 3. 数据绑定
+
+* `BaseMark`:
+
+* 通过 `setAttribute`和 `_computeAttribute`方法,直接绑定数据到单个图元的属性上。
+
+* 支持通过映射(`scale`)和字段(`field`)动态计算属性值。
+
+* `CustomMark`:
+
+* 通过 `_createExtensionMark`方法,为每个图元绑定数据视图(`DataView`)。
+
+* 支持通过 `dataId`或 `dataIndex`指定数据源。
+
+##### 4. 样式和动画
+
+* `BaseMark`:
+
+* 提供 `_initStyle`和 `_initSpecStyle`方法,用于初始化单个图元的样式。
+
+* 支持渐变色、边框、角度转换等样式的动态计算。
+
+* `CustomMark`:
+
+* 在 `_createExtensionMark`方法中,为每个图元设置样式和动画配置。
+
+* 默认**不**为自定义图元添加动画,但支持用户通过配置启用动画。
+
+
+
+### CustomMark 与 ExtensionMark 的区别
+
+##### 1. 从定义上看
+
+`CustomMark`配置项的接口如下:
+
+```Typescript
+export interface ICustomMarkSpec
+ extends IModelSpec,
+ IMarkSpec,
+ IAnimationSpec {
+ type: T;
+* // The name corresponding to the mark, mainly used for event filtering such as: { markName: 'yourName' }*
+ name?: string;
+* // Associated data index*
+ dataIndex?: number;
+* // dataKey is used to bind the relationship between data and Mark. If the data is consistent with the series data, it can be left unconfigured, and the configuration in the series will be read by default*
+ dataKey?: string | ((datum: any) => string);
+* // Associated data id*
+ dataId?: StringOrNumber;
+* // Specify component type*
+ componentType?: string;
+* // Whether to enable animation*
+ animation?: boolean;
+* // Specify parent Id*
+ parent?: string;
+}
+
+```
+`ExtensionMark`配置项的接口如下:
+
+```Typescript
+export interface IExtensionMarkSpec extends ICustomMarkSpec {
+* // 关联的数据索引*
+ dataIndex?: number;
+* // dataKey用于绑定数据与Mark的关系,如果数据和系列数据一致,可以不配置,默认会读取系列中的配置*
+ dataKey?: string | ((datum: any) => string);
+* // 关联的数据id*
+ dataId?: StringOrNumber;
+* // 指定组件类型*
+ componentType?: string;
+}
+
+```
+可以看出:
+
+* `ICustomMarkSpec`是一个通用的接口,用于定义自定义的 `Mark`(标记)。它继承了多个接口,包括 `IModelSpec`、`IMarkSpec`和 `IAnimationSpec`,并且支持所有的 `EnableMarkType`类型。
+
+> extends ICustomMarkSpec {...}
+
+```
+##### 2. 从使用上看
+
+* `extensionMark`是图表支持用户**在图表系列**上补充绘制任意内容的自定义接口。
+
+* `customMark`可以让用户**在图表上**添加自定义的标记,比如添加一些文本、图片、线段等。
+
+更具体的,当图表中包含多个`series`时,`extensionMark`的配置应当是放在`series`的配置当中的,属于对某个`series`的补充;而`customMark`是针对整个图表的,对图表信息的补充。二者所针对的对象和所在的层次不同。
+
+如下例,我们定义了两个`series`,并分别为它们添加了一个文本类型的`extensionMark`(紫色部分),这些`extensionMark`的配置是属于某个`series`配置中的;与此同时,我们在`series`配置之外,添加了一个文本类型的`customMark`(蓝色部分),它的配置是属于整个图标配置的。
+
+```xml
+const spec = {
+ type: 'common',
+ data: [
+ {
+ id: 'id0',
+ values: [
+ { x: 'Monday', type: 'Breakfast', y: 15 },
+ { x: 'Monday', type: 'Lunch', y: 25 },
+ { x: 'Tuesday', type: 'Breakfast', y: 12 },
+ { x: 'Tuesday', type: 'Lunch', y: 30 },
+ { x: 'Wednesday', type: 'Breakfast', y: 15 },
+ { x: 'Wednesday', type: 'Lunch', y: 24 }
+ ]
+ },
+ {
+ id: 'id1',
+ values: [
+ { x: 'Monday', type: 'Drink', y: 22 },
+ { x: 'Tuesday', type: 'Drink', y: 43 },
+ { x: 'Wednesday', type: 'Drink', y: 33 }
+ ]
+ }
+ ],
+ series: [
+ {
+ type: 'bar',
+ dataIndex: 0,
+ label: { visible: true },
+ seriesField: 'type',
+ xField: ['x', 'type'],
+ yField: 'y',
+ extensionMark:[{
+ type: 'text',
+ style: {
+ fontSize: 20,
+ fontWeight: 600,
+ text: "extension-mark of series1",
+ x: 450,
+ y: 200,
+ fill: 'blue',
+ }
+ }]
+ },
+ {
+ type: 'line',
+ dataIndex: 1,
+ label: { visible: true },
+ seriesField: 'type',
+ xField: 'x',
+ yField: 'y',
+ stack: false,
+ extensionMark:[{
+ type: 'text',
+ style: {
+ fontSize: 20,
+ fontWeight: 600,
+ text: "extension-mark of series2",
+ x: 300,
+ y: 25,
+ fill: 'orange',
+ }
+ }]
+ }
+ ],
+ customMark:[{
+ type: 'text',
+ style: {
+ fontSize: 20,
+ fontWeight: 600,
+ text: "custom-mark",
+ x: 800,
+ y: 200,
+ fill: 'grey',
+ }
+ }],
+ axes: [{ orient: 'left' }, { orient: 'bottom', label: { visible: true }, type: 'band' }],
+};
+
+const vchart = new VChart(spec, { dom: CONTAINER_ID });
+vchart.renderSync();
diff --git a/docs/assets/contributing/en/sourcecode/9.1-vchart-layout-basic-concepts.md b/docs/assets/contributing/en/sourcecode/9.1-vchart-layout-basic-concepts.md
new file mode 100644
index 0000000000..93cf5070b3
--- /dev/null
+++ b/docs/assets/contributing/en/sourcecode/9.1-vchart-layout-basic-concepts.md
@@ -0,0 +1,197 @@
+---
+title: 9.1 Basic Concepts of VChart Layout
+
+key words: VisActor,VChart,VTable,VStrory,VMind,VGrammar,VRender,Visualization,Chart,Data,Table,Graph,Gis,LLM
+---
+VChart, as a powerful chart library, also has strong layout capabilities, with built-in compact layout mode, grid layout, and support for custom layout capabilities.
+
+# Layout Elements
+
+In VChart, not all chart components participate in the layout, such as `tooltip` and `crosshairs`, which do not participate in the layout. Currently, the parts that participate in the layout in VChart are: `title`, `legend`, `axes`, `region`, `datazoom`, `scrollBar`.
+
+However, the layout logic in VChart is not implemented according to module types. VChart has a comprehensive extension mechanism, so there may be a variety of extended components, and these components may also need to participate in the layout. Therefore, the concept of layout elements was used in the design of layout capabilities.
+
+## Basic Concepts
+
+Layout elements are not equivalent to chart modules; they are independent abstract elements used by the layout system. The chart layout module only lays out the layout elements, ignoring what the actual components of the chart are.
+
+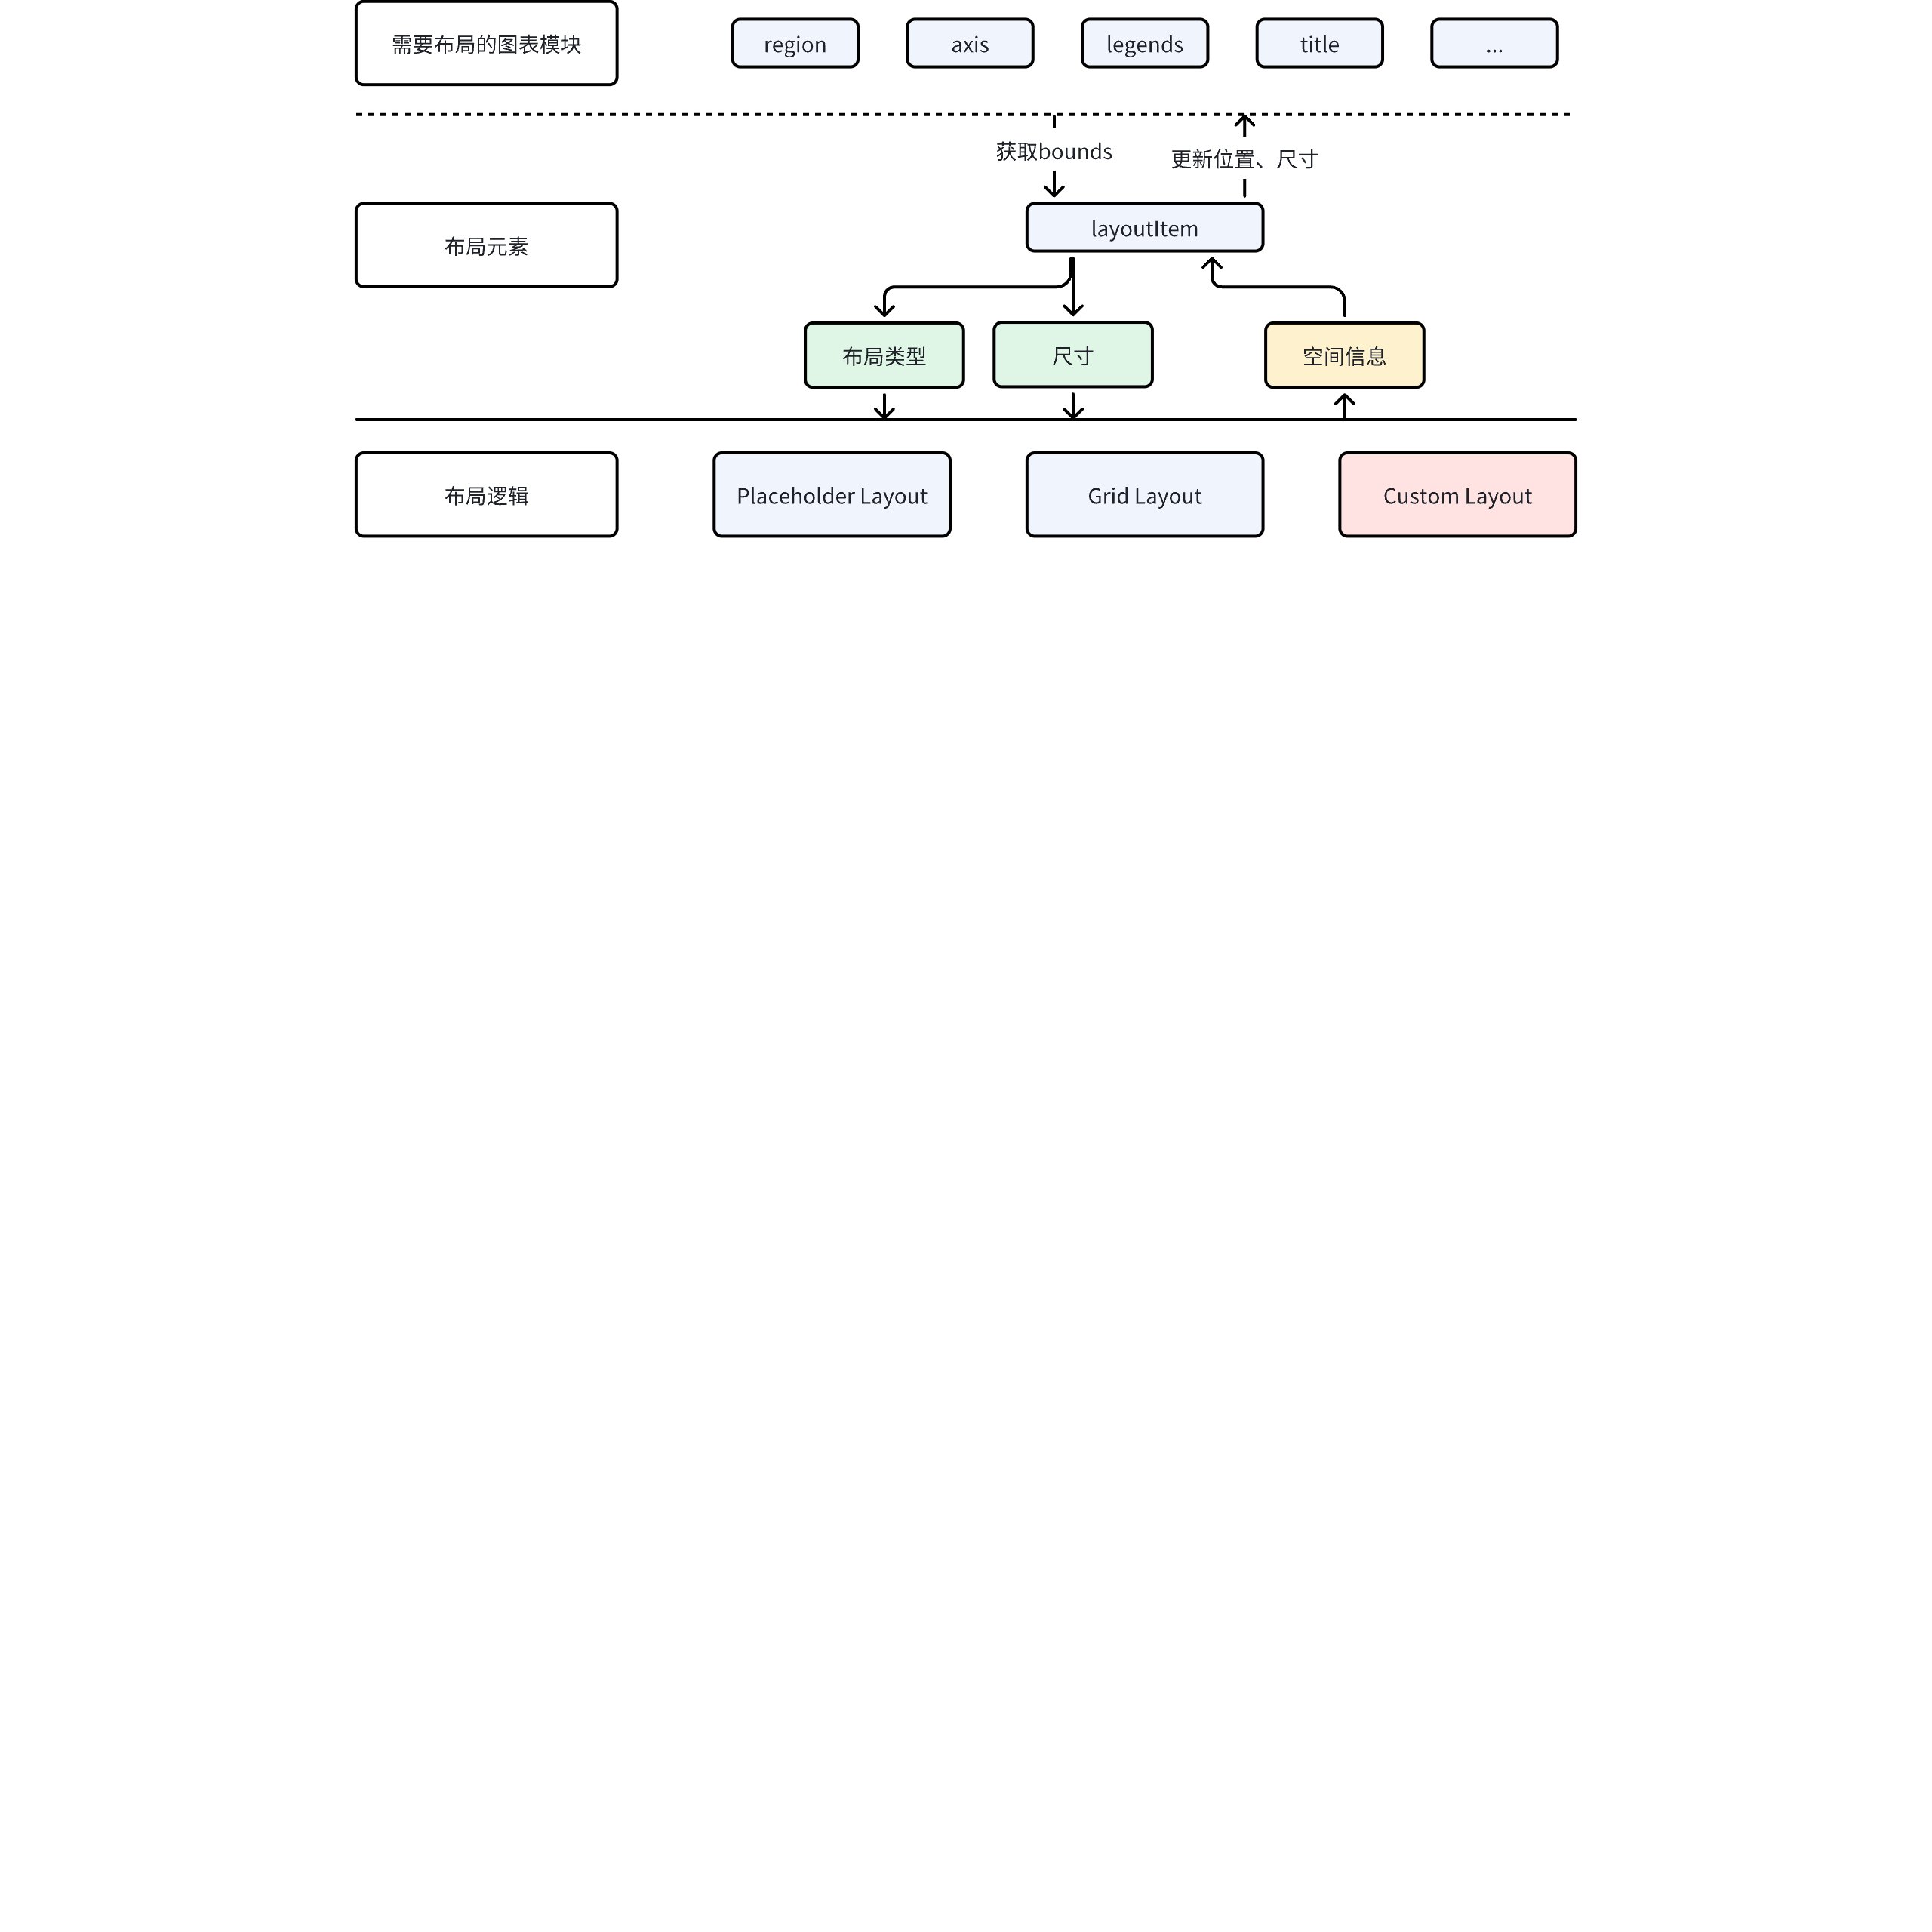 +
+The chart module participates in the layout by holding a layout element and communicating with the layout element.
+
+## Layout Element Attributes
+
+Layout elements have several important attributes:
+
+* Layout Type: Built-in placeholder layouts provide different layout logic to elements through the layout type.
+
+```Typescript
+
+export type ILayoutType =
+ | 'region-relative' // 轴,datazoom这样需要与region贴合,有布局关联的元素, 独立占位,不重合
+ | 'region-relative-overlap' // 与上面的布局逻辑一致,但是同位置的元素会重叠在一起
+ | 'region' // 一般只给region元素使用
+ | 'normal' // 普通布局元素,比如标题。
+ | 'absolute' // 想要多个元素在同一行布局,比如想并排布局多个图例
+ | 'normal-inline'; // 绝对定位元素,使用空间信息配置,基于画布左上角进行定位布局
+
+```
+* Spatial information: Supports attributes such as `x`, `y`, `lef`, `top`, `right`, `bottom`, `width`, `height`, etc. However, in different layout logics, only some attributes will take effect. For example, in grid layout, the elements within the cell `x`, `y` will not be affected by the configured `x`, `y`.
+
+
+
+# Layout Logic
+
+VChart has two built-in layout logics and supports custom layouts.
+
+## Placeholder Layout
+
+This is the most commonly used layout logic. As shown in the figure below.
+
+
+
+The chart module participates in the layout by holding a layout element and communicating with the layout element.
+
+## Layout Element Attributes
+
+Layout elements have several important attributes:
+
+* Layout Type: Built-in placeholder layouts provide different layout logic to elements through the layout type.
+
+```Typescript
+
+export type ILayoutType =
+ | 'region-relative' // 轴,datazoom这样需要与region贴合,有布局关联的元素, 独立占位,不重合
+ | 'region-relative-overlap' // 与上面的布局逻辑一致,但是同位置的元素会重叠在一起
+ | 'region' // 一般只给region元素使用
+ | 'normal' // 普通布局元素,比如标题。
+ | 'absolute' // 想要多个元素在同一行布局,比如想并排布局多个图例
+ | 'normal-inline'; // 绝对定位元素,使用空间信息配置,基于画布左上角进行定位布局
+
+```
+* Spatial information: Supports attributes such as `x`, `y`, `lef`, `top`, `right`, `bottom`, `width`, `height`, etc. However, in different layout logics, only some attributes will take effect. For example, in grid layout, the elements within the cell `x`, `y` will not be affected by the configured `x`, `y`.
+
+
+
+# Layout Logic
+
+VChart has two built-in layout logics and supports custom layouts.
+
+## Placeholder Layout
+
+This is the most commonly used layout logic. As shown in the figure below.
+
+ +
+By placing elements into canvas placeholders one by one, a compact layout is eventually formed.
+
+## Grid Layout
+
+Grid layout divides the canvas into a grid of `n rows by m columns` according to row and column information, and then places chart elements into the cells.
+
+For example, the following example on the official website is a grid layout of `2 columns, 4 rows`.
+
+
+
+
+By placing elements into canvas placeholders one by one, a compact layout is eventually formed.
+
+## Grid Layout
+
+Grid layout divides the canvas into a grid of `n rows by m columns` according to row and column information, and then places chart elements into the cells.
+
+For example, the following example on the official website is a grid layout of `2 columns, 4 rows`.
+
+
+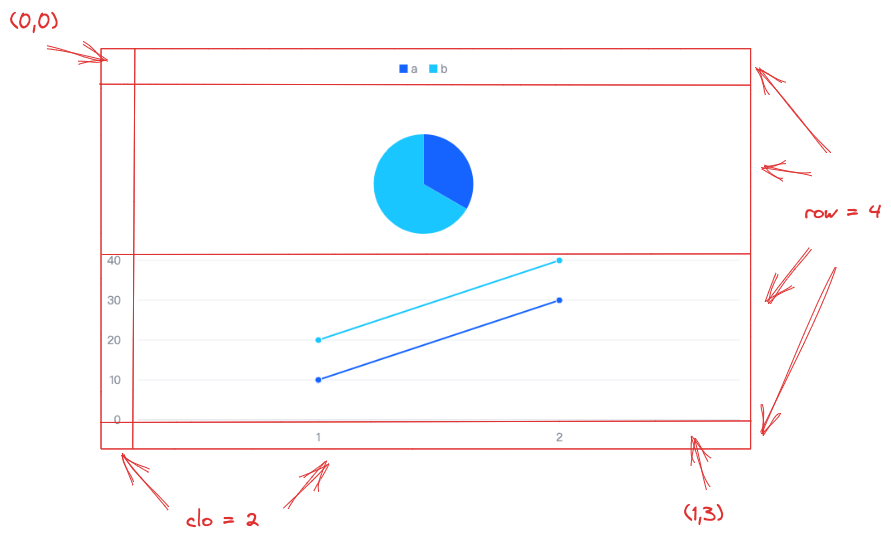 +
+Parameter Definition of Grid Layout
+
+```Typescript
+// 网格布局的类型定义
+export interface IGridLayoutSpec extends ILayoutSpecBase {
+ /**
+ * 设置布局类型为grid布局
+ */
+ type: 'grid';
+ /**
+ * grid布局的总列数
+ */
+ col: number;
+ /**
+ * grid布局的总行数
+ */
+ row: number;
+ /**
+ * 可选配置,指定某几列的宽度
+ */
+ colWidth?: {
+ /**
+ * 指定列数,序号从 0 开始
+ */
+ index: number;
+ /**
+ * 设置指定列的宽度,单位为像素
+ */
+ size: number | ((maxSize: number) => number);
+ }[];
+ /**
+ * 可选配置,指定某几行的高度
+ */
+ rowHeight?: {
+ /**
+ * 指定行数,序号从 0 开始
+ */
+ index: number;
+ /**
+ * 设置指定行的高度,单位为像素
+ */
+ size: number | ((maxSize: number) => number);
+ }[];
+ /**
+ *
+ * 指定所有图表元素所在位置,图表元素的位置起点和占几行几列,可以占多行多列
+ * 图表元素位置允许配置重叠。
+ */
+ elements: ElementSpec[];
+}
+
+网格单元格内模块位置设置
+export type ElementSpec = (
+ | {
+ /**
+ * 组件对应的spec key,如'legends'表示图例
+ */
+ modelKey: string;
+ /**
+ * 组件对应的序号
+ */
+ modelIndex: number;
+ }
+ | {
+ /**
+ * 组件对应的id
+ */
+ modelId: string;
+ }
+) & {
+ /**
+ * 组件在grid布局中所在的列。从左向右,从 0 开始计数
+ */
+ col: number;
+ /**
+ * 组件在grid布局中所在的列跨度,即占了几列,默认值为1
+ */
+ colSpan?: number;
+ /**
+ * 组件在grid布局中所在的行。从上向下,从 0 开始计数。
+ */
+ row: number;
+ /**
+ * 组件在grid布局中所在的行跨度,即占了几行,默认值为1
+ */
+ rowSpan?: number;
+};
+
+```
+## Custom Layout
+
+VChart also provides custom layout capabilities, allowing users to freely set spatial properties for all layout elements.
+
+For example, this [example](https://www.visactor.io/vchart/demo/layout/custom-layout) on the official website.
+
+
+
+
+Parameter Definition of Grid Layout
+
+```Typescript
+// 网格布局的类型定义
+export interface IGridLayoutSpec extends ILayoutSpecBase {
+ /**
+ * 设置布局类型为grid布局
+ */
+ type: 'grid';
+ /**
+ * grid布局的总列数
+ */
+ col: number;
+ /**
+ * grid布局的总行数
+ */
+ row: number;
+ /**
+ * 可选配置,指定某几列的宽度
+ */
+ colWidth?: {
+ /**
+ * 指定列数,序号从 0 开始
+ */
+ index: number;
+ /**
+ * 设置指定列的宽度,单位为像素
+ */
+ size: number | ((maxSize: number) => number);
+ }[];
+ /**
+ * 可选配置,指定某几行的高度
+ */
+ rowHeight?: {
+ /**
+ * 指定行数,序号从 0 开始
+ */
+ index: number;
+ /**
+ * 设置指定行的高度,单位为像素
+ */
+ size: number | ((maxSize: number) => number);
+ }[];
+ /**
+ *
+ * 指定所有图表元素所在位置,图表元素的位置起点和占几行几列,可以占多行多列
+ * 图表元素位置允许配置重叠。
+ */
+ elements: ElementSpec[];
+}
+
+网格单元格内模块位置设置
+export type ElementSpec = (
+ | {
+ /**
+ * 组件对应的spec key,如'legends'表示图例
+ */
+ modelKey: string;
+ /**
+ * 组件对应的序号
+ */
+ modelIndex: number;
+ }
+ | {
+ /**
+ * 组件对应的id
+ */
+ modelId: string;
+ }
+) & {
+ /**
+ * 组件在grid布局中所在的列。从左向右,从 0 开始计数
+ */
+ col: number;
+ /**
+ * 组件在grid布局中所在的列跨度,即占了几列,默认值为1
+ */
+ colSpan?: number;
+ /**
+ * 组件在grid布局中所在的行。从上向下,从 0 开始计数。
+ */
+ row: number;
+ /**
+ * 组件在grid布局中所在的行跨度,即占了几行,默认值为1
+ */
+ rowSpan?: number;
+};
+
+```
+## Custom Layout
+
+VChart also provides custom layout capabilities, allowing users to freely set spatial properties for all layout elements.
+
+For example, this [example](https://www.visactor.io/vchart/demo/layout/custom-layout) on the official website.
+
+
+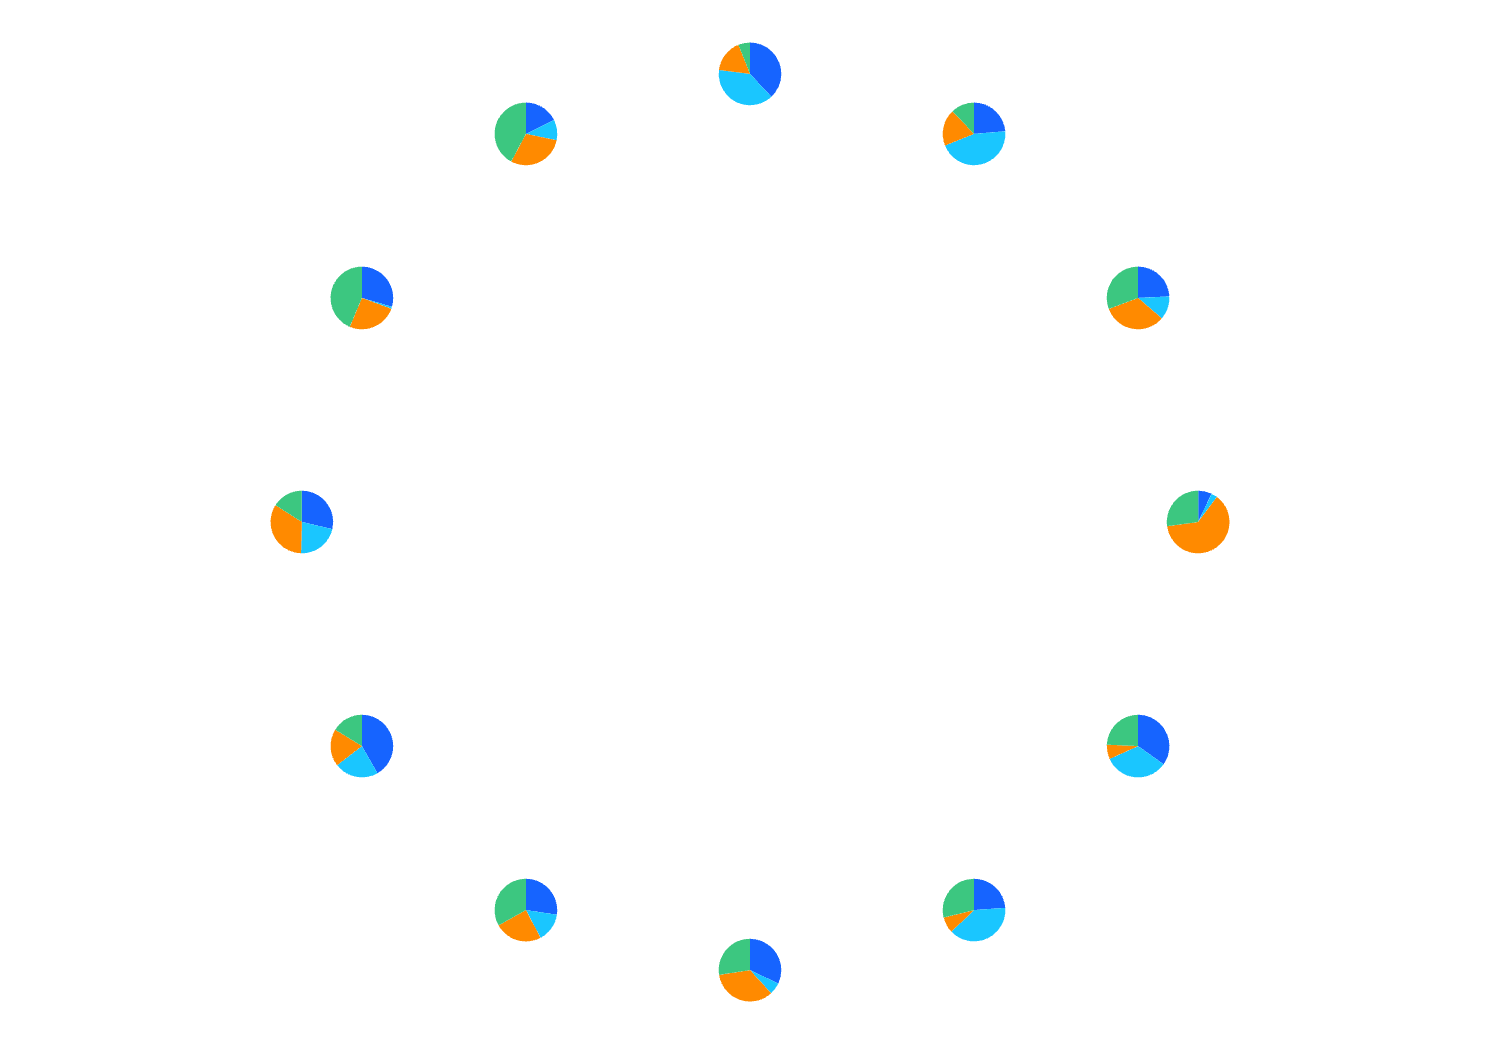 +
+Draw 12 pies at the twelve positions of the clock. No additional attribute configuration is needed for these pie charts, and the layout logic is only about 10 lines.
+
+```Typescript
+const vchart = new VChart(spec, {
+ dom: CONTAINER_ID,
+ // 通过 option 传入自定义布局
+ layout: (chart, item, chartLayoutRect, chartViewBox) => {
+ /**
+ * chart 是图表对象
+ * item 是参与布局的图表模块
+ * chartLayoutRect 是图表减去padding后的可用布局空间
+ * chartViewBox 是图表在画布中的位置,包含图表的padding。
+ */
+ const radius = Math.min(chartLayoutRect.width / 2, chartLayoutRect.height / 2);
+ const center = { x: chartLayoutRect.width / 2, y: chartLayoutRect.height / 2 };
+ const regionSize = radius * 0.2;
+ const regionPosRadius = radius - regionSize * 0.5 * 1.415;
+ // 使用布局元素的属性和提供的方法完成布局
+ item.forEach((i, index) => {
+ const angle = (index / 12) * Math.PI * 2;
+ // 请在布局完成后务必调用
+ i.setLayoutStartPosition({
+ x: center.x + Math.sin(angle) * regionPosRadius - regionSize * 0.5,
+ y: center.y + Math.cos(angle) * regionPosRadius - regionSize * 0.5
+ });
+ i.setLayoutRect({ width: regionSize, height: regionSize });
+ i.updateLayoutAttribute && i.updateLayoutAttribute();
+ });
+ }
+});
+
+```
+
+
+ # This document was revised and organized by the following person
+ [玄魂](https://github.com/xuanhun)
\ No newline at end of file
diff --git a/docs/assets/contributing/en/sourcecode/9.2-vchart-layout-source-code-analysis.md b/docs/assets/contributing/en/sourcecode/9.2-vchart-layout-source-code-analysis.md
new file mode 100644
index 0000000000..a38f137f89
--- /dev/null
+++ b/docs/assets/contributing/en/sourcecode/9.2-vchart-layout-source-code-analysis.md
@@ -0,0 +1,468 @@
+---
+title: 9.2 VChart Layout Source Code Explanation
+
+key words: VisActor,VChart,VTable,VStrory,VMind,VGrammar,VRender,Visualization,Chart,Data,Table,Graph,Gis,LLM
+---
+# Layout Elements
+
+Layout elements inherit the layout information of the chart module and are responsible for participating in the layout logic. Its implementation is at this repository address
+
+`packages/vchart/src/layout/layout-item.ts`
+
+Below is a detailed explanation of the layout element's code
+
+## Receiving Layout Configuration
+
+In the code, the layout element reads the layout configuration from the spec through the setAttrFromSpec lifecycle, and additionally calculates the pixel values in the layout configuration during onLayoutStart.
+
+
+```Typescript
+ // line: 191
+ setAttrFromSpec(spec: ILayoutItemSpec, chartViewRect: ILayoutRect) {
+ this._spec = spec;
+ this.layoutType = spec.layoutType ?? this.layoutType;
+ this.layoutLevel = spec.layoutLevel ?? this.layoutLevel;
+ this.layoutOrient = spec.orient ?? this.layoutOrient;
+
+ this._setLayoutAttributeFromSpec(spec, chartViewRect);
+
+ this.layoutClip = spec.clip ?? this.layoutClip;
+ }
+
+ onLayoutStart(layoutRect: IRect, viewRect: ILayoutRect, ctx: any) {
+ // 在 layoutStart 时重新计算 spec 中的布局属性值
+ // 确保 resize 后,这些值保持正确的px值。
+ this._setLayoutAttributeFromSpec(this._spec, viewRect);
+ }
+
+```
+The logic for calculating layout pixel values includes percentage strings, function configurations, etc. The unified calculation logic for layout values is here. \r\n\r
+```Typescript
+// packages/vchart/src/util/space.ts
+export function calcLayoutNumber(
+ v: ILayoutNumber | undefined,
+ size: number,
+ callOp?: ILayoutRect, //如果是函数类型的话,函数的参数
+ defaultValue: number = 0
+) {
+ if (isNumber(v)) {
+ return v;
+ }
+ if (isPercent(v)) {
+ return (Number(v.substring(0, v.length - 1)) * size) / 100;
+ }
+ if (isFunction(v)) {
+ return v(callOp);
+ }
+ if (isObject(v)) {
+ return size * (v.percent ?? 0) + (v.offset ?? 0);
+ }
+ return defaultValue;
+}
+
+```
+
+
+## Communicating with the Chart Module
+
+The layout logic will obtain the actual drawing size of the chart module in a given space by calling the computeBoundsInRect method of `LayoutItem`.
+
+### **LayoutItem Obtaining Drawing Size**
+
+```Typescript
+// line: 365
+computeBoundsInRect(rect: ILayoutRect): ILayoutRect {
+ // 保留布局使用的rect
+ this._lastComputeRect = rect;
+ // 一些情况下不需要计算
+ if (
+ (this.layoutType === 'region-relative' || this.layoutType === 'region-relative-overlap') &&
+ ((this._layoutRectLevelMap.width === USER_LAYOUT_RECT_LEVEL &&
+ (this.layoutOrient === 'left' || this.layoutOrient === 'right')) ||
+ (this._layoutRectLevelMap.height === USER_LAYOUT_RECT_LEVEL &&
+ (this.layoutOrient === 'bottom' || this.layoutOrient === 'top')))
+ ) {
+ return this._layoutRect;
+ }
+ // 将布局空间限制到 spec 设置内
+ // 避免操作到元素本身的 aabbbounds
+ const bounds = { ...this._model.getBoundsInRect(this.setRectInSpec(rect), rect) };
+ // 用户设置了布局元素宽高的场景下,内部布局结果的 bounds 不能直接作为图表布局bounds
+ this.changeBoundsBySetting(bounds);
+ // 保留当前模块的布局超出内容,用来处理自动缩进
+ // 当前 bounds 需要有实际宽高
+ if (this.autoIndent && bounds.x2 - bounds.x1 > 0 && bounds.y2 - bounds.y1 > 0) {
+ this._lastComputeOutBounds.x1 = Math.ceil(-bounds.x1);
+ this._lastComputeOutBounds.x2 = Math.ceil(bounds.x2 - rect.width);
+ this._lastComputeOutBounds.y1 = Math.ceil(-bounds.y1);
+ this._lastComputeOutBounds.y2 = Math.ceil(bounds.y2 - rect.height);
+ }
+ // 返回的布局大小也要限制到 spec 设置内
+ let result = this.setRectInSpec(boundsInRect(bounds, rect));
+ if (this._option.transformLayoutRect) {
+ result = this._option.transformLayoutRect(result);
+ }
+
+ return result;
+ }
+
+```
+The chart module here needs to implement the interface to get bounds
+
+```Typescript
+export interface ILayoutModel extends IModel {
+ getBoundsInRect: (rect: ILayoutRect, fullRect: ILayoutRect) => IBoundsLike;
+}
+
+```
+### Chart Module Obtaining Layout Information
+
+The chart module obtains the layout space information by holding `layoutItem`
+
+
+```xml
+// 下面是部分类型定义
+export interface ILayoutItem {
+ readonly type: string;
+ /**
+ * 标记这个布局Item的方向(left->right, right->left, top->bottom, bottom->top)
+ */
+ directionStr?: 'l2r' | 'r2l' | 't2b' | 'b2t';
+ layoutClip: boolean;
+ layoutType: ILayoutType;
+ layoutBindRegionID: number | number[];
+ layoutOrient: IOrientType;
+ /** 是否自动缩进 */
+ autoIndent: boolean;
+ alignSelf?: 'start' | 'end' | 'middle';
+ /** paddding */
+ layoutPaddingLeft: number;
+ layoutPaddingTop: number;
+ layoutPaddingRight: number;
+ layoutPaddingBottom: number;
+ /** offset */
+ layoutOffsetX: number;
+ layoutOffsetY: number;
+
+ /** 布局优先级,越大越先处理 */
+ layoutLevel: number;
+
+ getLayoutStartPoint: () => ILayoutPoint;
+ getLayoutRect: () => ILayoutRect;
+ }
+
+
+```
+# Chart Module
+
+The chart module will obtain layout information and update its own graphic position during the `onLayoutEnd` lifecycle.
+
+
+```Typescript
+// packages/vchart/src/model/layout-model.ts
+// line: 56
+onLayoutEnd(ctx: any): void {
+ super.onLayoutEnd(ctx);
+ // diff layoutRect
+ this.updateLayoutAttribute();
+ // ... other code
+ }
+
+```
+
+
+# Layout Logic
+
+In VChart, the definition of layout logic is actually just a function that receives layout elements and updates their layout properties.
+
+
+```xml
+// 类型定义
+export type LayoutCallBack = (
+ chart: any,
+ item: ILayoutItem[],
+ chartLayoutRect: IRect,
+ chartViewBox: IBoundsLike
+) => void;
+
+// VChart 通过接口 setLayout 设置自定义布局
+export interface IVChart {
+ /**
+ * 设置自定义布局
+ */
+ setLayout: (layout: LayoutCallBack) => void;
+ // other
+}
+
+```
+## Placeholder Layout
+
+The most commonly used layout logic is the method of placing layout elements on the canvas one by one according to type and priority.
+
+The calculation of placeholders is done by initializing the top, bottom, left, and right boundaries at the start of the layout, and then reducing the boundaries after each item is laid out, gradually narrowing the layoutable area.
+
+### **Initialization**
+
+
+```Typescript
+protected _layoutInit(_chart: IChart, items: ILayoutItem[], chartLayoutRect: IRect, chartViewBox: IBoundsLike) {
+ this._chartLayoutRect = chartLayoutRect;
+ this._chartViewBox = chartViewBox;
+ this.leftCurrent = chartLayoutRect.x;
+ this.topCurrent = chartLayoutRect.y;
+ this.rightCurrent = chartLayoutRect.x + chartLayoutRect.width;
+ this.bottomCurrent = chartLayoutRect.height + chartLayoutRect.y;
+
+ // 越大越先处理,进行排序调整,利用原地排序特性,排序会受 level 和传进来的数组顺序共同影响
+ items.sort((a, b) => b.layoutLevel - a.layoutLevel);
+}
+
+```
+### Layout Execution
+
+
+```xml
+// packages/vchart/src/layout/base-layout.ts
+
+// line: 91
+layoutItems(_chart: IChart, items: ILayoutItem[], chartLayoutRect: IRect, chartViewBox: IBoundsLike): void {
+ // 布局初始化
+ this._layoutInit(_chart, items, chartLayoutRect, chartViewBox);
+ // 先布局 normal 类型的元素
+ this._layoutNormalItems(items);
+ // 开始布局 region 相关元素
+ // 为了自动缩进能力先保存一下当前的布局空间
+ const layoutTemp: LayoutSideType = {
+ left: this.leftCurrent,
+ top: this.topCurrent,
+ right: this.rightCurrent,
+ bottom: this.bottomCurrent
+ };
+ // 将 reion 相关元素分组
+ const { regionItems, relativeItems, relativeOverlapItems, allRelatives,overlapItems } = this._groupItems(items);
+ // 有元素开启了自动缩进
+ // TODO:目前只有普通占位布局下的 region-relative 元素支持
+ // 主要考虑常规元素超出画布一般为用户个性设置,而且可以设置padding规避裁剪,不需要使用自动缩进
+ this.layoutRegionItems(regionItems, relativeItems, relativeOverlapItems, overlapItems);
+ // 缩进计算
+ this._processAutoIndent(regionItems, relativeItems, relativeOverlapItems, overlapItems, allRelatives, layoutTemp);
+ // 最后布局绝对定位元素
+ this.layoutAbsoluteItems(items.filter(x => x.layoutType === 'absolute'));
+ }
+
+```
+`item` placeholder: Below is the logic for a regular element placeholder. First, pass the current layout range to `item`. After `item` completes the layout, reduce the space in the corresponding direction.
+
+```Typescript
+protected layoutNormalItems(normalItems: ILayoutItem[]): void {
+ normalItems.forEach(item => {
+ const layoutRect = this.getItemComputeLayoutRect(item);
+ const rect = item.computeBoundsInRect(layoutRect);
+ item.setLayoutRect(rect);
+
+ if (item.layoutOrient === 'left') {
+ item.setLayoutStartPosition({
+ x: this.leftCurrent + item.layoutOffsetX + item.layoutPaddingLeft,
+ y: this.topCurrent + item.layoutOffsetY + item.layoutPaddingTop
+ });
+ this.leftCurrent += rect.width + item.layoutPaddingLeft + item.layoutPaddingRight;
+ } else if (item.layoutOrient === 'top') {
+ item.setLayoutStartPosition({
+ x: this.leftCurrent + item.layoutOffsetX + item.layoutPaddingLeft,
+ y: this.topCurrent + item.layoutOffsetY + item.layoutPaddingTop
+ });
+ this.topCurrent += rect.height + item.layoutPaddingTop + item.layoutPaddingBottom;
+ } else if (item.layoutOrient === 'right') {
+ item.setLayoutStartPosition({
+ x: this.rightCurrent + item.layoutOffsetX - rect.width - item.layoutPaddingRight,
+ y: this.topCurrent + item.layoutOffsetY + item.layoutPaddingTop
+ });
+ this.rightCurrent -= rect.width + item.layoutPaddingLeft + item.layoutPaddingRight;
+ } else if (item.layoutOrient === 'bottom') {
+ item.setLayoutStartPosition({
+ x: this.leftCurrent + item.layoutOffsetX + item.layoutPaddingRight,
+ y: this.bottomCurrent + item.layoutOffsetY - rect.height - item.layoutPaddingBottom
+ });
+ this.bottomCurrent -= rect.height + item.layoutPaddingTop + item.layoutPaddingBottom;
+ }
+ });
+ }
+
+```
+
+
+## Grid Layout
+
+The grid layout method is to first establish row and column layout information arrays according to the layout configuration and configuration items.
+
+### Initialization
+
+
+```Typescript
+// packages/vchart/src/layout/grid-layout/grid-layout.ts
+type GridSize = {
+ value: number;
+ isUserSetting: boolean;
+ isLayoutSetting: boolean;
+};
+
+export class GridLayout implements IBaseLayout {
+ // 行列信息
+ protected _col: number = 1;
+ protected _row: number = 1;
+ // 存储行列的大小和配置信息
+ protected _colSize: GridSize[];
+ protected _rowSize: GridSize[];
+
+ // 每一行,每一列都有一个数组存储它对应的布局 item
+ protected _colElements: ILayoutItem[][];
+ protected _rowElements: ILayoutItem[][];
+
+ constructor(gridInfo: IGridLayoutSpec, ctx: utilFunctionCtx) {
+ this.standardizationSpec(gridInfo);
+ this._gridInfo = gridInfo;
+ this._col = gridInfo.col;
+ this._row = gridInfo.row;
+ this._colSize = new Array(this._col).fill(null);
+ this._rowSize = new Array(this._row).fill(null);
+ this._colElements = new Array(this._col).fill([]);
+ this._rowElements = new Array(this._row).fill([]);
+ this._onError = ctx?.onError;
+
+ this.initUserSetting();
+ }
+
+ protected initUserSetting() {
+ // 先对用户设置的宽高进行设置
+ this._gridInfo.colWidth &&
+ this.setSizeFromUserSetting(this._gridInfo.colWidth, this._colSize, this._col, this._chartLayoutRect.width);
+
+ this._gridInfo.rowHeight &&
+ this.setSizeFromUserSetting(this._gridInfo.rowHeight, this._rowSize, this._row, this._chartLayoutRect.height);
+ // 其余位置默认填充0
+ this._colSize.forEach((c, i) => {
+ if (!c) {
+ this._colSize[i] = {
+ value: 0,
+ isUserSetting: false,
+ isLayoutSetting: false
+ };
+ }
+ });
+ this._rowSize.forEach((r, i) => {
+ if (!r) {
+ this._rowSize[i] = {
+ value: 0,
+ isUserSetting: false,
+ isLayoutSetting: false
+ };
+ }
+ });
+ }
+ // other
+}
+
+```
+### Layout Execution
+
+In grid layout, elements are placed into the layout information according to certain attributes, configured to their designated row and column positions. Then, in the order of columns first and rows second, each element undergoes layout calculation and is placed into the prepared row and column layout information.
+
+After the first column layout is completed, only the column width is determined, and then the row layout is performed. After the first round of layout is completed, the column elements undergo a second layout, allowing them to readjust their layout attributes based on the width. Only after this are all layout information finalized, and at this point, all elements are positioned once.
+
+```Typescript
+layoutItems(_chart: IChart, items: ILayoutItem[], chartLayoutRect: IRect, chartViewBox: IBoundsLike): void {
+ this._chartLayoutRect = chartLayoutRect;
+ this._chartViewBox = chartViewBox;
+ // 先清空旧布局信息
+ this.clearLayoutSize();
+ // 越大越先处理,进行排序调整,利用原地排序特性,排序会受 level 和传进来的数组顺序共同影响
+ items.sort((a, b) => b.layoutLevel - a.layoutLevel);
+
+ // 剔除 region 后,其余元素先布局运算
+ const normalItems = items.filter(item => item.layoutType === 'normal' && item.getModelVisible() !== false);
+ const normalItemsCol = normalItems.filter(item => isColItem(item));
+ const normalItemsRow = normalItems.filter(item => !isColItem(item));
+ normalItems.forEach(item => {
+ this.layoutOneItem(item, 'user', false);
+ });
+
+ // region 和 region 关联元素
+ const regionsRelative = items.filter(x => x.layoutType === 'region-relative');
+ const regionsRelativeCol = regionsRelative.filter(item => isColItem(item));
+ const regionsRelativeRow = regionsRelative.filter(item => !isColItem(item));
+ // 先进行 col 方向布局
+ regionsRelativeCol.forEach(item => this.layoutOneItem(item, 'user', false));
+ // 然后得到最终 col 信息 此时已经是最终 col 信息
+ this.layoutGrid('col');
+ // 再使用宽度信息辅助row方向排序
+ // 此时普通占位元素,会因为布局宽度影响最终布局高度
+ normalItemsRow.forEach(item => this.layoutOneItem(item, 'colGrid', false));
+ regionsRelativeRow.forEach(item => {
+ this.layoutOneItem(item, 'colGrid', false);
+ });
+ // 然后得到最终 row 信息
+ this.layoutGrid('row');
+ // 统一水平方向元素高度
+ regionsRelativeRow.forEach(item => {
+ this.layoutOneItem(item, 'grid', false);
+ });
+ // 再使用宽度信息,第二次次对 col 方向布局
+ normalItemsCol.forEach(item => this.layoutOneItem(item, 'grid', false));
+ regionsRelativeCol.forEach(item => {
+ // 此时从布局逻辑可知,item的layoutRect会发生,将item的layoutTag设置为true
+ this.layoutOneItem(item, 'grid', true);
+ });
+ this.layoutGrid('col');
+
+ // region
+ items.filter(x => x.layoutType === 'region').forEach(item => this.layoutOneItem(item, 'grid', false));
+
+ // 再找出 absolute 元素,无需排序,在 compiler 层需要排序放置
+ this.layoutAbsoluteItems(items.filter(x => x.layoutType === 'absolute'));
+
+ // 最后基于grid 设置位置
+ items
+ .filter(x => x.layoutType !== 'absolute')
+ .forEach(item => {
+ item.setLayoutStartPosition(this.getItemPosition(item));
+ });
+ }
+
+```
+The layout logic of a single element remains consistent, using the same method \r\n\r
+```Typescript
+protected layoutOneItem(item: ILayoutItem, sizeType: 'user' | 'grid' | 'colGrid' | 'rowGrid', ignoreTag: boolean) {
+ const sizeCallRow =
+ sizeType === 'rowGrid' || sizeType === 'grid' ? this.getSizeFromGrid.bind(this) : this.getSizeFromUser.bind(this);
+ const sizeCallCol =
+ sizeType === 'colGrid' || sizeType === 'grid' ? this.getSizeFromGrid.bind(this) : this.getSizeFromUser.bind(this);
+ // 先获取 item 的 grid 信息
+ const gridSpec = this.getItemGridInfo(item);
+ // 设置空间
+ const computeRect = {
+ width:
+ (sizeCallCol(gridSpec, 'col') ?? this._chartLayoutRect.width) -
+ item.layoutPaddingLeft -
+ item.layoutPaddingRight,
+ height:
+ (sizeCallRow(gridSpec, 'row') ?? this._chartLayoutRect.height) -
+ item.layoutPaddingTop -
+ item.layoutPaddingBottom
+ };
+ // 计算尺寸
+ const rect = item.computeBoundsInRect(computeRect);
+ if (!isValidNumber(rect.width)) {
+ rect.width = computeRect.width;
+ }
+ if (!isValidNumber(rect.height)) {
+ rect.height = computeRect.height;
+ }
+ // 更新最终尺寸
+ item.setLayoutRect(sizeType !== 'grid' ? rect : computeRect);
+ // 设置大小到grid
+ this.setItemLayoutSizeToGrid(item, gridSpec);
+ }
+}
+
+```
+# This document was revised and organized by the following person \r\n [玄魂](https://github.com/xuanhun)
\ No newline at end of file
diff --git a/docs/assets/contributing/menu.json b/docs/assets/contributing/menu.json
index 6229069988..1f02e3f180 100644
--- a/docs/assets/contributing/menu.json
+++ b/docs/assets/contributing/menu.json
@@ -42,6 +42,267 @@
"zh": "6.如何上传图片",
"en": "6-How to upload images"
}
+ },
+ {
+ "path": "sourcecode",
+ "title": {
+ "zh": "源代码分析",
+ "en": "Source Code Analysis"
+ },
+ "children": [
+ {
+ "path": "0-vchart-engineering",
+ "title": {
+ "zh": "VChart 工程化",
+ "en": "VChart Engineering"
+ }
+ },
+ {
+ "path": "1-vchart-basic-principles",
+ "title": {
+ "zh": "VChart 基本原理",
+ "en": "VChart Basic Principles"
+ }
+ },
+ {
+ "path": "3-how-to-assemble-a-vchart",
+ "title": {
+ "zh": "如何组装一个 VChart",
+ "en": "How to Assemble a VChart"
+ }
+ },
+ {
+ "path": "6.1-primitive-basic-concepts",
+ "title": {
+ "zh": "图元基础概念",
+ "en": "Primitive Basic Concepts"
+ }
+ },
+ {
+ "path": "6.2-visual-channel-mapping",
+ "title": {
+ "zh": "视觉通道映射",
+ "en": "Visual Channel Mapping"
+ }
+ },
+ {
+ "path": "6.3-primitive-interaction-and-state-handling",
+ "title": {
+ "zh": "图元交互与状态处理",
+ "en": "Primitive Interaction and State Handling"
+ }
+ },
+ {
+ "path": "6.4-custom-primitives",
+ "title": {
+ "zh": "自定义图元",
+ "en": "Custom Primitives"
+ }
+ },
+ {
+ "path": "9.1-vchart-layout-basic-concepts",
+ "title": {
+ "zh": "VChart 布局基础概念",
+ "en": "VChart Layout Basic Concepts"
+ }
+ },
+ {
+ "path": "9.2-vchart-layout-source-code-analysis",
+ "title": {
+ "zh": "VChart 布局源码分析",
+ "en": "VChart Layout Source Code Analysis"
+ }
+ },
+ {
+ "path": "10.1-animation-concepts-and-types",
+ "title": {
+ "zh": "动画概念与类型",
+ "en": "Animation Concepts and Types"
+ }
+ },
+ {
+ "path": "10.2-global-morphing-animation",
+ "title": {
+ "zh": "全局变形动画",
+ "en": "Global Morphing Animation"
+ }
+ },
+ {
+ "path": "10.3-state-change-animation",
+ "title": {
+ "zh": "状态变更动画",
+ "en": "State Change Animation"
+ }
+ },
+ {
+ "path": "10.4-data-update-animation",
+ "title": {
+ "zh": "数据更新动画",
+ "en": "Data Update Animation"
+ }
+ },
+ {
+ "path": "10.5-animation-orchestration",
+ "title": {
+ "zh": "动画编排",
+ "en": "Animation Orchestration"
+ }
+ },
+ {
+ "path": "11.1-theme-configuration-parsing-logic",
+ "title": {
+ "zh": "主题配置解析逻辑",
+ "en": "Theme Configuration Parsing Logic"
+ }
+ },
+ {
+ "path": "11.2-theme-update-source-code-analysis",
+ "title": {
+ "zh": "主题更新源码分析",
+ "en": "Theme Update Source Code Analysis"
+ }
+ },
+ {
+ "path": "12.1-vchart-plugin-mechanism",
+ "title": {
+ "zh": "VChart 插件机制",
+ "en": "VChart Plugin Mechanism"
+ }
+ },
+ {
+ "path": "12.2-vchart-plugin-feature-source-code-analysis",
+ "title": {
+ "zh": "VChart 插件功能源码分析",
+ "en": "VChart Plugin Feature Source Code Analysis"
+ }
+ },
+ {
+ "path": "13.1-vchart-on-demand-loading-mechanism",
+ "title": {
+ "zh": "VChart 按需加载机制",
+ "en": "VChart On-demand Loading Mechanism"
+ }
+ },
+ {
+ "path": "13.2-vchart-on-demand-loading-source-code-analysis",
+ "title": {
+ "zh": "VChart 按需加载源码分析",
+ "en": "VChart On-demand Loading Source Code Analysis"
+ }
+ },
+ {
+ "path": "14.1.1-react-vchart-introduction",
+ "title": {
+ "zh": "React VChart 介绍",
+ "en": "React VChart Introduction"
+ }
+ },
+ {
+ "path": "14.1.2-react-vchart-source-code-analysis",
+ "title": {
+ "zh": "React VChart 源码分析",
+ "en": "React VChart Source Code Analysis"
+ }
+ },
+ {
+ "path": "14.2.1-taro-vchart-introduction",
+ "title": {
+ "zh": "Taro VChart 介绍",
+ "en": "Taro VChart Introduction"
+ }
+ },
+ {
+ "path": "14.2.2-taro-vchart-source-code-analysis",
+ "title": {
+ "zh": "Taro VChart 源码分析",
+ "en": "Taro VChart Source Code Analysis"
+ }
+ },
+ {
+ "path": "14.3.1-lark-vchart-introduction",
+ "title": {
+ "zh": "Lark VChart 介绍",
+ "en": "Lark VChart Introduction"
+ }
+ },
+ {
+ "path": "14.3.2-lark-vchart-source-code-analysis",
+ "title": {
+ "zh": "Lark VChart 源码分析",
+ "en": "Lark VChart Source Code Analysis"
+ }
+ },
+ {
+ "path": "14.4.1-tt-vchart-introduction",
+ "title": {
+ "zh": "TT VChart 介绍",
+ "en": "TT VChart Introduction"
+ }
+ },
+ {
+ "path": "14.4.2-tt-vchart-source-code-analysis",
+ "title": {
+ "zh": "TT VChart 源码分析",
+ "en": "TT VChart Source Code Analysis"
+ }
+ },
+ {
+ "path": "14.5.1-wx-vchart-introduction",
+ "title": {
+ "zh": "WX VChart 介绍",
+ "en": "WX VChart Introduction"
+ }
+ },
+ {
+ "path": "14.5.2-wx-vchart-source-code-analysis",
+ "title": {
+ "zh": "WX VChart 源码分析",
+ "en": "WX VChart Source Code Analysis"
+ }
+ },
+ {
+ "path": "14.6.1-openinula-vchart-introduction",
+ "title": {
+ "zh": "OpenInula VChart 介绍",
+ "en": "OpenInula VChart Introduction"
+ }
+ },
+ {
+ "path": "14.6.2-openinula-vchart-source-code-analysis",
+ "title": {
+ "zh": "OpenInula VChart 源码分析",
+ "en": "OpenInula VChart Source Code Analysis"
+ }
+ },
+ {
+ "path": "14.7.1-harmony-vchart-introduction",
+ "title": {
+ "zh": "Harmony VChart 介绍",
+ "en": "Harmony VChart Introduction"
+ }
+ },
+ {
+ "path": "14.7.2-harmony-vchart-source-code-analysis",
+ "title": {
+ "zh": "Harmony VChart 源码分析",
+ "en": "Harmony VChart Source Code Analysis"
+ }
+ },
+ {
+ "path": "14.8.1-vchart-svg-plugin-introduction",
+ "title": {
+ "zh": "VChart SVG 插件介绍",
+ "en": "VChart SVG Plugin Introduction"
+ }
+ },
+ {
+ "path": "14.8.2-vchart-svg-plugin-source-code-analysis",
+ "title": {
+ "zh": "VChart SVG 插件源码分析",
+ "en": "VChart SVG Plugin Source Code Analysis"
+ }
+ }
+ ]
}
]
}
\ No newline at end of file
diff --git a/docs/assets/contributing/zh/sourcesode/0-vchart-engineering.md b/docs/assets/contributing/zh/sourcesode/0-vchart-engineering.md
new file mode 100644
index 0000000000..f6fdfc378b
--- /dev/null
+++ b/docs/assets/contributing/zh/sourcesode/0-vchart-engineering.md
@@ -0,0 +1,193 @@
+---
+title: 0 VChart 工程化
+
+key words: VisActor,VChart,VTable,VStrory,VMind,VGrammar,VRender,Visualization,Chart,Data,Table,Graph,Gis,LLM
+---
+# 0.1 启动 demo
+
+## 0.1.1 Fork 项目
+
+在 Github 上,你需要 Fork VChart 项目。
+
+
+
+Draw 12 pies at the twelve positions of the clock. No additional attribute configuration is needed for these pie charts, and the layout logic is only about 10 lines.
+
+```Typescript
+const vchart = new VChart(spec, {
+ dom: CONTAINER_ID,
+ // 通过 option 传入自定义布局
+ layout: (chart, item, chartLayoutRect, chartViewBox) => {
+ /**
+ * chart 是图表对象
+ * item 是参与布局的图表模块
+ * chartLayoutRect 是图表减去padding后的可用布局空间
+ * chartViewBox 是图表在画布中的位置,包含图表的padding。
+ */
+ const radius = Math.min(chartLayoutRect.width / 2, chartLayoutRect.height / 2);
+ const center = { x: chartLayoutRect.width / 2, y: chartLayoutRect.height / 2 };
+ const regionSize = radius * 0.2;
+ const regionPosRadius = radius - regionSize * 0.5 * 1.415;
+ // 使用布局元素的属性和提供的方法完成布局
+ item.forEach((i, index) => {
+ const angle = (index / 12) * Math.PI * 2;
+ // 请在布局完成后务必调用
+ i.setLayoutStartPosition({
+ x: center.x + Math.sin(angle) * regionPosRadius - regionSize * 0.5,
+ y: center.y + Math.cos(angle) * regionPosRadius - regionSize * 0.5
+ });
+ i.setLayoutRect({ width: regionSize, height: regionSize });
+ i.updateLayoutAttribute && i.updateLayoutAttribute();
+ });
+ }
+});
+
+```
+
+
+ # This document was revised and organized by the following person
+ [玄魂](https://github.com/xuanhun)
\ No newline at end of file
diff --git a/docs/assets/contributing/en/sourcecode/9.2-vchart-layout-source-code-analysis.md b/docs/assets/contributing/en/sourcecode/9.2-vchart-layout-source-code-analysis.md
new file mode 100644
index 0000000000..a38f137f89
--- /dev/null
+++ b/docs/assets/contributing/en/sourcecode/9.2-vchart-layout-source-code-analysis.md
@@ -0,0 +1,468 @@
+---
+title: 9.2 VChart Layout Source Code Explanation
+
+key words: VisActor,VChart,VTable,VStrory,VMind,VGrammar,VRender,Visualization,Chart,Data,Table,Graph,Gis,LLM
+---
+# Layout Elements
+
+Layout elements inherit the layout information of the chart module and are responsible for participating in the layout logic. Its implementation is at this repository address
+
+`packages/vchart/src/layout/layout-item.ts`
+
+Below is a detailed explanation of the layout element's code
+
+## Receiving Layout Configuration
+
+In the code, the layout element reads the layout configuration from the spec through the setAttrFromSpec lifecycle, and additionally calculates the pixel values in the layout configuration during onLayoutStart.
+
+
+```Typescript
+ // line: 191
+ setAttrFromSpec(spec: ILayoutItemSpec, chartViewRect: ILayoutRect) {
+ this._spec = spec;
+ this.layoutType = spec.layoutType ?? this.layoutType;
+ this.layoutLevel = spec.layoutLevel ?? this.layoutLevel;
+ this.layoutOrient = spec.orient ?? this.layoutOrient;
+
+ this._setLayoutAttributeFromSpec(spec, chartViewRect);
+
+ this.layoutClip = spec.clip ?? this.layoutClip;
+ }
+
+ onLayoutStart(layoutRect: IRect, viewRect: ILayoutRect, ctx: any) {
+ // 在 layoutStart 时重新计算 spec 中的布局属性值
+ // 确保 resize 后,这些值保持正确的px值。
+ this._setLayoutAttributeFromSpec(this._spec, viewRect);
+ }
+
+```
+The logic for calculating layout pixel values includes percentage strings, function configurations, etc. The unified calculation logic for layout values is here. \r\n\r
+```Typescript
+// packages/vchart/src/util/space.ts
+export function calcLayoutNumber(
+ v: ILayoutNumber | undefined,
+ size: number,
+ callOp?: ILayoutRect, //如果是函数类型的话,函数的参数
+ defaultValue: number = 0
+) {
+ if (isNumber(v)) {
+ return v;
+ }
+ if (isPercent(v)) {
+ return (Number(v.substring(0, v.length - 1)) * size) / 100;
+ }
+ if (isFunction(v)) {
+ return v(callOp);
+ }
+ if (isObject(v)) {
+ return size * (v.percent ?? 0) + (v.offset ?? 0);
+ }
+ return defaultValue;
+}
+
+```
+
+
+## Communicating with the Chart Module
+
+The layout logic will obtain the actual drawing size of the chart module in a given space by calling the computeBoundsInRect method of `LayoutItem`.
+
+### **LayoutItem Obtaining Drawing Size**
+
+```Typescript
+// line: 365
+computeBoundsInRect(rect: ILayoutRect): ILayoutRect {
+ // 保留布局使用的rect
+ this._lastComputeRect = rect;
+ // 一些情况下不需要计算
+ if (
+ (this.layoutType === 'region-relative' || this.layoutType === 'region-relative-overlap') &&
+ ((this._layoutRectLevelMap.width === USER_LAYOUT_RECT_LEVEL &&
+ (this.layoutOrient === 'left' || this.layoutOrient === 'right')) ||
+ (this._layoutRectLevelMap.height === USER_LAYOUT_RECT_LEVEL &&
+ (this.layoutOrient === 'bottom' || this.layoutOrient === 'top')))
+ ) {
+ return this._layoutRect;
+ }
+ // 将布局空间限制到 spec 设置内
+ // 避免操作到元素本身的 aabbbounds
+ const bounds = { ...this._model.getBoundsInRect(this.setRectInSpec(rect), rect) };
+ // 用户设置了布局元素宽高的场景下,内部布局结果的 bounds 不能直接作为图表布局bounds
+ this.changeBoundsBySetting(bounds);
+ // 保留当前模块的布局超出内容,用来处理自动缩进
+ // 当前 bounds 需要有实际宽高
+ if (this.autoIndent && bounds.x2 - bounds.x1 > 0 && bounds.y2 - bounds.y1 > 0) {
+ this._lastComputeOutBounds.x1 = Math.ceil(-bounds.x1);
+ this._lastComputeOutBounds.x2 = Math.ceil(bounds.x2 - rect.width);
+ this._lastComputeOutBounds.y1 = Math.ceil(-bounds.y1);
+ this._lastComputeOutBounds.y2 = Math.ceil(bounds.y2 - rect.height);
+ }
+ // 返回的布局大小也要限制到 spec 设置内
+ let result = this.setRectInSpec(boundsInRect(bounds, rect));
+ if (this._option.transformLayoutRect) {
+ result = this._option.transformLayoutRect(result);
+ }
+
+ return result;
+ }
+
+```
+The chart module here needs to implement the interface to get bounds
+
+```Typescript
+export interface ILayoutModel extends IModel {
+ getBoundsInRect: (rect: ILayoutRect, fullRect: ILayoutRect) => IBoundsLike;
+}
+
+```
+### Chart Module Obtaining Layout Information
+
+The chart module obtains the layout space information by holding `layoutItem`
+
+
+```xml
+// 下面是部分类型定义
+export interface ILayoutItem {
+ readonly type: string;
+ /**
+ * 标记这个布局Item的方向(left->right, right->left, top->bottom, bottom->top)
+ */
+ directionStr?: 'l2r' | 'r2l' | 't2b' | 'b2t';
+ layoutClip: boolean;
+ layoutType: ILayoutType;
+ layoutBindRegionID: number | number[];
+ layoutOrient: IOrientType;
+ /** 是否自动缩进 */
+ autoIndent: boolean;
+ alignSelf?: 'start' | 'end' | 'middle';
+ /** paddding */
+ layoutPaddingLeft: number;
+ layoutPaddingTop: number;
+ layoutPaddingRight: number;
+ layoutPaddingBottom: number;
+ /** offset */
+ layoutOffsetX: number;
+ layoutOffsetY: number;
+
+ /** 布局优先级,越大越先处理 */
+ layoutLevel: number;
+
+ getLayoutStartPoint: () => ILayoutPoint;
+ getLayoutRect: () => ILayoutRect;
+ }
+
+
+```
+# Chart Module
+
+The chart module will obtain layout information and update its own graphic position during the `onLayoutEnd` lifecycle.
+
+
+```Typescript
+// packages/vchart/src/model/layout-model.ts
+// line: 56
+onLayoutEnd(ctx: any): void {
+ super.onLayoutEnd(ctx);
+ // diff layoutRect
+ this.updateLayoutAttribute();
+ // ... other code
+ }
+
+```
+
+
+# Layout Logic
+
+In VChart, the definition of layout logic is actually just a function that receives layout elements and updates their layout properties.
+
+
+```xml
+// 类型定义
+export type LayoutCallBack = (
+ chart: any,
+ item: ILayoutItem[],
+ chartLayoutRect: IRect,
+ chartViewBox: IBoundsLike
+) => void;
+
+// VChart 通过接口 setLayout 设置自定义布局
+export interface IVChart {
+ /**
+ * 设置自定义布局
+ */
+ setLayout: (layout: LayoutCallBack) => void;
+ // other
+}
+
+```
+## Placeholder Layout
+
+The most commonly used layout logic is the method of placing layout elements on the canvas one by one according to type and priority.
+
+The calculation of placeholders is done by initializing the top, bottom, left, and right boundaries at the start of the layout, and then reducing the boundaries after each item is laid out, gradually narrowing the layoutable area.
+
+### **Initialization**
+
+
+```Typescript
+protected _layoutInit(_chart: IChart, items: ILayoutItem[], chartLayoutRect: IRect, chartViewBox: IBoundsLike) {
+ this._chartLayoutRect = chartLayoutRect;
+ this._chartViewBox = chartViewBox;
+ this.leftCurrent = chartLayoutRect.x;
+ this.topCurrent = chartLayoutRect.y;
+ this.rightCurrent = chartLayoutRect.x + chartLayoutRect.width;
+ this.bottomCurrent = chartLayoutRect.height + chartLayoutRect.y;
+
+ // 越大越先处理,进行排序调整,利用原地排序特性,排序会受 level 和传进来的数组顺序共同影响
+ items.sort((a, b) => b.layoutLevel - a.layoutLevel);
+}
+
+```
+### Layout Execution
+
+
+```xml
+// packages/vchart/src/layout/base-layout.ts
+
+// line: 91
+layoutItems(_chart: IChart, items: ILayoutItem[], chartLayoutRect: IRect, chartViewBox: IBoundsLike): void {
+ // 布局初始化
+ this._layoutInit(_chart, items, chartLayoutRect, chartViewBox);
+ // 先布局 normal 类型的元素
+ this._layoutNormalItems(items);
+ // 开始布局 region 相关元素
+ // 为了自动缩进能力先保存一下当前的布局空间
+ const layoutTemp: LayoutSideType = {
+ left: this.leftCurrent,
+ top: this.topCurrent,
+ right: this.rightCurrent,
+ bottom: this.bottomCurrent
+ };
+ // 将 reion 相关元素分组
+ const { regionItems, relativeItems, relativeOverlapItems, allRelatives,overlapItems } = this._groupItems(items);
+ // 有元素开启了自动缩进
+ // TODO:目前只有普通占位布局下的 region-relative 元素支持
+ // 主要考虑常规元素超出画布一般为用户个性设置,而且可以设置padding规避裁剪,不需要使用自动缩进
+ this.layoutRegionItems(regionItems, relativeItems, relativeOverlapItems, overlapItems);
+ // 缩进计算
+ this._processAutoIndent(regionItems, relativeItems, relativeOverlapItems, overlapItems, allRelatives, layoutTemp);
+ // 最后布局绝对定位元素
+ this.layoutAbsoluteItems(items.filter(x => x.layoutType === 'absolute'));
+ }
+
+```
+`item` placeholder: Below is the logic for a regular element placeholder. First, pass the current layout range to `item`. After `item` completes the layout, reduce the space in the corresponding direction.
+
+```Typescript
+protected layoutNormalItems(normalItems: ILayoutItem[]): void {
+ normalItems.forEach(item => {
+ const layoutRect = this.getItemComputeLayoutRect(item);
+ const rect = item.computeBoundsInRect(layoutRect);
+ item.setLayoutRect(rect);
+
+ if (item.layoutOrient === 'left') {
+ item.setLayoutStartPosition({
+ x: this.leftCurrent + item.layoutOffsetX + item.layoutPaddingLeft,
+ y: this.topCurrent + item.layoutOffsetY + item.layoutPaddingTop
+ });
+ this.leftCurrent += rect.width + item.layoutPaddingLeft + item.layoutPaddingRight;
+ } else if (item.layoutOrient === 'top') {
+ item.setLayoutStartPosition({
+ x: this.leftCurrent + item.layoutOffsetX + item.layoutPaddingLeft,
+ y: this.topCurrent + item.layoutOffsetY + item.layoutPaddingTop
+ });
+ this.topCurrent += rect.height + item.layoutPaddingTop + item.layoutPaddingBottom;
+ } else if (item.layoutOrient === 'right') {
+ item.setLayoutStartPosition({
+ x: this.rightCurrent + item.layoutOffsetX - rect.width - item.layoutPaddingRight,
+ y: this.topCurrent + item.layoutOffsetY + item.layoutPaddingTop
+ });
+ this.rightCurrent -= rect.width + item.layoutPaddingLeft + item.layoutPaddingRight;
+ } else if (item.layoutOrient === 'bottom') {
+ item.setLayoutStartPosition({
+ x: this.leftCurrent + item.layoutOffsetX + item.layoutPaddingRight,
+ y: this.bottomCurrent + item.layoutOffsetY - rect.height - item.layoutPaddingBottom
+ });
+ this.bottomCurrent -= rect.height + item.layoutPaddingTop + item.layoutPaddingBottom;
+ }
+ });
+ }
+
+```
+
+
+## Grid Layout
+
+The grid layout method is to first establish row and column layout information arrays according to the layout configuration and configuration items.
+
+### Initialization
+
+
+```Typescript
+// packages/vchart/src/layout/grid-layout/grid-layout.ts
+type GridSize = {
+ value: number;
+ isUserSetting: boolean;
+ isLayoutSetting: boolean;
+};
+
+export class GridLayout implements IBaseLayout {
+ // 行列信息
+ protected _col: number = 1;
+ protected _row: number = 1;
+ // 存储行列的大小和配置信息
+ protected _colSize: GridSize[];
+ protected _rowSize: GridSize[];
+
+ // 每一行,每一列都有一个数组存储它对应的布局 item
+ protected _colElements: ILayoutItem[][];
+ protected _rowElements: ILayoutItem[][];
+
+ constructor(gridInfo: IGridLayoutSpec, ctx: utilFunctionCtx) {
+ this.standardizationSpec(gridInfo);
+ this._gridInfo = gridInfo;
+ this._col = gridInfo.col;
+ this._row = gridInfo.row;
+ this._colSize = new Array(this._col).fill(null);
+ this._rowSize = new Array(this._row).fill(null);
+ this._colElements = new Array(this._col).fill([]);
+ this._rowElements = new Array(this._row).fill([]);
+ this._onError = ctx?.onError;
+
+ this.initUserSetting();
+ }
+
+ protected initUserSetting() {
+ // 先对用户设置的宽高进行设置
+ this._gridInfo.colWidth &&
+ this.setSizeFromUserSetting(this._gridInfo.colWidth, this._colSize, this._col, this._chartLayoutRect.width);
+
+ this._gridInfo.rowHeight &&
+ this.setSizeFromUserSetting(this._gridInfo.rowHeight, this._rowSize, this._row, this._chartLayoutRect.height);
+ // 其余位置默认填充0
+ this._colSize.forEach((c, i) => {
+ if (!c) {
+ this._colSize[i] = {
+ value: 0,
+ isUserSetting: false,
+ isLayoutSetting: false
+ };
+ }
+ });
+ this._rowSize.forEach((r, i) => {
+ if (!r) {
+ this._rowSize[i] = {
+ value: 0,
+ isUserSetting: false,
+ isLayoutSetting: false
+ };
+ }
+ });
+ }
+ // other
+}
+
+```
+### Layout Execution
+
+In grid layout, elements are placed into the layout information according to certain attributes, configured to their designated row and column positions. Then, in the order of columns first and rows second, each element undergoes layout calculation and is placed into the prepared row and column layout information.
+
+After the first column layout is completed, only the column width is determined, and then the row layout is performed. After the first round of layout is completed, the column elements undergo a second layout, allowing them to readjust their layout attributes based on the width. Only after this are all layout information finalized, and at this point, all elements are positioned once.
+
+```Typescript
+layoutItems(_chart: IChart, items: ILayoutItem[], chartLayoutRect: IRect, chartViewBox: IBoundsLike): void {
+ this._chartLayoutRect = chartLayoutRect;
+ this._chartViewBox = chartViewBox;
+ // 先清空旧布局信息
+ this.clearLayoutSize();
+ // 越大越先处理,进行排序调整,利用原地排序特性,排序会受 level 和传进来的数组顺序共同影响
+ items.sort((a, b) => b.layoutLevel - a.layoutLevel);
+
+ // 剔除 region 后,其余元素先布局运算
+ const normalItems = items.filter(item => item.layoutType === 'normal' && item.getModelVisible() !== false);
+ const normalItemsCol = normalItems.filter(item => isColItem(item));
+ const normalItemsRow = normalItems.filter(item => !isColItem(item));
+ normalItems.forEach(item => {
+ this.layoutOneItem(item, 'user', false);
+ });
+
+ // region 和 region 关联元素
+ const regionsRelative = items.filter(x => x.layoutType === 'region-relative');
+ const regionsRelativeCol = regionsRelative.filter(item => isColItem(item));
+ const regionsRelativeRow = regionsRelative.filter(item => !isColItem(item));
+ // 先进行 col 方向布局
+ regionsRelativeCol.forEach(item => this.layoutOneItem(item, 'user', false));
+ // 然后得到最终 col 信息 此时已经是最终 col 信息
+ this.layoutGrid('col');
+ // 再使用宽度信息辅助row方向排序
+ // 此时普通占位元素,会因为布局宽度影响最终布局高度
+ normalItemsRow.forEach(item => this.layoutOneItem(item, 'colGrid', false));
+ regionsRelativeRow.forEach(item => {
+ this.layoutOneItem(item, 'colGrid', false);
+ });
+ // 然后得到最终 row 信息
+ this.layoutGrid('row');
+ // 统一水平方向元素高度
+ regionsRelativeRow.forEach(item => {
+ this.layoutOneItem(item, 'grid', false);
+ });
+ // 再使用宽度信息,第二次次对 col 方向布局
+ normalItemsCol.forEach(item => this.layoutOneItem(item, 'grid', false));
+ regionsRelativeCol.forEach(item => {
+ // 此时从布局逻辑可知,item的layoutRect会发生,将item的layoutTag设置为true
+ this.layoutOneItem(item, 'grid', true);
+ });
+ this.layoutGrid('col');
+
+ // region
+ items.filter(x => x.layoutType === 'region').forEach(item => this.layoutOneItem(item, 'grid', false));
+
+ // 再找出 absolute 元素,无需排序,在 compiler 层需要排序放置
+ this.layoutAbsoluteItems(items.filter(x => x.layoutType === 'absolute'));
+
+ // 最后基于grid 设置位置
+ items
+ .filter(x => x.layoutType !== 'absolute')
+ .forEach(item => {
+ item.setLayoutStartPosition(this.getItemPosition(item));
+ });
+ }
+
+```
+The layout logic of a single element remains consistent, using the same method \r\n\r
+```Typescript
+protected layoutOneItem(item: ILayoutItem, sizeType: 'user' | 'grid' | 'colGrid' | 'rowGrid', ignoreTag: boolean) {
+ const sizeCallRow =
+ sizeType === 'rowGrid' || sizeType === 'grid' ? this.getSizeFromGrid.bind(this) : this.getSizeFromUser.bind(this);
+ const sizeCallCol =
+ sizeType === 'colGrid' || sizeType === 'grid' ? this.getSizeFromGrid.bind(this) : this.getSizeFromUser.bind(this);
+ // 先获取 item 的 grid 信息
+ const gridSpec = this.getItemGridInfo(item);
+ // 设置空间
+ const computeRect = {
+ width:
+ (sizeCallCol(gridSpec, 'col') ?? this._chartLayoutRect.width) -
+ item.layoutPaddingLeft -
+ item.layoutPaddingRight,
+ height:
+ (sizeCallRow(gridSpec, 'row') ?? this._chartLayoutRect.height) -
+ item.layoutPaddingTop -
+ item.layoutPaddingBottom
+ };
+ // 计算尺寸
+ const rect = item.computeBoundsInRect(computeRect);
+ if (!isValidNumber(rect.width)) {
+ rect.width = computeRect.width;
+ }
+ if (!isValidNumber(rect.height)) {
+ rect.height = computeRect.height;
+ }
+ // 更新最终尺寸
+ item.setLayoutRect(sizeType !== 'grid' ? rect : computeRect);
+ // 设置大小到grid
+ this.setItemLayoutSizeToGrid(item, gridSpec);
+ }
+}
+
+```
+# This document was revised and organized by the following person \r\n [玄魂](https://github.com/xuanhun)
\ No newline at end of file
diff --git a/docs/assets/contributing/menu.json b/docs/assets/contributing/menu.json
index 6229069988..1f02e3f180 100644
--- a/docs/assets/contributing/menu.json
+++ b/docs/assets/contributing/menu.json
@@ -42,6 +42,267 @@
"zh": "6.如何上传图片",
"en": "6-How to upload images"
}
+ },
+ {
+ "path": "sourcecode",
+ "title": {
+ "zh": "源代码分析",
+ "en": "Source Code Analysis"
+ },
+ "children": [
+ {
+ "path": "0-vchart-engineering",
+ "title": {
+ "zh": "VChart 工程化",
+ "en": "VChart Engineering"
+ }
+ },
+ {
+ "path": "1-vchart-basic-principles",
+ "title": {
+ "zh": "VChart 基本原理",
+ "en": "VChart Basic Principles"
+ }
+ },
+ {
+ "path": "3-how-to-assemble-a-vchart",
+ "title": {
+ "zh": "如何组装一个 VChart",
+ "en": "How to Assemble a VChart"
+ }
+ },
+ {
+ "path": "6.1-primitive-basic-concepts",
+ "title": {
+ "zh": "图元基础概念",
+ "en": "Primitive Basic Concepts"
+ }
+ },
+ {
+ "path": "6.2-visual-channel-mapping",
+ "title": {
+ "zh": "视觉通道映射",
+ "en": "Visual Channel Mapping"
+ }
+ },
+ {
+ "path": "6.3-primitive-interaction-and-state-handling",
+ "title": {
+ "zh": "图元交互与状态处理",
+ "en": "Primitive Interaction and State Handling"
+ }
+ },
+ {
+ "path": "6.4-custom-primitives",
+ "title": {
+ "zh": "自定义图元",
+ "en": "Custom Primitives"
+ }
+ },
+ {
+ "path": "9.1-vchart-layout-basic-concepts",
+ "title": {
+ "zh": "VChart 布局基础概念",
+ "en": "VChart Layout Basic Concepts"
+ }
+ },
+ {
+ "path": "9.2-vchart-layout-source-code-analysis",
+ "title": {
+ "zh": "VChart 布局源码分析",
+ "en": "VChart Layout Source Code Analysis"
+ }
+ },
+ {
+ "path": "10.1-animation-concepts-and-types",
+ "title": {
+ "zh": "动画概念与类型",
+ "en": "Animation Concepts and Types"
+ }
+ },
+ {
+ "path": "10.2-global-morphing-animation",
+ "title": {
+ "zh": "全局变形动画",
+ "en": "Global Morphing Animation"
+ }
+ },
+ {
+ "path": "10.3-state-change-animation",
+ "title": {
+ "zh": "状态变更动画",
+ "en": "State Change Animation"
+ }
+ },
+ {
+ "path": "10.4-data-update-animation",
+ "title": {
+ "zh": "数据更新动画",
+ "en": "Data Update Animation"
+ }
+ },
+ {
+ "path": "10.5-animation-orchestration",
+ "title": {
+ "zh": "动画编排",
+ "en": "Animation Orchestration"
+ }
+ },
+ {
+ "path": "11.1-theme-configuration-parsing-logic",
+ "title": {
+ "zh": "主题配置解析逻辑",
+ "en": "Theme Configuration Parsing Logic"
+ }
+ },
+ {
+ "path": "11.2-theme-update-source-code-analysis",
+ "title": {
+ "zh": "主题更新源码分析",
+ "en": "Theme Update Source Code Analysis"
+ }
+ },
+ {
+ "path": "12.1-vchart-plugin-mechanism",
+ "title": {
+ "zh": "VChart 插件机制",
+ "en": "VChart Plugin Mechanism"
+ }
+ },
+ {
+ "path": "12.2-vchart-plugin-feature-source-code-analysis",
+ "title": {
+ "zh": "VChart 插件功能源码分析",
+ "en": "VChart Plugin Feature Source Code Analysis"
+ }
+ },
+ {
+ "path": "13.1-vchart-on-demand-loading-mechanism",
+ "title": {
+ "zh": "VChart 按需加载机制",
+ "en": "VChart On-demand Loading Mechanism"
+ }
+ },
+ {
+ "path": "13.2-vchart-on-demand-loading-source-code-analysis",
+ "title": {
+ "zh": "VChart 按需加载源码分析",
+ "en": "VChart On-demand Loading Source Code Analysis"
+ }
+ },
+ {
+ "path": "14.1.1-react-vchart-introduction",
+ "title": {
+ "zh": "React VChart 介绍",
+ "en": "React VChart Introduction"
+ }
+ },
+ {
+ "path": "14.1.2-react-vchart-source-code-analysis",
+ "title": {
+ "zh": "React VChart 源码分析",
+ "en": "React VChart Source Code Analysis"
+ }
+ },
+ {
+ "path": "14.2.1-taro-vchart-introduction",
+ "title": {
+ "zh": "Taro VChart 介绍",
+ "en": "Taro VChart Introduction"
+ }
+ },
+ {
+ "path": "14.2.2-taro-vchart-source-code-analysis",
+ "title": {
+ "zh": "Taro VChart 源码分析",
+ "en": "Taro VChart Source Code Analysis"
+ }
+ },
+ {
+ "path": "14.3.1-lark-vchart-introduction",
+ "title": {
+ "zh": "Lark VChart 介绍",
+ "en": "Lark VChart Introduction"
+ }
+ },
+ {
+ "path": "14.3.2-lark-vchart-source-code-analysis",
+ "title": {
+ "zh": "Lark VChart 源码分析",
+ "en": "Lark VChart Source Code Analysis"
+ }
+ },
+ {
+ "path": "14.4.1-tt-vchart-introduction",
+ "title": {
+ "zh": "TT VChart 介绍",
+ "en": "TT VChart Introduction"
+ }
+ },
+ {
+ "path": "14.4.2-tt-vchart-source-code-analysis",
+ "title": {
+ "zh": "TT VChart 源码分析",
+ "en": "TT VChart Source Code Analysis"
+ }
+ },
+ {
+ "path": "14.5.1-wx-vchart-introduction",
+ "title": {
+ "zh": "WX VChart 介绍",
+ "en": "WX VChart Introduction"
+ }
+ },
+ {
+ "path": "14.5.2-wx-vchart-source-code-analysis",
+ "title": {
+ "zh": "WX VChart 源码分析",
+ "en": "WX VChart Source Code Analysis"
+ }
+ },
+ {
+ "path": "14.6.1-openinula-vchart-introduction",
+ "title": {
+ "zh": "OpenInula VChart 介绍",
+ "en": "OpenInula VChart Introduction"
+ }
+ },
+ {
+ "path": "14.6.2-openinula-vchart-source-code-analysis",
+ "title": {
+ "zh": "OpenInula VChart 源码分析",
+ "en": "OpenInula VChart Source Code Analysis"
+ }
+ },
+ {
+ "path": "14.7.1-harmony-vchart-introduction",
+ "title": {
+ "zh": "Harmony VChart 介绍",
+ "en": "Harmony VChart Introduction"
+ }
+ },
+ {
+ "path": "14.7.2-harmony-vchart-source-code-analysis",
+ "title": {
+ "zh": "Harmony VChart 源码分析",
+ "en": "Harmony VChart Source Code Analysis"
+ }
+ },
+ {
+ "path": "14.8.1-vchart-svg-plugin-introduction",
+ "title": {
+ "zh": "VChart SVG 插件介绍",
+ "en": "VChart SVG Plugin Introduction"
+ }
+ },
+ {
+ "path": "14.8.2-vchart-svg-plugin-source-code-analysis",
+ "title": {
+ "zh": "VChart SVG 插件源码分析",
+ "en": "VChart SVG Plugin Source Code Analysis"
+ }
+ }
+ ]
}
]
}
\ No newline at end of file
diff --git a/docs/assets/contributing/zh/sourcesode/0-vchart-engineering.md b/docs/assets/contributing/zh/sourcesode/0-vchart-engineering.md
new file mode 100644
index 0000000000..f6fdfc378b
--- /dev/null
+++ b/docs/assets/contributing/zh/sourcesode/0-vchart-engineering.md
@@ -0,0 +1,193 @@
+---
+title: 0 VChart 工程化
+
+key words: VisActor,VChart,VTable,VStrory,VMind,VGrammar,VRender,Visualization,Chart,Data,Table,Graph,Gis,LLM
+---
+# 0.1 启动 demo
+
+## 0.1.1 Fork 项目
+
+在 Github 上,你需要 Fork VChart 项目。
+
+ +
+## 0.1.2 克隆项目
+
+在你 fork 的仓库中,点击 `Code` 按钮,复制项目地址。然后使用 git clone 命令克隆项目到本地。例如:
+
+```bash
+git clone https://github.com/your-username/VChart.git
+
+```
+克隆完毕后需要添加 VChart 的远程地址。
+
+```bash
+git remote add upstream https://github.com/VisActor/VChart.git
+
+```
+这样以后你就可以从 VChart 的远程地址获取最新的源码。
+
+```bash
+git pull upstream develop
+
+```
+## 0.1.3 启动 demo
+
+我们是用 [@microsoft/rush](https://rushjs.io/) 来管理 monorepo。所以先安装 rush。
+
+```bash
+npm install -g @microsoft/rush
+
+```
+接下来执行命令启动 demo。
+
+```typescript
+*安装依赖*
+$ rush update
+*启动 vchart 的demo页*
+$ rush start
+*启动 react-vchart 的demo页*
+$ rush react
+*启动本地文档站点*
+$ rush docs
+
+```
+## 0.1.4 启动 demo 的时候发生了什么?
+
+当你运行 `rush start` 的时候,会启动 vchart 的 demo 页。可是具体发生了什么呢?
+
+首先我们在 `command-line.json` 中配置了 `start` 命令:
+
+```json
+{"commandKind": "global","name": "start","summary": "Start the development server","description": "Run this command to start vchart development server","shellCommand": "rush run -p @visactor/vchart -s start"},
+
+```
+所以我们得知 start 命令会执行 `rush run -p @visactor/vchart -s start` 命令。
+
+让我详细解释 `rush run -p @visactor/vchart -s start` 这个命令:
+
+这是一个 Rush 工具的命令,可以拆解为以下几个部分:
+
+1. `rush run`:Rush 的子命令,用于在 monorepo 中运行特定项目的 npm 脚本
+
+1. `-p @visactor/vchart`:`-p` 或 `--project` 参数,指定要运行脚本的项目名称,这里指定的是 @visactor/vchart 项目
+
+1. `-s start`:`-s` 或 `--script` 参数,指定要运行的 npm 脚本名称,这里要运行的是 start 脚本
+
+根据代码库,我们可以看到这个命令最终会执行 @visactor/vchart 包中 package.json 定义的 start 脚本:
+
+```bash
+ts-node __tests__/runtime/browser/scripts/initVite.ts && vite serve __tests__/runtime/browser
+
+```
+这个命令前半部分是运行初始化脚本 `initVite.ts`,它的主要作用是生成 local 版本的 `vite.config.local.ts` 和 `index.page.local.ts` 文件,这两个文件是被 git 忽略的,用于本地开发的配置,后面会详细讲到。
+
+后半部分的脚本 `vite serve __tests__/runtime/browser`是启动 demo 网页。
+
+## 0.1.5 如何使用 `index.page.local.ts`
+
+该文件的默认内容为
+
+```xml
+import './test-page/area';
+
+```
+笼统的来说,它可以用来指定启动不同的 chart 页面。实际上它就是会运行不同文件的 VChart 表格生成代码,来达到网页启动不同的 chart 页面的效果。所以你只要 import 不同的文件,就可以启动不同的 chart 页面。
+
+## 0.1.6 如何使用 `vite.config.local.ts`
+
+这个文件主要用来配置端口和本地包。比如下面的配置:
+
+```xml
+export default {
+ *// 启动端口*port: 4000,
+ resolve: {
+ alias: {
+ '@visactor/vgrammar-core': '/path/to/visactor/VGrammar/packages/vgrammar-core/src/index.ts',
+ '@visactor/vgrammar-util': '/path/to/visactor/VGrammar/packages/vgrammar-util/src/index.ts',
+ '@visactor/vgrammar-wordcloud': '/path/to/visactor/VGrammar/packages/vgrammar-wordcloud/src/index.ts',
+ '@visactor/vgrammar-wordcloud-shape': '/path/to/visactor/VGrammar/packages/vgrammar-wordcloud-shape/src/index.ts',
+ '@visactor/vgrammar-sankey': '/path/to/visactor/VGrammar/packages/vgrammar-sankey/src/index.ts',
+ '@visactor/vgrammar-hierarchy': '/path/to/visactor/VGrammar/packages/vgrammar-hierarchy/src/index.ts',
+ '@visactor/vgrammar-projection': '/path/to/visactor/VGrammar/packages/vgrammar-projection/src/index.ts',
+ '@visactor/vgrammar-coordinate': '/path/to/visactor/VGrammar/packages/vgrammar-coordinate/src/index.ts',
+ '@visactor/vgrammar-venn': '/path/to/visactor/VGrammar/packages/vgrammar-venn/src/index.ts',
+ '@visactor/vscale': '/path/to/visactor/VUtil/packages/vscale/src/index.ts',
+ '@visactor/vdataset': '/path/to/visactor/VUtil/packages/vdataset/src/index.ts',
+ '@visactor/vutils': '/path/to/visactor/VUtil/packages/vutils/src/index.ts',
+ '@visactor/vrender-core': '/path/to/visactor/VRender/packages/vrender-core/src/index.ts',
+ '@visactor/vrender-kits': '/path/to/visactor/VRender/packages/vrender-kits/src/index.ts',
+ '@visactor/vrender-components': '/path/to/visactor/VRender/packages/vrender-components/src/index.ts'
+ }
+ }
+};
+
+```
+它把启动端口配置为 4000,并且配置了一系列的本地包,这样你的 VChart 在调试时会依赖这些本地包,你对上游本地包的改动会实时生效,方便调试一些和上游有关的 bug,如果你不需要这个功能,去掉这些配置即可。
+
+# 0.2 VChart 工程化详解
+
+## 0.2.1 项目结构
+
+VChart 是一个使用 Rush 管理的 monorepo 项目,主要包含以下几个部分:
+
+核心包:
+
+1. @visactor/vchart - 核心图表库
+
+1. @visactor/react-vchart - React 封装
+
+1. @visactor/openinula-vchart - OpenInula 封装
+
+1. @visactor/taro-vchart - Taro 封装
+
+1. @visactor/lark-vchart - 飞书封装
+
+1. @visactor/wx-vchart - 微信小程序封装
+
+1. @visactor/vchart-schema - 图表配置 Schema
+
+1. @visactor/vchart-types - TypeScript 类型定义
+
+1. @visactor/vutils-extension - 工具函数扩展
+
+1. @visactor/tt-vchart - 字节小程序封装
+
+工具包:
+
+1. @internal/bundler - 打包工具
+
+1. @internal/typescript-json-schema - TypeScript 类型定义生成工具
+
+1. @internal/story-player - 故事播放器
+
+1. @internal/bugserver-trigger - Bug 服务触发器
+
+## 0.2.2 文档系统
+
+文档的内容都存储在 `docs/assets` 文件夹下,比如包含:
+
+* API 文档
+
+* 示例代码
+
+* 教程文档
+
+* 配置项文档
+
+* 主题文档
+
+## 0.2.3 开发命令
+
+* rush update - 安装依赖
+
+* rush start - 启动 vchart 开发服务
+
+* rush react - 启动 react-vchart 开发服务
+
+* rush docs - 启动文档开发服务
+
+
+
+ # 本文档由以下人员修正整理
+ [玄魂](https://github.com/xuanhun)
\ No newline at end of file
diff --git a/docs/assets/contributing/zh/sourcesode/1-vchart-basic-principles.md b/docs/assets/contributing/zh/sourcesode/1-vchart-basic-principles.md
new file mode 100644
index 0000000000..3bc83ef03b
--- /dev/null
+++ b/docs/assets/contributing/zh/sourcesode/1-vchart-basic-principles.md
@@ -0,0 +1,437 @@
+---
+title: 1 VChart 基本原理
+
+key words: VisActor,VChart,VTable,VStrory,VMind,VGrammar,VRender,Visualization,Chart,Data,Table,Graph,Gis,LLM
+---
+# 1.1 图表组成
+
+## 术语
+
+1. Mark:基本图形元素(基本图元),如线、点、矩形等
+
+1. Series:负责特定类型数据的可视化表达,包含一组图元及其对应的图表逻辑,比如折线图中的一系列线
+
+1. Region:定义图表的空间区域,关联一组或多组 series,处理交互和动画,提供坐标系统
+
+1. Component:组件,帮助图表阅读和交互的元素,如图例、坐标轴、提示等
+
+1. Layout:管理图表的布局,包括 region 和 component 的位置和大小
+
+1. Chart:整个图表的抽象概念,包含视图上的元素比如 layout,component 和 region,也包含数据等所有构成一个表格需要的元素
+
+## 结构关系
+
+
+
+## 0.1.2 克隆项目
+
+在你 fork 的仓库中,点击 `Code` 按钮,复制项目地址。然后使用 git clone 命令克隆项目到本地。例如:
+
+```bash
+git clone https://github.com/your-username/VChart.git
+
+```
+克隆完毕后需要添加 VChart 的远程地址。
+
+```bash
+git remote add upstream https://github.com/VisActor/VChart.git
+
+```
+这样以后你就可以从 VChart 的远程地址获取最新的源码。
+
+```bash
+git pull upstream develop
+
+```
+## 0.1.3 启动 demo
+
+我们是用 [@microsoft/rush](https://rushjs.io/) 来管理 monorepo。所以先安装 rush。
+
+```bash
+npm install -g @microsoft/rush
+
+```
+接下来执行命令启动 demo。
+
+```typescript
+*安装依赖*
+$ rush update
+*启动 vchart 的demo页*
+$ rush start
+*启动 react-vchart 的demo页*
+$ rush react
+*启动本地文档站点*
+$ rush docs
+
+```
+## 0.1.4 启动 demo 的时候发生了什么?
+
+当你运行 `rush start` 的时候,会启动 vchart 的 demo 页。可是具体发生了什么呢?
+
+首先我们在 `command-line.json` 中配置了 `start` 命令:
+
+```json
+{"commandKind": "global","name": "start","summary": "Start the development server","description": "Run this command to start vchart development server","shellCommand": "rush run -p @visactor/vchart -s start"},
+
+```
+所以我们得知 start 命令会执行 `rush run -p @visactor/vchart -s start` 命令。
+
+让我详细解释 `rush run -p @visactor/vchart -s start` 这个命令:
+
+这是一个 Rush 工具的命令,可以拆解为以下几个部分:
+
+1. `rush run`:Rush 的子命令,用于在 monorepo 中运行特定项目的 npm 脚本
+
+1. `-p @visactor/vchart`:`-p` 或 `--project` 参数,指定要运行脚本的项目名称,这里指定的是 @visactor/vchart 项目
+
+1. `-s start`:`-s` 或 `--script` 参数,指定要运行的 npm 脚本名称,这里要运行的是 start 脚本
+
+根据代码库,我们可以看到这个命令最终会执行 @visactor/vchart 包中 package.json 定义的 start 脚本:
+
+```bash
+ts-node __tests__/runtime/browser/scripts/initVite.ts && vite serve __tests__/runtime/browser
+
+```
+这个命令前半部分是运行初始化脚本 `initVite.ts`,它的主要作用是生成 local 版本的 `vite.config.local.ts` 和 `index.page.local.ts` 文件,这两个文件是被 git 忽略的,用于本地开发的配置,后面会详细讲到。
+
+后半部分的脚本 `vite serve __tests__/runtime/browser`是启动 demo 网页。
+
+## 0.1.5 如何使用 `index.page.local.ts`
+
+该文件的默认内容为
+
+```xml
+import './test-page/area';
+
+```
+笼统的来说,它可以用来指定启动不同的 chart 页面。实际上它就是会运行不同文件的 VChart 表格生成代码,来达到网页启动不同的 chart 页面的效果。所以你只要 import 不同的文件,就可以启动不同的 chart 页面。
+
+## 0.1.6 如何使用 `vite.config.local.ts`
+
+这个文件主要用来配置端口和本地包。比如下面的配置:
+
+```xml
+export default {
+ *// 启动端口*port: 4000,
+ resolve: {
+ alias: {
+ '@visactor/vgrammar-core': '/path/to/visactor/VGrammar/packages/vgrammar-core/src/index.ts',
+ '@visactor/vgrammar-util': '/path/to/visactor/VGrammar/packages/vgrammar-util/src/index.ts',
+ '@visactor/vgrammar-wordcloud': '/path/to/visactor/VGrammar/packages/vgrammar-wordcloud/src/index.ts',
+ '@visactor/vgrammar-wordcloud-shape': '/path/to/visactor/VGrammar/packages/vgrammar-wordcloud-shape/src/index.ts',
+ '@visactor/vgrammar-sankey': '/path/to/visactor/VGrammar/packages/vgrammar-sankey/src/index.ts',
+ '@visactor/vgrammar-hierarchy': '/path/to/visactor/VGrammar/packages/vgrammar-hierarchy/src/index.ts',
+ '@visactor/vgrammar-projection': '/path/to/visactor/VGrammar/packages/vgrammar-projection/src/index.ts',
+ '@visactor/vgrammar-coordinate': '/path/to/visactor/VGrammar/packages/vgrammar-coordinate/src/index.ts',
+ '@visactor/vgrammar-venn': '/path/to/visactor/VGrammar/packages/vgrammar-venn/src/index.ts',
+ '@visactor/vscale': '/path/to/visactor/VUtil/packages/vscale/src/index.ts',
+ '@visactor/vdataset': '/path/to/visactor/VUtil/packages/vdataset/src/index.ts',
+ '@visactor/vutils': '/path/to/visactor/VUtil/packages/vutils/src/index.ts',
+ '@visactor/vrender-core': '/path/to/visactor/VRender/packages/vrender-core/src/index.ts',
+ '@visactor/vrender-kits': '/path/to/visactor/VRender/packages/vrender-kits/src/index.ts',
+ '@visactor/vrender-components': '/path/to/visactor/VRender/packages/vrender-components/src/index.ts'
+ }
+ }
+};
+
+```
+它把启动端口配置为 4000,并且配置了一系列的本地包,这样你的 VChart 在调试时会依赖这些本地包,你对上游本地包的改动会实时生效,方便调试一些和上游有关的 bug,如果你不需要这个功能,去掉这些配置即可。
+
+# 0.2 VChart 工程化详解
+
+## 0.2.1 项目结构
+
+VChart 是一个使用 Rush 管理的 monorepo 项目,主要包含以下几个部分:
+
+核心包:
+
+1. @visactor/vchart - 核心图表库
+
+1. @visactor/react-vchart - React 封装
+
+1. @visactor/openinula-vchart - OpenInula 封装
+
+1. @visactor/taro-vchart - Taro 封装
+
+1. @visactor/lark-vchart - 飞书封装
+
+1. @visactor/wx-vchart - 微信小程序封装
+
+1. @visactor/vchart-schema - 图表配置 Schema
+
+1. @visactor/vchart-types - TypeScript 类型定义
+
+1. @visactor/vutils-extension - 工具函数扩展
+
+1. @visactor/tt-vchart - 字节小程序封装
+
+工具包:
+
+1. @internal/bundler - 打包工具
+
+1. @internal/typescript-json-schema - TypeScript 类型定义生成工具
+
+1. @internal/story-player - 故事播放器
+
+1. @internal/bugserver-trigger - Bug 服务触发器
+
+## 0.2.2 文档系统
+
+文档的内容都存储在 `docs/assets` 文件夹下,比如包含:
+
+* API 文档
+
+* 示例代码
+
+* 教程文档
+
+* 配置项文档
+
+* 主题文档
+
+## 0.2.3 开发命令
+
+* rush update - 安装依赖
+
+* rush start - 启动 vchart 开发服务
+
+* rush react - 启动 react-vchart 开发服务
+
+* rush docs - 启动文档开发服务
+
+
+
+ # 本文档由以下人员修正整理
+ [玄魂](https://github.com/xuanhun)
\ No newline at end of file
diff --git a/docs/assets/contributing/zh/sourcesode/1-vchart-basic-principles.md b/docs/assets/contributing/zh/sourcesode/1-vchart-basic-principles.md
new file mode 100644
index 0000000000..3bc83ef03b
--- /dev/null
+++ b/docs/assets/contributing/zh/sourcesode/1-vchart-basic-principles.md
@@ -0,0 +1,437 @@
+---
+title: 1 VChart 基本原理
+
+key words: VisActor,VChart,VTable,VStrory,VMind,VGrammar,VRender,Visualization,Chart,Data,Table,Graph,Gis,LLM
+---
+# 1.1 图表组成
+
+## 术语
+
+1. Mark:基本图形元素(基本图元),如线、点、矩形等
+
+1. Series:负责特定类型数据的可视化表达,包含一组图元及其对应的图表逻辑,比如折线图中的一系列线
+
+1. Region:定义图表的空间区域,关联一组或多组 series,处理交互和动画,提供坐标系统
+
+1. Component:组件,帮助图表阅读和交互的元素,如图例、坐标轴、提示等
+
+1. Layout:管理图表的布局,包括 region 和 component 的位置和大小
+
+1. Chart:整个图表的抽象概念,包含视图上的元素比如 layout,component 和 region,也包含数据等所有构成一个表格需要的元素
+
+## 结构关系
+
+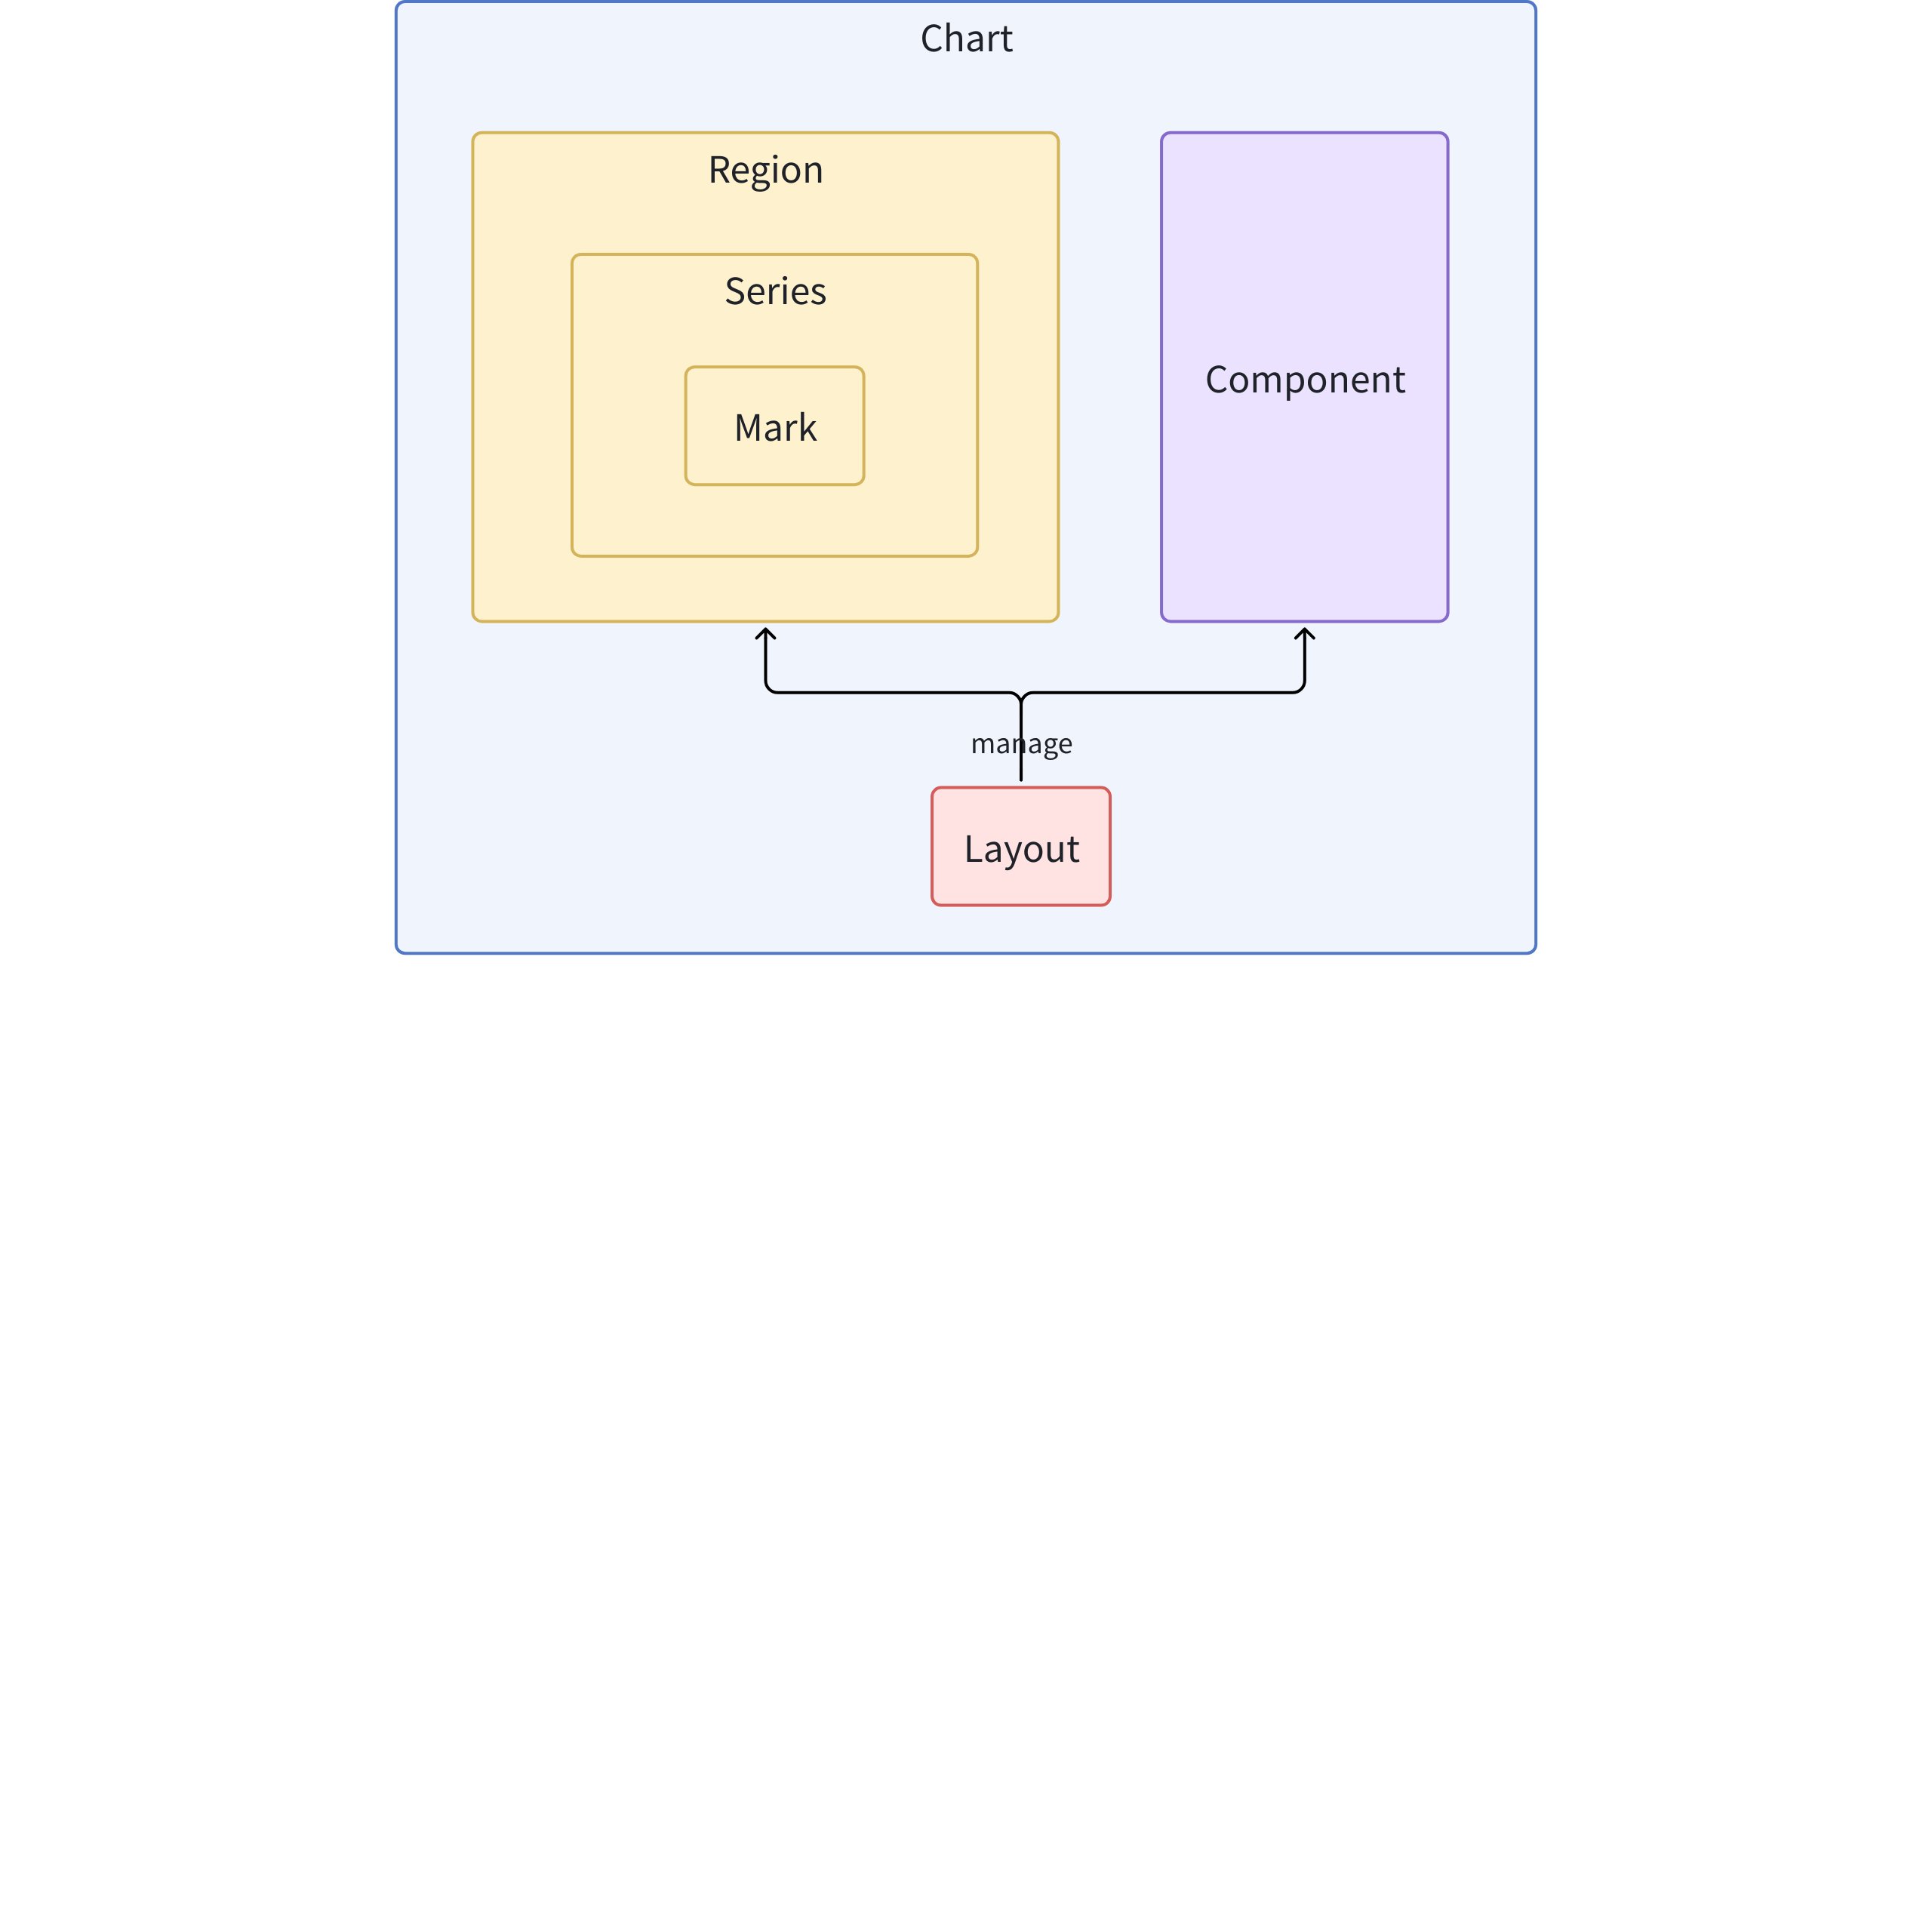 +
+## 简单图表例子
+
+
+
+## 简单图表例子
+
+ +
+## 组合图表例子
+
+### 同一个 Region
+
+
+
+## 组合图表例子
+
+### 同一个 Region
+
+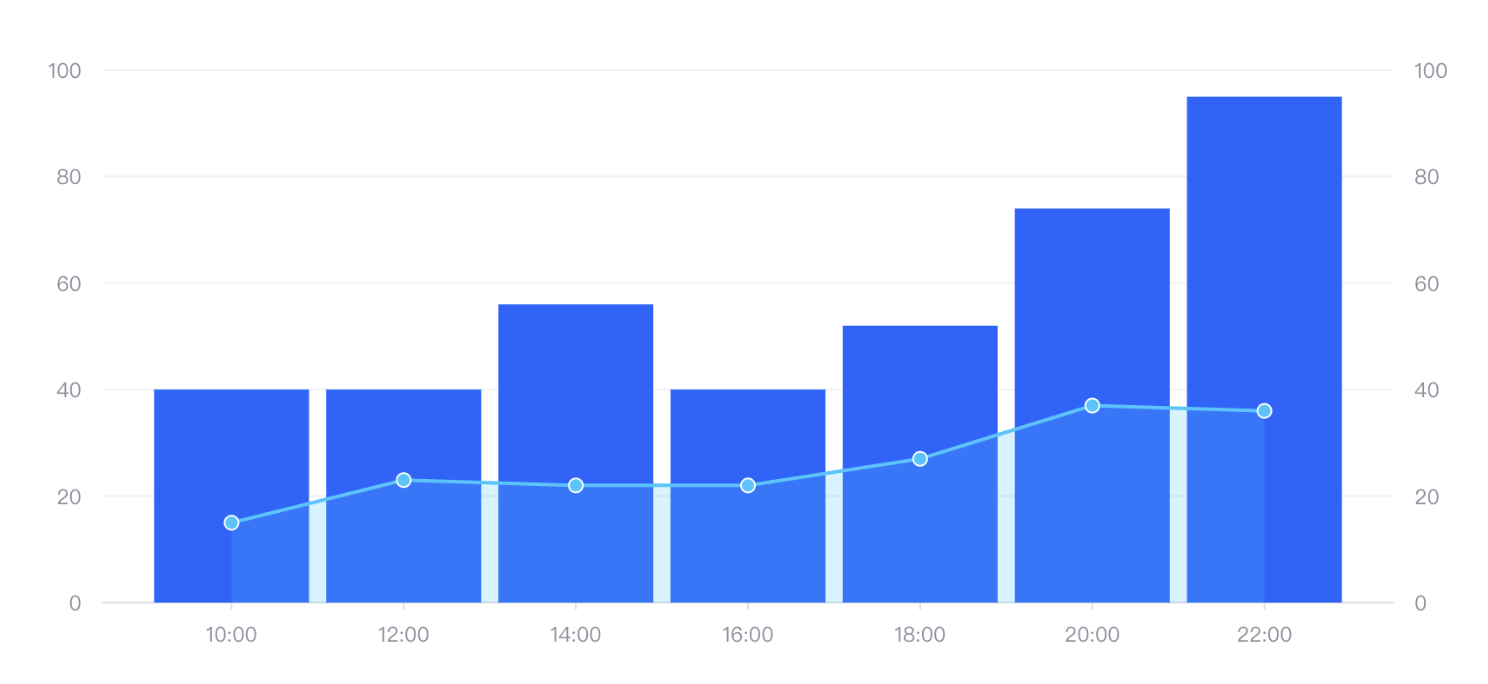 +
+上图是一个组合图,简单来说就是有多组 series,上面是 bar 和 line 这两组 series。
+
+1. 如果我们没有特别配置,所有 series 都会关联在一个 region,所以他们会重叠在一起,并且共享某些坐标
+
+1. 每个系列可以有自己的数据源,也可以直接将数据源配置在 chart 上,series 中通过 `fromDataId` 或者 `fromDataIndex` 来关联,当前的例子我们选择配置在 chart 上
+
+### 不同 Region
+
+
+
+上图是一个组合图,简单来说就是有多组 series,上面是 bar 和 line 这两组 series。
+
+1. 如果我们没有特别配置,所有 series 都会关联在一个 region,所以他们会重叠在一起,并且共享某些坐标
+
+1. 每个系列可以有自己的数据源,也可以直接将数据源配置在 chart 上,series 中通过 `fromDataId` 或者 `fromDataIndex` 来关联,当前的例子我们选择配置在 chart 上
+
+### 不同 Region
+
+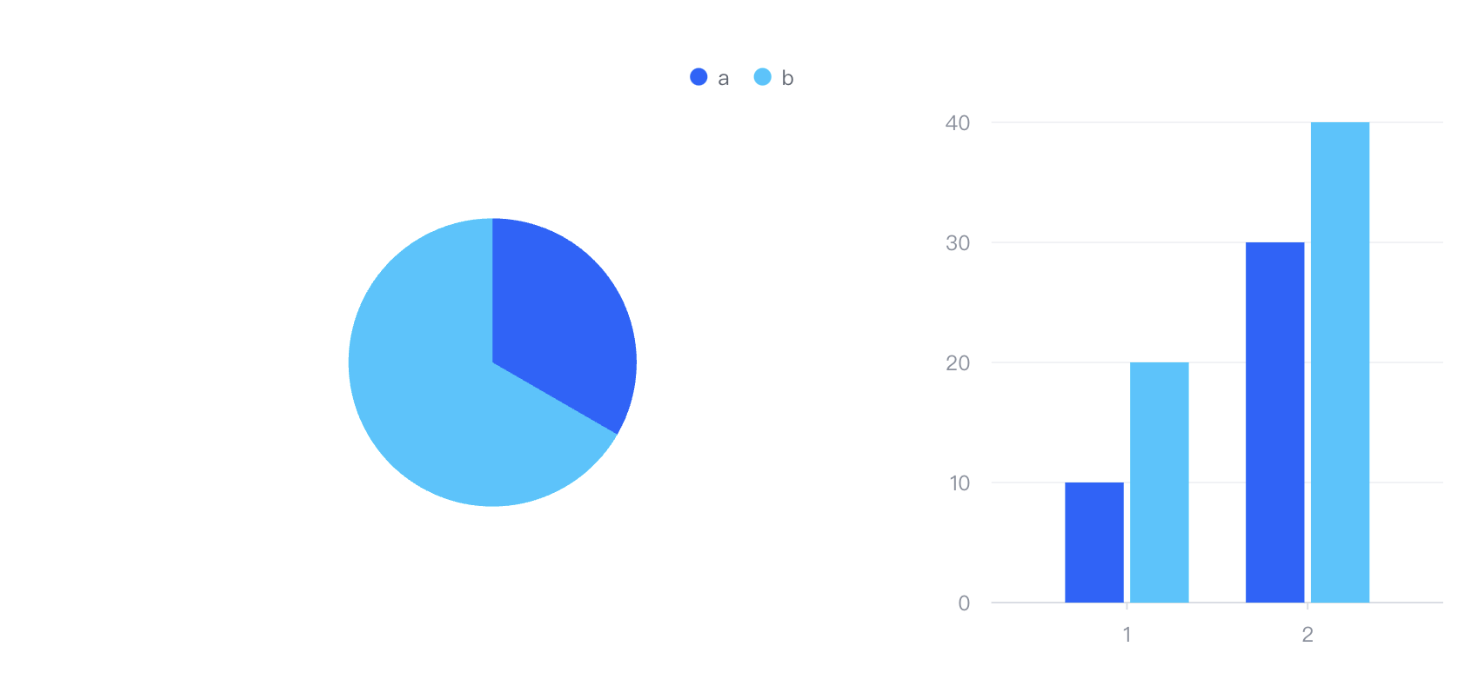 +
+在这个例子中,也是一个组合图,但是他的两组 series 出现在了不同的 region。如上文所说,我们用 layout 管理 region 的布局,在这个例子中,我们使用了如下代码:
+
+```Typescript
+ layout: {
+ type: 'grid',
+ col: 4,
+ row: 3,
+ elements: [
+ {
+ modelId: 'legend',
+ col: 0,
+ colSpan: 4,
+ row: 0
+ },
+ {
+ modelId: 'pie-region',
+ col: 0,
+ colSpan: 2,
+ row: 1
+ },
+ {
+ modelId: 'axis-left',
+ col: 2,
+ row: 1
+ },
+ {
+ modelId: 'bar-region',
+ col: 3,
+ row: 1
+ },
+ {
+ modelId: 'axis-bottom',
+ col: 3,
+ row: 2
+ }
+ ]
+ },
+
+```
+上面通过了类似于 grid 的方式来管理 region 和 component 的布局。我们使用这些 `modelId` 来关联对应 region 和 component 的配置:
+
+```Typescript
+ region: [
+ {
+ id: 'pie-region'
+ },
+ {
+ id: 'bar-region'
+ }
+ ],
+ axes: [
+ {
+ id: 'axis-left',
+ regionId: 'bar-region',
+ orient: 'left'
+ },
+ {
+ id: 'axis-bottom',
+ regionId: 'bar-region',
+ orient: 'bottom'
+ }
+ ]
+
+```
+# 1.2 VChart 架构与源码结构
+
+## 1.2.1 VChart, VGrammar 和 VRender 的关系
+
+这三者是 VisActor 可视化系统中的三个核心组件,它们的关系是层次化的,从底层到上层分别是:
+
+### VRender(底层)
+
+VRender 是一个底层的可视化渲染引擎,负责最基本的图形绘制和渲染工作:
+
+* 它提供了丰富的可视化渲染功能,包括自定义动画、元素组合和叙事排列
+
+* 它是 VisActor 可视化系统的基础,为上层库提供渲染能力
+
+* VRender 提供插件系统,可以灵活扩展
+
+* 它可以在 2D/3D 效果之间无缝切换
+
+* 它负责底层的 Canvas 操作、图形绘制、场景管理等
+
+### VGrammar(中层)
+
+VGrammar 是基于 VRender 的可视化语法库:
+
+* 它使用声明式语法来描述数据可视化
+
+* VGrammar 将数据与视觉元素映射起来,处理数据变换、标记、比例尺等
+
+* 它提供了更加高级的 API,简化了创建复杂可视化的过程
+
+* VGrammar 负责图表的语法定义、数据映射、自动布局等
+
+* 它相当于是对 VRender 的进一步封装,增加了更多的可视化语法概念
+
+### VChart(上层)
+
+VChart 是最上层的图表组件库:
+
+* 它基于 VGrammar 构建,封装了常见的图表类型(柱状图、饼图、折线图等)
+
+* VChart 提供了开箱即用的图表组件,用户不需要了解底层的图形语法
+
+* 它具有跨平台特性,能自动适配桌面、H5 和多种小程序环境
+
+* VChart 提供了完整的数据叙事能力,包括全面的注释、动画、流程控制和叙事模板
+
+* 它面向最终用户,提供了最友好的可视化界面和 API
+
+### 总结关系
+
+这三者的架构关系可以理解为:
+
+```Typescript
+VChart (图表组件库)
+ ↓
+VGrammar (可视化语法)
+ ↓
+VRender (渲染引擎)
+ ↓
+浏览器/Canvas/WebGL
+
+```
+从代码实现上看:
+
+* VChart 使用 VGrammar 来定义和构建图表
+
+* VGrammar 使用 VRender 来进行实际的绘制和渲染
+
+* 最终,VRender 控制底层的 Canvas/WebGL 绘制图形
+
+这种分层架构使得开发者可以根据需要选择不同层次的工具:如果需要高度自定义的可视化,可以直接使用 VRender 或 VGrammar;如果需要快速创建标准图表,则可以使用 VChart。
+
+## 1.2.2 VChart 内部组件之间关系与源码结构
+
+整体架构采用了模块化设计,核心分为以下几个主要部分:
+
+1. 核心引擎 (Core): VChart 的中心控制器,负责组织各模块协同工作
+
+1. 图表 (Chart): 各种图表类型的具体实现
+
+1. 系列 (Series): 负责图表中数据到图形的映射
+
+1. 标记 (Mark): 基础图形元素
+
+1. 区域 (Region): 定义图表渲染的区域
+
+1. 组件 (Component): 如坐标轴、图例等附加组件
+
+1. 布局 (Layout): 处理图表各元素的位置计算
+
+1. 事件 (Event): 处理用户交互
+
+1. 缩放 (Scale): 数据映射和比例尺相关
+
+1. 数据处理 (Data): 数据转换和处理
+
+### 核心模块
+
+#### VChart 核心类
+
+VChart 类是整个图表库的入口,它负责实例化和管理整个图表的生命周期。
+
+```Typescript
+// packages/vchart/src/core/vchart.ts
+export class VChart implements IVChart {
+ readonly id = createID();
+
+ // 用于注册图表、组件、系列等
+ static useRegisters(comps: (() => void)[]) { ... }
+ static useChart(charts: IChartConstructor[]) { ... }
+ static useSeries(series: ISeriesConstructor[]) { ... }
+
+ // 核心渲染流程
+ renderSync(morphConfig?: IMorphConfig) { ... }
+ async renderAsync(morphConfig?: IMorphConfig) { ... }
+
+ // 数据更新方法
+ updateData(id: StringOrNumber, data: DataView | Datum[] | string, ...) { ... }
+ updateSpec(spec: ISpec, forceMerge: boolean = false, ...) { ... }
+
+ // 状态管理
+ setSelected(datum: MaybeArray
+
+在这个例子中,也是一个组合图,但是他的两组 series 出现在了不同的 region。如上文所说,我们用 layout 管理 region 的布局,在这个例子中,我们使用了如下代码:
+
+```Typescript
+ layout: {
+ type: 'grid',
+ col: 4,
+ row: 3,
+ elements: [
+ {
+ modelId: 'legend',
+ col: 0,
+ colSpan: 4,
+ row: 0
+ },
+ {
+ modelId: 'pie-region',
+ col: 0,
+ colSpan: 2,
+ row: 1
+ },
+ {
+ modelId: 'axis-left',
+ col: 2,
+ row: 1
+ },
+ {
+ modelId: 'bar-region',
+ col: 3,
+ row: 1
+ },
+ {
+ modelId: 'axis-bottom',
+ col: 3,
+ row: 2
+ }
+ ]
+ },
+
+```
+上面通过了类似于 grid 的方式来管理 region 和 component 的布局。我们使用这些 `modelId` 来关联对应 region 和 component 的配置:
+
+```Typescript
+ region: [
+ {
+ id: 'pie-region'
+ },
+ {
+ id: 'bar-region'
+ }
+ ],
+ axes: [
+ {
+ id: 'axis-left',
+ regionId: 'bar-region',
+ orient: 'left'
+ },
+ {
+ id: 'axis-bottom',
+ regionId: 'bar-region',
+ orient: 'bottom'
+ }
+ ]
+
+```
+# 1.2 VChart 架构与源码结构
+
+## 1.2.1 VChart, VGrammar 和 VRender 的关系
+
+这三者是 VisActor 可视化系统中的三个核心组件,它们的关系是层次化的,从底层到上层分别是:
+
+### VRender(底层)
+
+VRender 是一个底层的可视化渲染引擎,负责最基本的图形绘制和渲染工作:
+
+* 它提供了丰富的可视化渲染功能,包括自定义动画、元素组合和叙事排列
+
+* 它是 VisActor 可视化系统的基础,为上层库提供渲染能力
+
+* VRender 提供插件系统,可以灵活扩展
+
+* 它可以在 2D/3D 效果之间无缝切换
+
+* 它负责底层的 Canvas 操作、图形绘制、场景管理等
+
+### VGrammar(中层)
+
+VGrammar 是基于 VRender 的可视化语法库:
+
+* 它使用声明式语法来描述数据可视化
+
+* VGrammar 将数据与视觉元素映射起来,处理数据变换、标记、比例尺等
+
+* 它提供了更加高级的 API,简化了创建复杂可视化的过程
+
+* VGrammar 负责图表的语法定义、数据映射、自动布局等
+
+* 它相当于是对 VRender 的进一步封装,增加了更多的可视化语法概念
+
+### VChart(上层)
+
+VChart 是最上层的图表组件库:
+
+* 它基于 VGrammar 构建,封装了常见的图表类型(柱状图、饼图、折线图等)
+
+* VChart 提供了开箱即用的图表组件,用户不需要了解底层的图形语法
+
+* 它具有跨平台特性,能自动适配桌面、H5 和多种小程序环境
+
+* VChart 提供了完整的数据叙事能力,包括全面的注释、动画、流程控制和叙事模板
+
+* 它面向最终用户,提供了最友好的可视化界面和 API
+
+### 总结关系
+
+这三者的架构关系可以理解为:
+
+```Typescript
+VChart (图表组件库)
+ ↓
+VGrammar (可视化语法)
+ ↓
+VRender (渲染引擎)
+ ↓
+浏览器/Canvas/WebGL
+
+```
+从代码实现上看:
+
+* VChart 使用 VGrammar 来定义和构建图表
+
+* VGrammar 使用 VRender 来进行实际的绘制和渲染
+
+* 最终,VRender 控制底层的 Canvas/WebGL 绘制图形
+
+这种分层架构使得开发者可以根据需要选择不同层次的工具:如果需要高度自定义的可视化,可以直接使用 VRender 或 VGrammar;如果需要快速创建标准图表,则可以使用 VChart。
+
+## 1.2.2 VChart 内部组件之间关系与源码结构
+
+整体架构采用了模块化设计,核心分为以下几个主要部分:
+
+1. 核心引擎 (Core): VChart 的中心控制器,负责组织各模块协同工作
+
+1. 图表 (Chart): 各种图表类型的具体实现
+
+1. 系列 (Series): 负责图表中数据到图形的映射
+
+1. 标记 (Mark): 基础图形元素
+
+1. 区域 (Region): 定义图表渲染的区域
+
+1. 组件 (Component): 如坐标轴、图例等附加组件
+
+1. 布局 (Layout): 处理图表各元素的位置计算
+
+1. 事件 (Event): 处理用户交互
+
+1. 缩放 (Scale): 数据映射和比例尺相关
+
+1. 数据处理 (Data): 数据转换和处理
+
+### 核心模块
+
+#### VChart 核心类
+
+VChart 类是整个图表库的入口,它负责实例化和管理整个图表的生命周期。
+
+```Typescript
+// packages/vchart/src/core/vchart.ts
+export class VChart implements IVChart {
+ readonly id = createID();
+
+ // 用于注册图表、组件、系列等
+ static useRegisters(comps: (() => void)[]) { ... }
+ static useChart(charts: IChartConstructor[]) { ... }
+ static useSeries(series: ISeriesConstructor[]) { ... }
+
+ // 核心渲染流程
+ renderSync(morphConfig?: IMorphConfig) { ... }
+ async renderAsync(morphConfig?: IMorphConfig) { ... }
+
+ // 数据更新方法
+ updateData(id: StringOrNumber, data: DataView | Datum[] | string, ...) { ... }
+ updateSpec(spec: ISpec, forceMerge: boolean = false, ...) { ... }
+
+ // 状态管理
+ setSelected(datum: MaybeArray | null, ...) { ... }
+ setHovered(datum: MaybeArray | null, ...) { ... }
+}
+
+```
+VChart 的生命周期主要包括:
+
+1. 初始化配置与数据
+
+1. 创建图表实例
+
+1. 布局计算
+
+1. 渲染
+
+1. 交互事件处理
+
+1. 更新与销毁
+
+#### 模块图表类 (Chart)
+
+图表模块实现了各种不同类型的图表,如柱状图、折线图、饼图等,都继承自 BaseChart。
+
+```Typescript
+// packages/vchart/src/chart/base/base-chart.ts
+export class BaseChart extends CompilableBase implements IChart {
+ readonly type: string = 'chart';
+ readonly seriesType: string;
+
+ protected _regions: IRegion[] = [];
+ protected _series: ISeries[] = [];
+ protected _components: IComponent[] = [];
+
+ protected _layoutFunc: LayoutCallBack;
+ protected _layoutRect: IRect = { ... };
+
+ layout(params: ILayoutParams): void { ... }
+ compile() { ... }
+}
+
+```
+比如 BarChart 继承自 BaseChart
+
+```Typescript
+export class BarChart extends BaseChart {
+ static readonly type: string = ChartTypeEnum.bar;
+ static readonly seriesType: string = SeriesTypeEnum.bar;
+ static readonly transformerConstructor = BarChartSpecTransformer;
+ readonly transformerConstructor = BarChartSpecTransformer;
+ readonly type: string = ChartTypeEnum.bar;
+ readonly seriesType: string = SeriesTypeEnum.bar;
+}
+
+```
+图表模块负责:
+
+* 确定图表类型和布局
+
+* 管理包含的区域、系列和组件
+
+* 处理数据到视觉元素的整体映射
+
+#### 系列模块 (Series)
+
+系列模块是数据到视觉表现的核心映射,不同的系列类型对应不同的图形表现形式。
+
+```Typescript
+// packages/vchart/src/series/base/base-series.ts
+export abstract class BaseSeries extends BaseModel implements ISeries {
+ readonly type: string = 'series';
+ readonly coordinate: CoordinateType = 'none';
+
+ protected _region: IRegion;
+ protected _rootMark: IGroupMark = null;
+ protected _seriesMark: Maybe = null;
+
+ protected _rawData!: DataView;
+ protected _data: SeriesData = null;
+
+ abstract initMark(): void;
+ abstract initMarkStyle(): void;
+ abstract dataToPosition(data: Datum, checkInViewData?: boolean): IPoint;
+}
+
+```
+系列模块负责:
+
+* 数据到图形标记的转换
+
+* 处理特定图表类型的数据映射
+
+* 管理标记的样式和状态
+
+#### 标记模块 (Mark)
+
+标记是最基础的视觉元素,如线、矩形、点等,它们是构成图表的基本单位。相对应的代码在 `packages/vchart/src/mark `目录下有各种标记实现
+
+标记负责:
+
+* 实现具体的图形渲染
+
+* 处理交互状态(如高亮、选中)
+
+* 与数据进行绑定
+
+#### 区域模块 (Region)
+
+区域定义了图表在画布中的渲染位置,可以包含多个系列。对应代码在 `packages/vchart/src/region`
+
+区域模块负责:
+
+* 确定图表中各个子区域的位置和大小
+
+* 管理其中包含的系列
+
+* 处理区域之间的布局关系
+
+#### 组件模块 (Component)
+
+组件是图表中除了数据图形外的辅助元素,如坐标轴、图例、标题等。`packages/vchart/src/component` 目录下有各种组件实现
+
+组件模块负责:
+
+* 渲染各种辅助元素
+
+* 与用户交互(如图例的点击)
+
+* 与主图表的协同工作
+
+#### 布局模块 (Layout)
+
+布局模块负责计算图表各个元素的位置和大小。对应代码在 `packages/vchart/src/layout`具体包括:
+
+* 元素位置的计算
+
+* 自适应容器大小的调整
+
+* 处理元素之间的层级关系
+
+#### 事件模块 (Event)
+
+事件模块处理用户交互和内部事件。具体包括:
+
+* 处理用户交互事件(如点击、hover)
+
+* 分发内部事件
+
+* 触发数据更新和渲染更新
+
+#### 缩放模块 (Scale)
+
+缩放模块负责数据到视觉属性的映射转换。具体包括:
+
+* 处理数据与视觉空间的映射
+
+* 管理各种比例尺(线性、离散、颜色等)
+
+* 计算坐标轴的范围和刻度
+
+#### 数据模块 (Data)
+
+数据模块处理原始数据的转换和处理。具体包括:
+
+* 数据的解析和转换
+
+* 统计计算
+
+* 处理缺失值和异常值
+
+## 渲染流程
+
+VChart 的渲染流程主要包括以下步骤:
+
+1. 初始化: 通过 spec 配置创建 VChart 实例
+
+1. 编译: 解析配置,创建各种组件和系列
+
+1. 布局: 计算各元素的位置和大小
+
+1. 数据处理: 处理和转换数据
+
+1. 渲染准备: 绑定数据到标记
+
+1. 实际渲染: 将标记绘制到画布
+
+1. 交互绑定: 绑定各种交互事件
+
+## 数据更新流程
+
+当数据或配置发生变化时:
+
+1. 调用 updateData 或 updateSpec 方法
+
+1. 重新处理受影响的数据
+
+1. 更新相关比例尺
+
+1. 重新布局(如果需要)
+
+1. 更新受影响的标记
+
+1. 触发重新渲染
+
+
+
+ # 本文档由以下人员修正整理
+ [玄魂](https://github.com/xuanhun)
\ No newline at end of file
diff --git a/docs/assets/contributing/zh/sourcesode/10.1-animation-concepts-and-types.md b/docs/assets/contributing/zh/sourcesode/10.1-animation-concepts-and-types.md
new file mode 100644
index 0000000000..bb93e38cb6
--- /dev/null
+++ b/docs/assets/contributing/zh/sourcesode/10.1-animation-concepts-and-types.md
@@ -0,0 +1,1011 @@
+---
+title: 10.1 动画的概念和类型
+
+key words: VisActor,VChart,VTable,VStrory,VMind,VGrammar,VRender,Visualization,Chart,Data,Table,Graph,Gis,LLM
+---
+> 10.1 动画的概念和类型
+> 分数:4
+> 1. 动画的概念和类型:
+> 1. 其他参考文档:
+> https://www.visactor.io/vchart/guide/tutorial_docs/Animation/Animation_Types
+>
+> [魔力之帧(下):VChart 动画编程实践在这篇文章中,我们将从一些常见的图表动画入手,详细介绍在 VChart 中的编 - 掘金](https://juejin.cn/post/7314829865633595443)
+
+1. 代码入口:`packages/vchart/src/animation/`
+
+`packages/vchart/src/series/line/animation`
+
+`packages/vchart/src/core/vchart`
+
+`packages/vchart/src/core/interface`
+
+`packages/vchart/src/complie/mark`
+
+1. 解读重点:
+
+1. 动画分类(按执行时机,按效果)
+
+1. 动画系统的整体设计
+
+# 动画的概念
+
+
+
+在VChart中,动画是指在图表渲染过程中,通过视觉效果来增强数据展示的动态性和交互性。动画系统允许开发者配置和控制图表元素(如柱状图、饼图、折线图等)在不同状态下的过渡效果。
+
+在 VisActor 中动画被视作为渲染阶段的修饰:动画配置与图形语法流程执行得到的图元视觉通道一起决定了渲染阶段的结果。动画的表现是具体图形元素在某一时间段内视觉通道属性的插值计算或者特殊计算逻辑,而动画配置描述了这一计算的触发时机以及执行时长。
+
+
+
+## 动画的分类
+
+#### 生命周期示范
+
+
+
+
+
+### 按执行时机分类
+
+图表动画在 VChart 中根据状态场景(执行时机)会被区分为:**图表入场动画**、**数据更新动画**和**图表退场动画**。
+
+1. **图表入场动画:**是指图表创建时的动画效果。
+
+1. **数据更新动画:**当我们更新图表数据时,图元发生的属性动画则称为数据更新动画。分为:**新增图元动画**、**图元更新动画**和**退场图元动画、状态变更动画、任意时机触发的动画**。通常情况下,你不需要考虑如何控制这三种更新动画,因为 VChart 会在数据更新时,识别出新数据与上一次数据间的关联,从而正确执行更新动画。
+
+1. **图表退场动画**:在某些场景下,我们可能需要移除图表。此时,我们可以为图表设置退场动画,让图表在除之前有一个平滑过渡的动画效果。
+
+
+
+https://visactor.io/vchart/guide/tutorial_docs/Animation/Animation_Types 动画教程文档
+
+https://www.visactor.io/vchart/option/barChart#animationState 动画配置文档
+
+#### 图表**入场动画 (**`**animationAppear**`**)**:
+
+* 在图表首次渲染时,元素从无到有的过渡效果。
+
+* 示例代码:`animationAppear` 配置项用于定义图表入场动画。
+
+
+
+```html
+
+
+
+
+
+```
+```xml
+animationAppear?: boolean | IStateAnimateSpec | IMarkAnimateSpec;
+
+```
+#### 数据更新动画
+
+当我们更新图表数据时,图元发生的属性动画则称为更新动画。在 VChart 中,用户手动调用 `updateData` 接口会触发图表数据更新,另外,点击图例时也更新图表数据。更新动画分为三类:新增图元动画、图元更新动画和退场图元动画。
+
+1. **新增图元动画 (**`**animationEnter**`**)**:
+
+* 新增图元动画是指当图表数据更新时,新添加数据应的图元的动画效果。
+
+* 我们可以使用 `animationEnter` 配置来设置新增图元动画。
+
+```xml
+animationEnter?: boolean | ICommonStateAnimateSpec | IMarkAnimateSpec;
+
+```
+
+
+1. **图元更新动画 ( **`**animationUpdate**`**)**:
+
+* 图元更新动画是指当图表数据更新,原有数据对应的图元的更新动画效果。
+
+* 我们可以使用 `animationUpdate` 配置来设置图元更新动画。
+
+```xml
+animationUpdate?: boolean | ICommonStateAnimateSpec | IMarkAnimateSpec;
+
+```
+
+
+1. **退场图元动画 (**`**animationExit**`** )**:
+
+* 退图元动画是指当图表数据更新时,被删除数据所对应图元的动画效果。我们可以使用 `animationExit` 配置来设置退场图元动画。
+
+```xml
+animationExit?: boolean | ICommonStateAnimateSpec | IMarkAnimateSpec;
+
+```
+
+
+1. 图元**状态切换动画 (State)**:
+
+* 当图表状态发生改变时的过渡效果。
+
+* 示例代码:`animationState` 配置项用于定义状态切换动画。
+
+```xml
+animationState?: boolean | IStateAnimationConfig;
+
+```
+
+
+1. 常态**动画 (Normal)**:常用于循环
+
+* 用于定义持续不断的动画效果。
+
+* 示例代码:`animationNormal` 配置项用于定义循环动画。
+
+```xml
+animationNormal?: IMarkAnimateSpec;
+
+```
+
+
+#### 图表**退场动画 (**`**animationDisappear**`**)**:
+
+* 在图表销毁或隐藏时,元素的退场效果。
+
+```xml
+ animationDisappear?: boolean | ICommonStateAnimateSpec | IMarkAnimateSpec;
+
+```
+### 按效果分类
+
+type 图元原子化
+
+* 动画效果:动画效果描述了在某一特定的动画阶段中图元以怎样的方式执行渲染的变化。动画效果包括普通的视觉通道插值,例如竞速条形图中柱子颜色、宽度、位置的变化;同时动画效果也包含一些特殊的变化,例如下图中的图元形变。
+
+1. **渐入渐出 (FadeIn/FadeOut)**:
+
+* 元素透明度从0到1或从1到0的变化。
+
+* 示例代码:`Appear_FadeIn` 和 `Disappear_FadeOut`。
+
+```xml
+const Appear_FadeIn: IAnimationTypeConfig = {
+ type: 'fadeIn'
+};
+
+```
+
+
+1. **生长 (Grow)**:
+
+* 元素从某个初始尺寸逐渐增长到最终尺寸。
+
+* 示例代码:`barGrowOption` 和 `pieGrowOption`。
+
+```xml
+function barGrowOption(barParams: IBarAnimationParams, isOverall = true) {/***/}
+
+```
+
+
+1. **裁剪 (Clip)**:
+
+* 通过裁剪区域来显示元素的逐步出现或消失。
+
+* 示例代码:`registerCartesianGroupClipAnimation`。
+
+```xml
+const registerCartesianGroupClipAnimation = () => {
+ Factory.registerAnimation('cartesianGroupClip', (params?: ICartesianGroupAnimationParams) => {/***/});
+};
+
+```
+
+
+1. **波浪 (Wave)**:
+
+* 特殊效果,如液态图中的波浪效果。
+
+* 示例代码:`Appear_Wave`。
+
+```xml
+const Appear_Wave: IAnimationTypeConfig = {
+ duration: 2000,
+ loop: true,
+ channel: {
+ wave: { from: 0, to: 1 }
+ }
+};
+
+```
+
+
+1. **缩放 (Scale)**:
+
+* 元素大小从一个比例缩放到另一个比例。
+
+* 示例代码:`Appear_ScaleIn`。
+
+```xml
+const Appear_ScaleIn: IAnimationTypeConfig = {
+ type: 'growCenterIn'
+};
+
+```
+更多动画效果的属性和配置可参考https://visactor.com/vchart/guide/tutorial_docs/Animation/Animation_Attributes_and_Settings
+
+## 动画系统的设计
+
+### 简单柱状图动画配置
+
+
+
+下面以创建一个简单的柱状图为例,说明如何使用VChart的动画系统来实现基本动画效果的原理。
+
+
+
+
+
+```html
+
+
+
+
+
+
+```
+> 如何创建一个基础VChart可以参考以下文档
+> https://www.visactor.io/vchart/guide/tutorial_docs/Getting_Started 快速上手
+> https://www.visactor.io/vchart/guide/tutorial_docs/Basic/How_to_Import_VChart 导入VChart
+> https://www.visactor.io/vchart/guide/tutorial_docs/Basic/A_Basic_Spec 基础配置
+> https://www.visactor.io/vchart/guide/tutorial_docs/Basic/DeepSeek_With_Cursor DeepSeek+Cursor助力
+
+
+
+在 `VChart` 类中,`spec`(图表配置)中的 `animation` 配置项用于控制图表的动画行为。具体来说,`animation` 配置项可以定义图表在不同状态下的动画效果,例如入场动画、更新动画、退出动画等。
+
+#### `animation` 配置的作用
+
+1. **定义动画行为**:
+
+* `animation` 配置项可以包含多个子属性,如 `appear`、`enter`、`update`、`exit` 和 `disappear`,分别对应不同的动画场景。
+
+* 每个子属性可以进一步配置动画的持续时间 (`duration`)、缓动函数 (`easing`)、是否逐个执行 (`oneByOne`) 等参数。
+
+1. **控制动画开关**:
+
+* 如果将 `animation` 设置为 `false`,则禁用所有动画效果。
+
+* 如果设置为 `true` 或者提供具体的配置对象,则启用相应的动画效果。
+
+1. **传递给底层组件**:
+
+* `VChart` 类会将 `animation` 配置传递给内部的 `Compiler` 和 `Chart` 实例,这些实例会根据配置来决定是否应用动画以及如何应用动画。
+
+### 柱状图执行动画示例说明
+
+
+
+
+* 定义了一个初始的图表配置项`initialSpec`,其中包含图表类型、数据、坐标轴字段和动画配置。
+
+* 数据部分包含了一个`barData`的数据集,初始包含5个月的销售数据。
+
+* 使用`initialSpec`和DOM容器`chart`创建一个VChart实例。
+
+* 调用`renderAsync`方法异步渲染图表。图表渲染完成后,会触发动画入场效果。
+
+* 在渲染完成后,通过`setTimeout`模拟动画入场。实际动画效果由VChart内部处理。
+
+* 在3秒后,通过`updateDataSync`方法新增两个月的销售数据。`reAnimate: true`参数确保新增数据时有动画效果。
+
+* 在6秒后,通过`updateDataSync`方法更新所有图元的数据。`reAnimate: true`参数确保更新数据时有动画效果。
+
+* 在9秒后,通过`updateDataSync`方法移除两个月的销售数据。`reAnimate: true`参数确保移除数据时有动画效果。
+
+* 在12秒后,通过`updateState`方法更新图元的状态。这里设置了一个`selected`状态,当图元的`sales`值大于40时,图元的填充颜色变为红色。
+
+* 在15秒后,通过`release`方法销毁图表实例,图表退场。
+
+---
+
+
+
+### 源码实现流程
+
+1. **初始化 VChart 实例**
+
+当你创建一个 `VChart` 实例并传入 `spec` 时,构造函数会处理 `animation` 配置:
+
+文件:`vchart.ts` 方法:`constructor`
+
+```xml
+constructor(spec: ISpec, options: IInitOption) {
+ this._option = mergeOrigin(this._option, { animation: (spec as any).animation !== false }, options);
+ *// ...*
+}
+
+```
+这段代码确保了如果 `spec` 中没有显式禁用动画(即 `animation !== false`),则启用动画。
+
+1. 设置新 spec 并初始化图表
+
+在 `VChart` 类中,`_setNewSpec` 方法用于设置新的 `spec`,并将其转换为内部使用的格式:
+
+文件:`vchart.ts` 方法:`_setNewSpec`
+
+```xml
+private _setNewSpec(spec: any, forceMerge?: boolean): boolean {
+ if (!spec) {
+ return false;
+ }
+ if (isString(spec)) {
+ spec = JSON.parse(spec);
+ }
+ if (forceMerge && this._originalSpec) {
+ spec = mergeSpec({}, this._originalSpec, spec);
+ }
+ this._originalSpec = spec;
+ this._spec = this._getSpecFromOriginalSpec();
+ return true;
+}
+
+```
+接着,`_initChartSpec` 方法会根据 `spec` 初始化图表规格:
+
+文件:`vchart.ts` 方法:`_initChartSpec`
+
+```xml
+private _initChartSpec(spec: any, actionSource: VChartRenderActionSource) {
+ *// 如果用户注册了函数,在配置中替换相应函数名为函数内容*
+ if (VChart.getFunctionList() && VChart.getFunctionList().length) {
+ spec = functionTransform(spec, VChart);
+ }
+ this._spec = spec;
+ if (!this._chartSpecTransformer) {
+ this._chartSpecTransformer = Factory.createChartSpecTransformer(
+ this._spec.type,
+ this._getChartOption(this._spec.type)
+ );
+ }
+ this._chartSpecTransformer?.transformSpec(this._spec);
+ *// 插件生命周期*
+ this._chartPluginApply('onAfterChartSpecTransform', this._spec, actionSource);
+ this._specInfo = this._chartSpecTransformer?.transformModelSpec(this._spec);
+ *// 插件生命周期*
+ this._chartPluginApply('onAfterModelSpecTransform', this._spec, this._specInfo, actionSource);
+}
+
+```
+1. 创建和初始化 Chart 实例
+
+在 `_initChart` 方法中,创建并初始化图表实例:
+
+文件:`vchart.ts` 方法:`_initChart`
+
+```xml
+private _initChart(spec: any) {
+ if (!this._compiler) {
+ this._option?.onError('compiler is not initialized');
+ return;
+ }
+ if (this._chart) {
+ this._option?.onError('chart is already initialized');
+ return;
+ }
+ const chart = Factory.createChart(spec.type, spec, this._getChartOption(spec.type));
+ if (!chart) {
+ this._option?.onError('init chart fail');
+ return;
+ }
+ this._chart = chart;
+ this._chart.setCanvasRect(this._currentSize.width, this._currentSize.height);
+ this._chart.created(this._chartSpecTransformer);
+ this._chart.init();
+ this._event.emit(ChartEvent.initialized, {
+ chart,
+ vchart: this
+ });
+}
+
+```
+1. 更新动画状态
+
+当图表需要重新渲染或更新时,`_updateAnimateState` 方法会被调用来更新动画状态:
+
+文件:`vchart.ts` 方法:`_updateAnimateState`
+
+```xml
+private _updateAnimateState(initial?: boolean) {
+ if (this._option.animation) {
+ const animationState = initial ? AnimationStateEnum.appear : AnimationStateEnum.update;
+ this._chart?.getAllRegions().forEach(region => {
+ region.animate?.updateAnimateState(animationState, true);
+ });
+ this._chart?.getAllComponents().forEach(component => {
+ component.animate?.updateAnimateState(animationState, true);
+ });
+ }
+}
+
+```
+* **初始状态**:如果 `initial` 为 `true`,则设置动画状态为 `AnimationStateEnum.appear`(入场动画)。
+
+* **更新状态**:否则,设置为 `AnimationStateEnum.update`(更新动画)。
+
+1. 渲染图表
+
+在 `renderSync` 和 `renderAsync` 方法中,`animation` 配置会被传递给编译器进行渲染:
+
+文件:`vchart.ts` 方法:`_renderSync`
+
+```xml
+protected _renderSync = (option: IVChartRenderOption = {}) => {
+ const self = this as unknown as IVChart;
+ if (!this._beforeRender(option)) {
+ return self;
+ }
+ *// 填充数据绘图*
+ this._compiler?.render(option.morphConfig);
+ this._afterRender();
+ return self;
+};
+
+```
+1. 动画状态的更新
+
+在 `updateSpec` 和 `updateCustomConfigAndRerender` 方法中,`reAnimate` 标志用于决定是否重新触发动画:
+
+文件:`vchart.ts` 方法:`updateSpec` 和 `updateCustomConfigAndRerender`
+
+```xml
+if (userUpdateOptions?.reAnimate) {
+ this.stopAnimation();
+ this._updateAnimateState(true);
+}
+
+```
+
+
+### 动画系统设计概述
+
+
+
+VChart的动画系统设计遵循模块化、可扩展和易于配置的原则,旨在为开发者提供一个灵活且强大的工具来创建丰富的动画效果。以下是该系统的几个关键组成部分及其工作原理:
+
+### 原理
+
+#### 1. 动画接口与抽象
+
+
+
+* **IAnimate 接口**:定义了所有动画必须实现的方法和属性,包括获取唯一的ID、更新动画状态以及获取状态信号名称。
+
+*
+
+* **IAnimationSpec 接口**:规定了动画配置的结构,涵盖了从入场到退场的各种动画设置。
+
+
+
+classDiagram
+
+ class AnimationStateEnum {
+
+ --枚举--
+
+ appear: AnimationStateEnum
+
+ disappear: AnimationStateEnum
+
+ enter: AnimationStateEnum
+
+ update: AnimationStateEnum
+
+ exit: AnimationStateEnum
+
+ state: AnimationStateEnum
+
+ normal: AnimationStateEnum
+
+ none: AnimationStateEnum
+
+ }
+
+
+
+ class IAnimate {
+
+ <>
+
+ +updateAnimateState(state: AnimationStateEnum, noRender?: boolean): void
+
+ +getAnimationStateSignalName(): string
+
+ +id: number
+
+ }
+
+
+
+ class ICartesianGroupAnimationParams {
+
+ <>
+
+ +direction(): "x" | "y"
+
+ +orient(): "positive" | "negative"
+
+ +width(): number
+
+ +height(): number
+
+ }
+
+
+
+ class AnimateManager {
+
+ --属性--
+
+ -_stateMap: IAnimateState & StateMap
+
+ +id: number
+
+ --方法--
+
+ +updateAnimateState(state: AnimationStateEnum, noRender?: boolean): void
+
+ +getAnimationStateSignalName(): string
+
+ +constructor()
+
+ }
+
+
+
+ class MarkAnimationSpec {
+
+ --属性--
+
+ appear: IAnimationConfig
+
+ enter: IAnimationConfig
+
+ update: IAnimationConfig[]
+
+ exit: IAnimationConfig
+
+ disappear: IAnimationConfig
+
+ }
+
+
+
+ class IAnimationSpec {
+
+ --属性--
+
+ animationAppear: boolean | IStateAnimateSpec | IMarkAnimateSpec
+
+ animationEnter: boolean | ICommonStateAnimateSpec | IMarkAnimateSpec
+
+ animationUpdate: boolean | ICommonStateAnimateSpec | IMarkAnimateSpec
+
+ animationExit: boolean | ICommonStateAnimateSpec | IMarkAnimateSpec
+
+ animationDisappear: boolean | ICommonStateAnimateSpec | IMarkAnimateSpec
+
+ animationState: boolean | IStateAnimationConfig
+
+ animationNormal: IMarkAnimateSpec
+
+ }
+
+
+
+ class IStateAnimateSpec {
+
+ --属性--
+
+ duration?: number
+
+ delay?: number
+
+ easing?: EasingType
+
+ oneByOne?: boolean
+
+ preset?: Preset | false
+
+ }
+
+
+
+ class ICommonStateAnimateSpec {
+
+ --属性--
+
+ duration?: number
+
+ delay?: number
+
+ easing?: EasingType
+
+ oneByOne?: boolean
+
+ }
+
+
+
+ class IMorphSeriesSpec {
+
+ --属性--
+
+ enable?: boolean
+
+ morphKey?: string
+
+ morphElementKey?: string
+
+ }
+
+
+
+ class IAnimateState {
+
+ --属性--
+
+ animationState: { callback: (datum: any, element: IElement) => AnimationStateEnum }
+
+ }
+
+
+
+ class IAnimationConfig {
+
+ --属性--
+
+ type?: string
+
+ channel?: string
+
+ custom?: Function
+
+ customParameters?: Function
+
+ oneByOne?: boolean | number
+
+ duration?: number
+
+ easing?: EasingType
+
+ delay?: number
+
+ delayAfter?: number
+
+ }
+
+
+
+ % 关系
+
+ AnimationStateEnum "1" --|> "多" AnimateManager: 使用
+
+ AnimateManager "1" --|> "1" IAnimate: 实现
+
+ AnimateManager "1" -- "1" ICartesianGroupAnimationParams: 依赖
+
+ IAnimationSpec "1" -- "多" spec.ts: 定义于
+
+ MarkAnimationSpec "1" -- "1" config.ts: 由 config.ts 使用
+
+ IAnimationConfig "1" -- "多" utils.ts: 由 utils.ts 处理
+
+ IStateAnimateSpec "1" -- "1" ICommonStateAnimateSpec: 继承
+
+ IAnimationSpec "1" -- "1" IStateAnimateSpec: 关联
+
+ IAnimationSpec "1" -- "1" IMorphSeriesSpec: 关联
+
+ IAnimateState "1" -- "1" AnimateManager: 内部使用
+
+ IAnimationConfig "1" -- "1" ICommonStateAnimateSpec: 继承
+
+
+
+#### 2. 动画管理器
+
+
+
+* **AnimateManager 类**:继承自 `StateManager` 并实现了 `IAnimate` 接口,负责管理动画的状态,并提供方法来根据传入的状态更新动画。它处理动画状态的更新和检索,并根据不同状态更新动画状态。
+
+
+
+#### 3. 工厂模式
+
+
+
+* **Factory 类**:用于注册新的动画类型,允许将自定义动画逻辑添加到图表组件中。通过静态方法 `registerAnimation`,可以将特定类型的动画与其配置关联起来,方便后续调用。
+
+
+
+#### 4. 动画配置生成
+
+
+
+* **animationConfig 函数**:根据默认配置和用户提供的配置生成最终的动画配置。这个函数遍历所有的动画状态(如出现、进入、更新等),并根据用户配置或默认配置构建出完整的动画配置对象。
+
+
+
+#### 5. 动画任务接口
+
+
+
+* **IAnimationTask 接口**:定义了一个动画任务的数据结构,这对于理解复杂的动画序列非常重要。每个任务包含时间偏移、动作队列和后继任务列表,形成了一种链式动画执行机制。
+
+
+
+#### 6. 动画的具体实现
+
+
+
+* 每个具体的图表系列(如柱状图、饼图、散点图等)都有各自的动画实现文件,这些文件中包含了针对该系列的预设动画函数。例如,柱状图可能有生长动画、淡入动画等;饼图则可能有扇区展开动画等。
+
+
+
+
+
+通过上述步骤,我们已经完成了一个简单但完整的动画流程创建。在这个过程中,我们利用了VChart动画系统的模块化设计,分别对图表配置、动画注册、实例化图表、数据更新以及动画状态管理进行了处理。这种设计不仅让代码更加清晰易读,同时也提高了系统的灵活性和可维护性。开发者可以根据实际需求轻松地定制不同类型的动画效果,从而提升用户体验。
+
+
+
+为了更好地理解和解读这些源码文件,建议按照以下顺序阅读:
+
+1. `**interface.ts**`
+
+* **原因**:该文件定义了动画模块中的核心类型和接口,如 `AnimationStateEnum`、`IAnimateState` 和 `IAnimate` 等。理解这些类型和接口是后续代码的基础。
+
+* **重点内容**:
+
+* 动画状态枚举 `AnimationStateEnum`
+
+* 动画状态接口 `IAnimateState`
+
+* 动画接口 `IAnimate`
+
+1. `**spec.ts**`
+
+* **原因**:该文件定义了动画配置的规范,包括 `ICommonStateAnimateSpec`、`IStateAnimateSpec` 和 `IAnimationSpec` 等。这些规范在实际动画配置中会被使用,因此需要先了解它们的结构。
+
+* **重点内容**:
+
+* 动画配置的通用属性 `ICommonStateAnimateSpec`
+
+* 动画状态配置 `IStateAnimateSpec`
+
+* 动画规范 `IAnimationSpec`
+
+1. `**config.ts**`
+
+* **原因**:该文件提供了默认的动画配置和一些预设的动画注册函数。理解这些默认配置有助于理解如何自定义动画配置。
+
+* **重点内容**:
+
+* 默认动画配置 `DEFAULT_ANIMATION_CONFIG`
+
+* 预设动画注册函数(如 `registerScaleInOutAnimation`、`registerFadeInOutAnimation` 等)
+
+1. `**utils.ts**`
+
+* **原因**:该文件包含了许多辅助函数,用于生成和处理动画配置。理解这些函数的工作原理可以帮助你更好地理解动画配置是如何被应用的。
+
+* **重点内容**:
+
+* 生成动画配置的函数 `animationConfig`
+
+* 处理用户动画配置的函数 `userAnimationConfig`
+
+* 辅助函数(如 `produceOneByOne`、`shouldMarkDoMorph` 等)
+
+1. `**animate-manager.ts**`
+
+* **原因**:该文件实现了 `AnimateManager` 类,它是管理动画的核心类。理解这个类的实现可以让你知道动画是如何被管理和更新的。
+
+* **重点内容**:
+
+* `AnimateManager` 类的实现
+
+* 更新动画状态的方法 `updateAnimateState`
+
+* 获取动画状态信号名称的方法 `getAnimationStateSignalName`
+
+### 总结
+
+按照上述顺序阅读这些文件,可以逐步建立起对整个动画模块的理解。从基础的类型和接口开始,逐步深入到具体的配置和实现细节,最终理解动画是如何被管理和应用的。
+
+### 阅读顺序总结
+
+* `**interface.ts**` 核心类型和接口
+
+* `**spec.ts**` 动画配置规范
+
+* `**config.ts**` 默认配置和预设动画
+
+* `**utils.ts**` 辅助函数和配置生成
+
+* `**animate-manager.ts**`动画管理类实现
+
+ # 本文档由以下人员修正整理
+ [玄魂](https://github.com/xuanhun)
\ No newline at end of file
diff --git a/docs/assets/contributing/zh/sourcesode/10.2-global-morphing-animation.md b/docs/assets/contributing/zh/sourcesode/10.2-global-morphing-animation.md
new file mode 100644
index 0000000000..e526dfb9e5
--- /dev/null
+++ b/docs/assets/contributing/zh/sourcesode/10.2-global-morphing-animation.md
@@ -0,0 +1,558 @@
+---
+title: 10.2 全局形变动画
+
+key words: VisActor,VChart,VTable,VStrory,VMind,VGrammar,VRender,Visualization,Chart,Data,Table,Graph,Gis,LLM
+---
+## 10.2 全局形变动画
+
+分数: 8
+
+1. 全局动画:
+
+1. 代码入口:`packages/vchart/src/animation/`
+
+1. 解读重点:
+
+1. 全局动画的实现
+
+1. 其他参考文档:
+
+https://www.visactor.io/vchart/guide/tutorial_docs/Animation/Animation_Types
+
+https://www.visactor.io/vrender/guide/asd/Basic_Tutorial/Animate
+
+https://visactor.io/vgrammar/guide/guides/animation
+
+[魔力之帧(上):前端图表库动画实现原理一幅生动的可视化作品往往少不了动画的参与。无论是各色各样的图表还是叙事作品,组织周 - 掘金](https://juejin.cn/post/7275270809777520651)
+
+在10.1中初步了解了VChart对动画系统的设计和图表的创建示例,这一节继续介绍在使用VChart中,不同图表配置之间切换时的过渡设计。
+
+### 定义
+
+VChart 提供了各个系列间相关切换的形变动画,我们称**全局形变动画**。
+
+在通过 `updateSpec` 来更新图表配置时,VChart 会检测新旧图表的两个相关联的系列,是否符合形变动画的条件,从而执行**一对一、一对多或多对一的图形**之间的动态过渡。 全局形变动画能让用户在展示的图表类型发生变化时有更好的视觉体验,避免看上去是瞬间变化的感觉,毕竟,视觉舒适是我们在展示数据和分析数据的过程中所应当关注的一个重要因素。
+
+> https://visactor.com/vchart/api/API/vchart 参考接口文档
+>
+
+```Typescript
+updateSpec
+异步spec 更新,会自动渲染图表不需要再调用 renderAsync() 等渲染方法。
+/**
+ * spec 更新
+ * @param spec
+ * @param forceMerge 是否强制合并,默认为 false
+ * @param morphConfig morph 动画配置
+ * @returns
+ */
+updateSpec: (spec: ISpec, forceMerge?: boolean, morphConfig?: IMorphConfig) => Promise;
+
+```
+
+
+
+### 效果示例
+
+下面通过两个示例配置说明这类过渡动画的效果:
+
+#### 一对一动画
+
+一对一动画是指两个不同的图形之间的过渡动画。例如在下面这个例子中,展示了我们在饼图和柱状图之间切换时的全局动画:
+
+
+
+
+
+```xml
+/**
+ * 自1.12.0后,全局形变动画需要手动注册才能生效
+ *
+ * import { registerMorph } from '@visactor/vchart';
+ *
+ * registerMorph();
+ */
+
+VCHART_MODULE.registerMorph();
+
+const pieSpec = {
+ type: 'pie',
+ data: [
+ {
+ values: [
+ { type: '1', value: Math.random() },
+ { type: '2', value: Math.random() },
+ { type: '3', value: Math.random() }
+ ]
+ }
+ ],
+ outerRadius: 0.8,
+ innerRadius: 0.6,
+ valueField: 'value',
+ categoryField: 'type',
+ tooltip: false
+};
+
+const barSpec = Object.assign({}, pieSpec, {
+ type: 'bar',
+ xField: 'type',
+ yField: 'value',
+ seriesField: 'type'
+});
+
+const specs = [pieSpec, barSpec];
+
+const vchart = new VChart(specs[0], { dom: CONTAINER_ID });
+
+vchart.renderSync();
+let count = 1;
+setInterval(() => {
+ vchart.updateSpec(specs[count % 2]);
+ count++;
+}, 2000);
+
+
+```
+
+#### 一对多动画
+
+一对多动画是指一个图形元素向多个图形元素过渡的动画。例如在下面这个例子中,展示了我们在柱状图和散点图之间切换时的全局动画,其中,将一个大的柱子拆分为多个散点的动画就是一对多动画。
+
+
+
+
+```javascript
+/**
+ * 自1.12.0后,全局形变动画需要手动注册才能生效
+ *
+ * import { registerMorph } from '@visactor/vchart';
+ *
+ * registerMorph();
+ */
+
+VCHART_MODULE.registerMorph();
+
+function calculateAverage(data, dim) {
+ let total = 0;
+ for (let i = 0; i < data.length; i++) {
+ total += data[i][dim];
+ }
+ return (total /= data.length);
+}
+
+function generateData(type) {
+ const data = [];
+ for (let i = 0; i < 10; i++) {
+ data.push({ x: i, y: Math.random(), type });
+ }
+ return data;
+}
+const DataA = generateData('A');
+
+const DataB = generateData('B');
+
+const barSpec = {
+ type: 'common',
+ series: [
+ {
+ type: 'bar',
+ data: { values: [{ value: calculateAverage(DataA, 'y'), type: 'A' }] },
+ xField: 'type',
+ yField: 'value',
+ morph: {
+ morphKey: 'A'
+ }
+ },
+ {
+ type: 'bar',
+ data: { values: [{ value: calculateAverage(DataB, 'y'), type: 'B' }] },
+ xField: 'type',
+ yField: 'value',
+ morph: {
+ morphKey: 'B'
+ }
+ }
+ ],
+ axes: [
+ { orient: 'left', type: 'linear', max: 1 },
+ { orient: 'bottom', type: 'band' }
+ ]
+};
+
+const scatterSpec = {
+ type: 'common',
+ series: [
+ {
+ type: 'scatter',
+ data: { values: DataA },
+ xField: 'x',
+ yField: 'y',
+ seriesField: 'type',
+ morph: {
+ morphKey: 'A',
+ morphElementKey: 'type'
+ }
+ },
+ {
+ type: 'scatter',
+ data: { values: DataB },
+ xField: 'x',
+ yField: 'y',
+ seriesField: 'type',
+ morph: {
+ morphKey: 'B',
+ morphElementKey: 'type'
+ }
+ }
+ ],
+ axes: [
+ { orient: 'left', type: 'linear', zero: false, max: 1 },
+ { orient: 'bottom', type: 'band' }
+ ]
+};
+
+const specs = [barSpec, scatterSpec];
+
+const vchart = new VChart(specs[0], { dom: CONTAINER_ID });
+
+vchart.renderSync();
+let count = 1;
+setInterval(() => {
+ vchart.updateSpec(specs[count % 2]);
+ count++;
+}, 3000);
+
+
+```
+#### 多对一动画
+
+多对一动画是指多个图形元素过渡到一个元素。例如,在上面的例子中,我们可以让散点系列的多个点合并为一个大的柱子。
+
+### 效果实现的源码执行过程解读
+
+通过配置可以说明不同图表的切换是通过更新配置来实现的,并且在形变动画开启的情况下会自动识别系列图元的切换过渡效果,下面对默认效果的设置做一个说明。
+
+
+
+
+
+### 草稿 全局动画的实现解读x
+
+
+
+全局动画是指那些作用于整个图表级别的动画效果,它们可以应用于图表加载时的整体入场动画、数据更新时的统一变化动画,以及图表销毁前的整体退场动画。在VChart中,全局动画的设计和实现依赖于几个核心组件和机制,包括`Factory`类、`AnimateManager`类、`IAnimationSpec`接口等。
+
+
+
+#### 1. 动画注册与管理
+
+
+
+**Factory 类**
+
+
+
+`Factory`类是动画系统中的一个关键角色,它负责管理和注册各种类型的动画。通过静态方法`registerAnimation`,我们可以将特定的动画逻辑与名称关联起来,以便后续使用。
+
+
+
+```xml
+class Factory {
+ static registerAnimation(key: string, animation: (params?: any, preset?: any) => MarkAnimationSpec) {
+ Factory._animations[key] = animation;
+ }
+}
+
+```
+
+
+当需要为某个图表元素添加动画时,可以通过`Factory.getAnimationInKey`获取已注册的动画,并将其应用到对应的图元或图形元素上。
+
+
+
+#### 2. 动画配置结构
+
+
+
+**IAnimationSpec 接口**
+
+
+
+`IAnimationSpec`接口定义了动画配置的基本结构,涵盖了从入场(`animationAppear`)到退场(`animationDisappear`)的各种状态。每个状态都可以接受布尔值(启用/禁用)、预设配置对象或自定义配置对象作为参数。
+
+
+
+```xml
+interface IAnimationSpec {
+ animationAppear?: boolean | IStateAnimateSpec | IMarkAnimateSpec;
+ animationEnter?: boolean | ICommonStateAnimateSpec | IMarkAnimateSpec;
+ animationUpdate?: boolean | ICommonStateAnimateSpec | IMarkAnimateSpec;
+ animationExit?: boolean | ICommonStateAnimateSpec | IMarkAnimateSpec;
+ animationDisappear?: boolean | ICommonStateAnimateSpec | IMarkAnimateSpec;
+ animationState?: boolean | IStateAnimationConfig;
+ animationNormal?: IMarkAnimateSpec;
+}
+
+```
+
+
+这些配置项允许开发者灵活地控制不同状态下动画的行为,例如设置持续时间、缓动函数、动画类型等。
+
+
+
+#### 3. 动画状态管理
+
+
+
+**AnimateManager 类**
+
+
+
+`AnimateManager`继承自`StateManager`并实现了`IAnimate`接口,用于管理动画的状态。它提供了方法来更新动画状态,并根据当前状态触发相应的动画逻辑。
+
+
+
+```xml
+class AnimateManager extends StateManager implements IAnimate {
+ updateAnimateState(state: AnimationStateEnum, noRender?: boolean) {
+ if (state === AnimationStateEnum.update) {
+ // 更新状态下的动画逻辑
+ } else if (state === AnimationStateEnum.appear) {
+ // 出现状态下的动画逻辑
+ } else {
+ // 其他状态下的动画逻辑
+ }
+ }
+}
+
+```
+
+
+此外,`AnimateManager`还负责生成唯一的标识符(ID)和信号名称,确保每个动画实例都能被正确识别和管理。
+
+
+
+#### 4. 动画配置生成
+
+
+
+**animationConfig 函数**
+
+
+
+为了简化用户配置和默认配置之间的合并过程,VChart提供了一个名为`animationConfig`的辅助函数。该函数遍历所有可能的动画状态,并根据用户提供的配置或默认配置构建出最终的动画配置对象。
+
+
+
+```xml
+function animationConfig(
+ defaultConfig: MarkAnimationSpec = {},
+ userConfig?: Partial | IAnimationConfig | IAnimationConfig[]>>,
+ params?: { dataIndex: (datum: any, params: any) => number; dataCount: () => number; }
+): MarkAnimationSpec {
+ const config = {} as MarkAnimationSpec;
+
+ for (let i = 0; i < AnimationStates.length; i++) {
+ const state = AnimationStates[i];
+ const userStateConfig = userConfig ? userConfig[state] : undefined;
+
+ if (userStateConfig === false) continue;
+
+ if (state === 'normal') {
+ userStateConfig && (config.normal = userStateConfig as IAnimationTypeConfig);
+ continue;
+ }
+
+ let defaultStateConfig: IAnimationConfig[];
+ if (isArray(defaultConfig[state])) {
+ defaultStateConfig = defaultConfig[state] as IAnimationConfig[];
+ } else {
+ defaultStateConfig = [{ ...DEFAULT_ANIMATION_CONFIG[state], ...defaultConfig[state] } as any];
+ }
+
+ config[state] = defaultStateConfig;
+ }
+
+ return config;
+}
+
+```
+
+
+此函数会处理默认配置和用户配置的合并,并且考虑到了某些状态(如`normal`)可以直接使用用户提供的配置,而不需要额外处理。
+
+
+
+#### 5. 全局动画的具体实现
+
+
+
+**全局动画的注册**
+
+
+
+以折线图或区域图为例,`registerVGrammarLineOrAreaAnimation`函数展示了如何批量注册一系列动画方法。这些动画涵盖了点增长、点移动、裁剪等效果,并适用于X轴和Y轴方向。
+
+
+
+```xml
+const registerVGrammarLineOrAreaAnimation = () => {
+ View.useRegisters([
+ registerGrowPointsInAnimation,
+ registerGrowPointsOutAnimation,
+ registerGrowPointsXInAnimation,
+ registerGrowPointsXOutAnimation,
+ registerGrowPointsYInAnimation,
+ registerGrowPointsYOutAnimation,
+ registerClipInAnimation,
+ registerClipOutAnimation
+ ]);
+};
+
+```
+
+
+**全局动画的初始化**
+
+
+
+在具体系列的实现文件中(如柱状图、饼图等),通常会在初始化阶段调用`initAnimation`方法来设置动画配置。这个方法会结合用户提供的配置和默认配置,生成最终的动画配置,并将其应用到相应的图元或图形元素上。
+
+
+
+```xml
+initAnimation(): void {
+ const animationParams = getGroupAnimationParams(this);
+ const appearPreset = (this._spec?.animationAppear as IStateAnimateSpec)?.preset;
+ this._symbolMark.setAnimationConfig(
+ animationConfig(
+ Factory.getAnimationInKey('scatter')?.({}, appearPreset),
+ userAnimationConfig(SeriesMarkNameEnum.point, this._spec, this._markAttributeContext),
+ animationParams
+ )
+ );
+}
+
+```
+
+
+这里,`animationConfig`函数用于合并默认配置和用户配置,而`userAnimationConfig`则负责提取用户提供的动画配置信息。最后,通过`setAnimationConfig`方法将生成的配置应用到具体的图元上。
+
+
+
+#### 6. 动画任务的执行
+
+
+
+**IAnimationTask 接口**
+
+
+
+对于复杂的动画序列,VChart引入了`IAnimationTask`接口来描述动画任务的数据结构。每个任务包含时间偏移、动作队列和后继任务列表,形成了一种链式动画执行机制。
+
+
+
+```xml
+interface IAnimationTask {
+ timeOffset: number;
+ actionList: Action[];
+ nextTaskList: IAnimationTask[];
+}
+
+```
+
+
+这种设计使得多个动画任务可以按顺序或并发执行,从而实现更加复杂和细腻的动画效果。
+
+
+
+#### 7. 示例:创建全局入场动画
+
+
+
+假设我们要为一个新创建的柱状图添加一个全局的淡入入场动画,以下是详细的实现步骤:
+
+
+
+* **定义动画配置**:首先,在图表配置中指定`animationAppear`为`true`,表示启用入场动画。同时,可以进一步定制动画的具体行为,比如选择淡入效果、设置持续时间和缓动函数。
+
+
+
+```xml
+const chartSpec = {
+ // ... 其他配置 ...
+ animationAppear: {
+ type: 'fadeIn',
+ duration: 1000,
+ easing: 'easeInOutQuad'
+ },
+ series: [
+ {
+ type: 'bar',
+ data: [/* 数据数组 */]
+ }
+ ]
+};
+
+```
+
+
+* **注册淡入动画**:接着,我们需要确保淡入动画已经被正确注册到系统中。这一步骤通常在项目启动时完成,或者在需要的地方显式调用。
+
+
+
+```xml
+import { Factory } from '@visactor/vchart';
+import { Appear_FadeIn } from './series/bar/animation';
+
+Factory.registerAnimation('fadeIn', Appear_FadeIn);
+
+```
+
+
+* **初始化图表实例**:有了上述配置之后,我们可以初始化一个`VChart`实例,并将配置传递给它。这会触发图表的渲染过程,并应用相应的动画效果。
+
+
+
+```xml
+import { VChart } from '@visactor/vchart';
+
+const container = document.getElementById('chart-container');
+const chart = new VChart({
+ el: container,
+ spec: chartSpec,
+ options: {
+ animation: true, // 开启动画
+ theme: 'light' // 使用浅色主题
+ }
+});
+
+```
+
+
+* **触发动画**:一旦图表被渲染出来,任何数据的变化都会自动触发动画。例如,当页面首次加载时,所有柱子将以淡入的方式逐渐显现;当有新的数据加入时,新柱子也会以同样的方式进入。
+
+
+
+* **手动控制动画**:如果需要对动画进行更精细的控制,比如暂停或恢复动画,可以使用`VChart`实例提供的相关方法。
+
+
+
+```xml
+// 暂停所有正在进行的动画
+chart.pauseAnimation();
+
+// 恢复之前暂停的动画
+chart.resumeAnimation();
+
+```
+
+
+#### 总结
+
+
+
+通过以上步骤,我们详细解读了VChart中全局动画的实现原理。VChart的动画系统设计巧妙地结合了工厂模式、状态管理器模式以及模块化的动画配置,不仅提供了丰富的内置动画效果,还支持高度定制化的需求。开发者可以根据实际应用场景灵活配置和组合不同的动画,创造出既美观又实用的可视化效果。
+
+ # 本文档由以下人员修正整理
+ [玄魂](https://github.com/xuanhun)
\ No newline at end of file
diff --git a/docs/assets/contributing/zh/sourcesode/10.3-state-change-animation.md b/docs/assets/contributing/zh/sourcesode/10.3-state-change-animation.md
new file mode 100644
index 0000000000..6d3203c60c
--- /dev/null
+++ b/docs/assets/contributing/zh/sourcesode/10.3-state-change-animation.md
@@ -0,0 +1,457 @@
+---
+title: 10.3 状态变更动画
+
+key words: VisActor,VChart,VTable,VStrory,VMind,VGrammar,VRender,Visualization,Chart,Data,Table,Graph,Gis,LLM
+---
+## 10.3 状态变更动画
+
+分数:5
+
+1. 状态动画:
+
+1. 代码入口:`packages/vchart/src/animation/`
+
+1. 解读重点:
+
+1. 状态动画的实现
+
+1. 其他参考文档:
+
+https://www.visactor.io/vchart/guide/tutorial_docs/Animation/Animation_Types
+
+https://www.visactor.io/vrender/guide/asd/Basic_Tutorial/Animate
+
+https://visactor.io/vgrammar/guide/guides/animation
+
+[魔力之帧(上):前端图表库动画实现原理一幅生动的可视化作品往往少不了动画的参与。无论是各色各样的图表还是叙事作品,组织周 - 掘金](https://juejin.cn/post/7275270809777520651)
+
+往往在图表呈现的时候,不同的图元有各自所代表的含义,信息展示中需要强调或者对比某些元素,通过切换图元的状态来展示数据,这一过程也需要注重视觉效果,当状态变更时有较为自然的视觉体验。
+
+### 状态动画(包括 `normal` 动画)的实现解读
+
+state和normal
+
+
+
+**状态变更动画、任意时机触发的动画**
+
+状态动画是指图表元素根据其当前状态变化时触发的动画效果。在VChart中,状态动画的设计允许开发者为不同的状态(如进入、更新、退出等)定义特定的动画行为。特别地,`normal` 状态动画指的是那些循环播放或持续存在的动画效果,它们可以在图表渲染完成后一直运行,直到被显式停止。
+
+
+
+#### 1. 动画配置结构
+
+
+
+**IAnimationSpec 接口**
+
+
+
+`IAnimationSpec`接口定义了动画配置的基本结构,其中包含了针对不同状态的动画设置。对于`normal`动画来说,它可以通过`animationNormal`属性来指定:
+
+
+
+```xml
+interface IAnimationSpec {
+ // ... 其他状态 ...
+ animationNormal?: IMarkAnimateSpec;
+}
+
+```
+
+
+这里,`IMarkAnimateSpec`是一个泛型接口,用于描述具体图元(如柱状图中的每个柱子)的动画配置。通过这种方式,开发者可以为每个图元定义个性化的`normal`动画效果。
+
+
+
+#### 2. 动画管理器
+
+
+
+**AnimateManager 类**
+
+
+
+`AnimateManager`类负责管理和协调所有动画的状态。它实现了`IAnimate`接口,并提供了方法来更新和检索动画状态。对于`normal`动画而言,`AnimateManager`会确保这些动画在图表渲染完成后自动启动,并且可以根据需要暂停或恢复。
+
+
+
+```xml
+class AnimateManager extends StateManager implements IAnimate {
+ updateAnimateState(state: AnimationStateEnum, noRender?: boolean) {
+ if (state === AnimationStateEnum.normal) {
+ this.updateState(
+ {
+ animationState: {
+ callback: (datum: any, element: IElement) => state
+ }
+ },
+ noRender
+ );
+ }
+ }
+}
+
+```
+
+
+当图表元素进入`normal`状态时,`updateAnimateState`方法会被调用,并将状态传递给内部的状态管理逻辑。这使得所有符合条件的元素都能够执行对应的`normal`动画。
+
+
+
+#### 3. 动画配置生成
+
+
+
+**animationConfig 函数**
+
+
+
+为了简化用户配置和默认配置之间的合并过程,VChart提供了一个名为`animationConfig`的辅助函数。该函数遍历所有可能的动画状态,并根据用户提供的配置或默认配置构建出最终的动画配置对象。
+
+
+
+```xml
+function animationConfig(
+ defaultConfig: MarkAnimationSpec = {},
+ userConfig?: Partial | IAnimationConfig | IAnimationConfig[]>>,
+ params?: { dataIndex: (datum: any, params: any) => number; dataCount: () => number; }
+): MarkAnimationSpec {
+ const config = {} as MarkAnimationSpec;
+
+ for (let i = 0; i < AnimationStates.length; i++) {
+ const state = AnimationStates[i];
+ const userStateConfig = userConfig ? userConfig[state] : undefined;
+
+ if (userStateConfig === false) continue;
+
+ if (state === 'normal') {
+ userStateConfig && (config.normal = userStateConfig as IAnimationTypeConfig);
+ continue;
+ }
+
+ let defaultStateConfig: IAnimationConfig[];
+ if (isArray(defaultConfig[state])) {
+ defaultStateConfig = defaultConfig[state] as IAnimationConfig[];
+ } else {
+ defaultStateConfig = [{ ...DEFAULT_ANIMATION_CONFIG[state], ...defaultConfig[state] } as any];
+ }
+
+ config[state] = defaultStateConfig;
+ }
+
+ return config;
+}
+
+```
+
+
+此函数处理了`normal`状态下的动画配置合并,确保用户提供的配置能够正确应用到具体的图元上。如果用户没有提供自定义的`normal`动画配置,则使用默认配置。
+
+
+
+#### 4. `normal` 动画的具体实现
+
+
+
+以散点图为例,假设我们希望为每个数据点添加一个轻微的脉冲效果作为`normal`动画。以下是详细的实现步骤:
+
+
+
+* **定义动画配置**:首先,在图表配置中为散点图系列指定`animationNormal`配置。这里我们可以选择内置的`pulse`动画类型,并调整其持续时间和缓动函数。
+
+
+
+```xml
+const chartSpec = {
+ series: [
+ {
+ type: 'scatter',
+ data: [/* 数据数组 */],
+ animationNormal: {
+ type: 'pulse', // 使用脉冲效果
+ duration: 800,
+ easing: 'easeInOutQuad'
+ }
+ }
+ ]
+};
+
+```
+
+
+* **注册动画**:接下来,我们需要确保`pulse`动画已经被正确注册到系统中。这一步骤通常在项目启动时完成,或者在需要的地方显式调用。
+
+
+
+```xml
+import { Factory } from '@visactor/vchart';
+import { pulseAnimation } from './series/scatter/animation';
+
+Factory.registerAnimation('pulse', pulseAnimation);
+
+```
+
+
+ 这里的`pulseAnimation`函数定义了脉冲动画的具体逻辑,例如如何改变图形元素的透明度或尺寸。
+
+
+
+* **初始化图表实例**:有了上述配置之后,我们可以初始化一个`VChart`实例,并将配置传递给它。这会触发图表的渲染过程,并应用相应的动画效果。
+
+
+
+```xml
+import { VChart } from '@visactor/vchart';
+
+const container = document.getElementById('chart-container');
+const chart = new VChart({
+ el: container,
+ spec: chartSpec,
+ options: {
+ animation: true, // 开启动画
+ theme: 'light' // 使用浅色主题
+ }
+});
+
+```
+
+
+* **触发动画**:一旦图表被渲染出来,所有的数据点都会自动开始执行`normal`动画。这种动画会在图表存在期间持续循环,除非被显式停止。
+
+
+
+```xml
+// 如果需要暂停所有正在进行的 normal 动画
+chart.pauseAnimation();
+
+// 恢复之前暂停的 normal 动画
+chart.resumeAnimation();
+
+```
+
+
+#### 5. 动画任务的执行
+
+
+
+**IAnimationTask 接口**
+
+
+
+对于复杂的动画序列,VChart引入了`IAnimationTask`接口来描述动画任务的数据结构。每个任务包含时间偏移、动作队列和后继任务列表,形成了一种链式动画执行机制。
+
+
+
+```xml
+interface IAnimationTask {
+ timeOffset: number;
+ actionList: Action[];
+ nextTaskList: IAnimationTask[];
+}
+
+```
+
+
+这种设计使得多个动画任务可以按顺序或并发执行,从而实现更加复杂和细腻的动画效果。对于`normal`动画而言,它可以作为一个独立的任务链的一部分,与其他动画任务一起协同工作。
+
+
+
+#### 6. 示例:创建一个带有 `normal` 动画的散点图
+
+
+
+下面以创建一个带有`normal`动画的散点图为例,说明如何使用VChart的状态动画系统来实现基础流程。
+
+
+
+##### 步骤 1: 定义动画配置
+
+
+
+首先,我们需要定义散点图的基本配置,包括数据源和其他视觉属性。同时,在这里我们也会指定`normal`动画配置,以确保每个数据点都能执行脉冲效果。
+
+
+
+```xml
+const chartSpec = {
+ series: [
+ {
+ type: 'scatter',
+ data: [
+ { x: 10, y: 20 },
+ { x: 20, y: 30 },
+ { x: 30, y: 40 }
+ ],
+ animationNormal: {
+ type: 'pulse',
+ duration: 800,
+ easing: 'easeInOutQuad'
+ }
+ }
+ ]
+};
+
+```
+
+
+##### 步骤 2: 注册动画
+
+
+
+确保所需的`pulse`动画已经被正确注册到系统中。这一步骤通常在项目启动时完成,或者在需要的地方显式调用。
+
+
+
+```xml
+import { Factory } from '@visactor/vchart';
+import { pulseAnimation } from './series/scatter/animation';
+
+Factory.registerAnimation('pulse', pulseAnimation);
+
+```
+
+
+##### 步骤 3: 初始化图表实例
+
+
+
+有了上述配置之后,我们可以初始化一个`VChart`实例,并将配置传递给它。这一步骤会触发图表的渲染过程,并应用相应的动画效果。
+
+
+
+```xml
+import { VChart } from '@visactor/vchart';
+
+const container = document.getElementById('chart-container');
+const chart = new VChart({
+ el: container,
+ spec: chartSpec,
+ options: {
+ animation: true, // 开启动画
+ theme: 'light' // 使用浅色主题
+ }
+});
+
+```
+
+
+##### 步骤 4: 触发 `normal` 动画
+
+
+
+一旦图表被渲染出来,所有的数据点都会自动开始执行`normal`动画。这种动画会在图表存在期间持续循环,除非被显式停止。
+
+
+
+```xml
+// 如果需要暂停所有正在进行的 normal 动画
+chart.pauseAnimation();
+
+// 恢复之前暂停的 normal 动画
+chart.resumeAnimation();
+
+```
+
+
+##### 步骤 5: 动态控制动画
+
+
+
+在某些情况下,你可能想要动态地控制`normal`动画的行为,比如更改动画的速度或样式。VChart提供了灵活的方法来实现这一点。
+
+
+
+```xml
+// 更新某个系列的 normal 动画配置
+chart.updateSeriesOptions(0, {
+ animationNormal: {
+ duration: 1200, // 更改持续时间
+ easing: 'linear' // 更改缓动函数
+ }
+});
+
+// 重新应用新的动画配置
+chart.render();
+
+```
+
+
+#### 7. 动画状态管理
+
+
+
+**状态切换与更新**
+
+
+
+`AnimateManager`不仅管理`normal`动画,还负责处理其他状态下的动画切换。例如,当有新数据加入时,`enter`状态的动画会被触发;当数据更新时,`update`状态的动画生效;而当数据被移除时,则是`exit`状态的动画起作用。
+
+
+
+```xml
+class AnimateManager extends StateManager implements IAnimate {
+ updateAnimateState(state: AnimationStateEnum, noRender?: boolean) {
+ if (state === AnimationStateEnum.update) {
+ // 更新状态下的动画逻辑
+ } else if (state === AnimationStateEnum.appear) {
+ // 出现状态下的动画逻辑
+ } else if (state === AnimationStateEnum.normal) {
+ // normal 状态下的动画逻辑
+ this.updateState(
+ {
+ animationState: {
+ callback: (datum: any, element: IElement) => state
+ }
+ },
+ noRender
+ );
+ }
+ }
+}
+
+```
+
+
+在这个例子中,当元素进入`normal`状态时,`updateAnimateState`方法会更新元素的状态,并触发相应的动画逻辑。这意味着每个数据点都将按照预设的`normal`动画配置执行动画,直到状态再次发生变化。
+
+
+
+#### 8. 动画生命周期管理
+
+
+
+**事件监听与钩子**
+
+
+
+为了更好地管理动画的生命周期,VChart提供了一系列事件监听器和钩子函数。例如,`VGRAMMAR_HOOK_EVENT.AFTER_DO_RENDER`事件可以在图表首次渲染完成后触发,而`VGRAMMAR_HOOK_EVENT.ANIMATION_END`则会在动画结束时触发。
+
+
+
+```xml
+this._event.on(VGRAMMAR_HOOK_EVENT.AFTER_DO_RENDER, () => {
+ this.runAnimationByState(AnimationStateEnum.normal);
+});
+
+this._event.on(VGRAMMAR_HOOK_EVENT.ANIMATION_END, ({ event }) => {
+ if (event.animationState === AnimationStateEnum.appear) {
+ this.runAnimationByState(AnimationStateEnum.normal);
+ }
+});
+
+```
+
+
+这段代码展示了如何在图表渲染完成后立即启动`normal`动画,以及如何在入场动画结束后无缝切换到`normal`动画。这种设计保证了动画之间的平滑过渡,提升了用户体验。
+
+
+
+### 总结
+
+
+
+通过上述步骤,我们详细解读了VChart中`normal`状态动画的实现原理。`normal`动画作为状态动画的一种,主要用于描述图表元素在稳定状态下持续存在的动画效果。VChart通过模块化设计、工厂模式、状态管理器模式以及事件驱动机制,确保了`normal`动画的灵活性和可维护性。开发者可以根据实际需求轻松地定制不同类型的`normal`动画效果,从而增强图表的视觉吸引力和交互体验。
+
+ # 本文档由以下人员修正整理
+ [玄魂](https://github.com/xuanhun)
\ No newline at end of file
diff --git a/docs/assets/contributing/zh/sourcesode/10.4-data-update-animation.md b/docs/assets/contributing/zh/sourcesode/10.4-data-update-animation.md
new file mode 100644
index 0000000000..4cf0c1f827
--- /dev/null
+++ b/docs/assets/contributing/zh/sourcesode/10.4-data-update-animation.md
@@ -0,0 +1,592 @@
+---
+title: 10.4 数据更新动画
+
+key words: VisActor,VChart,VTable,VStrory,VMind,VGrammar,VRender,Visualization,Chart,Data,Table,Graph,Gis,LLM
+---
+## 10.4 数据更新动画
+
+分数:8
+
+1. 更新动画:
+
+1. 代码入口:`packages/vchart/src/animation/`
+
+1. 解读重点:
+
+1. 更新动画的实现
+
+1. 其他参考文档:
+
+https://www.visactor.io/vchart/guide/tutorial_docs/Animation/Animation_Types
+
+https://www.visactor.io/vrender/guide/asd/Basic_Tutorial/Animate
+
+https://visactor.io/vgrammar/guide/guides/animation
+
+[魔力之帧(上):前端图表库动画实现原理一幅生动的可视化作品往往少不了动画的参与。无论是各色各样的图表还是叙事作品,组织周 - 掘金](https://juejin.cn/post/7275270809777520651)
+
+在了解完对特定的图元数据变化时添加变更动画效果之后,我们可以对某个类型的图表中配置系列图元的数据更新动画,满足特定场景时的动画效果。
+
+### 数据更新动画的实现解读
+
+
+
+数据更新动画是指当图表的数据发生变化时,图表元素根据新的数据状态执行的动画效果。在VChart中,这种动画设计得非常灵活,可以应用于新数据加入(`enter`)、现有数据更新(`update`)和旧数据移除(`exit`)三种场景。以下是详细的实现解读。
+
+
+
+#### 1. 动画配置结构
+
+
+
+**IAnimationSpec 接口**
+
+
+
+`IAnimationSpec`接口定义了动画配置的基本结构,其中包含了针对不同状态的动画设置。对于数据更新动画来说,它主要涉及以下三个属性:
+
+
+
+* `animationEnter`:用于描述新数据加入时的动画效果。
+
+* `animationUpdate`:用于描述现有数据更新时的动画效果。
+
+* `animationExit`:用于描述旧数据移除时的动画效果。
+
+
+
+```xml
+interface IAnimationSpec {
+ animationEnter?: boolean | ICommonStateAnimateSpec | IMarkAnimateSpec;
+ animationUpdate?: boolean | ICommonStateAnimateSpec | IMarkAnimateSpec;
+ animationExit?: boolean | ICommonStateAnimateSpec | IMarkAnimateSpec;
+}
+
+```
+
+
+每个属性都可以接受布尔值(启用/禁用)、预设配置对象或自定义配置对象作为参数,从而为开发者提供了高度定制化的可能性。
+
+
+
+#### 2. 动画管理器
+
+
+
+**AnimateManager 类**
+
+
+
+`AnimateManager`类负责管理和协调所有动画的状态。它实现了`IAnimate`接口,并提供了方法来更新和检索动画状态。对于数据更新动画而言,`AnimateManager`会确保这些动画在数据变化时自动触发,并且可以根据需要暂停或恢复。
+
+
+
+```xml
+class AnimateManager extends StateManager implements IAnimate {
+ updateAnimateState(state: AnimationStateEnum, noRender?: boolean) {
+ if (state === AnimationStateEnum.update) {
+ this.updateState(
+ {
+ animationState: {
+ callback: (datum: any, element: IElement) => element.diffState
+ }
+ },
+ noRender
+ );
+ } else if (state === AnimationStateEnum.appear) {
+ // 出现状态下的动画逻辑
+ } else if (state === AnimationStateEnum.exit) {
+ // 退出状态下的动画逻辑
+ }
+ }
+}
+
+```
+
+
+当图表元素进入`update`、`appear`或`exit`状态时,`updateAnimateState`方法会被调用,并将状态传递给内部的状态管理逻辑。这使得所有符合条件的元素都能够执行对应的动画。
+
+
+
+#### 3. 动画配置生成
+
+
+
+**animationConfig 函数**
+
+
+
+为了简化用户配置和默认配置之间的合并过程,VChart提供了一个名为`animationConfig`的辅助函数。该函数遍历所有可能的动画状态,并根据用户提供的配置或默认配置构建出最终的动画配置对象。
+
+
+
+```xml
+function animationConfig(
+ defaultConfig: MarkAnimationSpec = {},
+ userConfig?: Partial | IAnimationConfig | IAnimationConfig[]>>,
+ params?: { dataIndex: (datum: any, params: any) => number; dataCount: () => number; }
+): MarkAnimationSpec {
+ const config = {} as MarkAnimationSpec;
+
+ for (let i = 0; i < AnimationStates.length; i++) {
+ const state = AnimationStates[i];
+ const userStateConfig = userConfig ? userConfig[state] : undefined;
+
+ if (userStateConfig === false) continue;
+
+ if (state === 'enter' || state === 'update' || state === 'exit') {
+ let defaultStateConfig: IAnimationConfig[];
+ if (isArray(defaultConfig[state])) {
+ defaultStateConfig = defaultConfig[state] as IAnimationConfig[];
+ } else {
+ defaultStateConfig = [{ ...DEFAULT_ANIMATION_CONFIG[state], ...defaultConfig[state] } as any];
+ }
+
+ config[state] = defaultStateConfig;
+ }
+ }
+
+ return config;
+}
+
+```
+
+
+此函数处理了`enter`、`update`和`exit`状态下的动画配置合并,确保用户提供的配置能够正确应用到具体的图元上。如果用户没有提供自定义的动画配置,则使用默认配置。
+
+
+
+#### 4. 数据更新动画的具体实现
+
+
+
+以柱状图为例,假设我们希望为新加入的数据点添加淡入效果,为更新的数据点添加缩放效果,为移除的数据点添加淡出效果。以下是详细的实现步骤:
+
+
+
+* **定义动画配置**:首先,在图表配置中为柱状图系列指定`animationEnter`、`animationUpdate`和`animationExit`配置。这里我们可以选择内置的动画类型,并调整其持续时间和缓动函数。
+
+
+
+```xml
+const chartSpec = {
+ series: [
+ {
+ type: 'bar',
+ data: [/* 初始数据数组 */],
+ animationEnter: {
+ type: 'fadeIn', // 新数据点淡入
+ duration: 800,
+ easing: 'easeInOutQuad'
+ },
+ animationUpdate: {
+ type: 'scaleIn', // 更新数据点缩放
+ duration: 500,
+ easing: 'easeInOutQuad'
+ },
+ animationExit: {
+ type: 'fadeOut', // 移除数据点淡出
+ duration: 600,
+ easing: 'easeInOutQuad'
+ }
+ }
+ ]
+};
+
+```
+
+
+* **注册动画**:接下来,我们需要确保所需的动画已经被正确注册到系统中。这一步骤通常在项目启动时完成,或者在需要的地方显式调用。
+
+
+
+```xml
+import { Factory } from '@visactor/vchart';
+import { Appear_FadeIn, ScaleInOutAnimation, Appear_FadeOut } from './series/bar/animation';
+
+// 注册淡入动画
+Factory.registerAnimation('fadeIn', Appear_FadeIn);
+
+// 注册缩放动画
+Factory.registerAnimation('scaleIn', ScaleInOutAnimation);
+
+// 注册淡出动画
+Factory.registerAnimation('fadeOut', Appear_FadeOut);
+
+```
+
+
+ 这里的`Appear_FadeIn`、`ScaleInOutAnimation`和`Appear_FadeOut`函数分别定义了淡入、缩放和淡出动画的具体逻辑,例如如何改变图形元素的透明度或尺寸。
+
+
+
+* **初始化图表实例**:有了上述配置之后,我们可以初始化一个`VChart`实例,并将配置传递给它。这会触发图表的渲染过程,并应用相应的动画效果。
+
+
+
+```xml
+import { VChart } from '@visactor/vchart';
+
+const container = document.getElementById('chart-container');
+const chart = new VChart({
+ el: container,
+ spec: chartSpec,
+ options: {
+ animation: true, // 开启动画
+ theme: 'light' // 使用浅色主题
+ }
+});
+
+```
+
+
+* **触发动画**:一旦图表被渲染出来,任何数据的变化都会自动触发动画。例如,当有新的数据加入时,`animationEnter`配置就会生效;当数据更新时,`animationUpdate`配置生效;而当数据被移除时,则是`animationExit`配置起作用。
+
+
+
+```xml
+// 假设一段时间后需要更新数据
+setTimeout(() => {
+ const newData = [/* 新的数据数组 */];
+ chart.updateSeriesData(newData);
+}, 5000);
+
+```
+
+
+#### 5. 动画任务的执行
+
+
+
+**IAnimationTask 接口**
+
+
+
+对于复杂的动画序列,VChart引入了`IAnimationTask`接口来描述动画任务的数据结构。每个任务包含时间偏移、动作队列和后继任务列表,形成了一种链式动画执行机制。
+
+
+
+```xml
+interface IAnimationTask {
+ timeOffset: number;
+ actionList: Action[];
+ nextTaskList: IAnimationTask[];
+}
+
+```
+
+
+这种设计使得多个动画任务可以按顺序或并发执行,从而实现更加复杂和细腻的动画效果。对于数据更新动画而言,它可以作为一个独立的任务链的一部分,与其他动画任务一起协同工作。
+
+
+
+#### 6. 示例:创建带有数据更新动画的柱状图
+
+
+
+下面以创建一个带有数据更新动画的柱状图为例,说明如何使用VChart的数据更新动画系统来实现基础流程。
+
+
+
+##### 步骤 1: 定义动画配置
+
+
+
+首先,我们需要定义柱状图的基本配置,包括数据源和其他视觉属性。同时,在这里我们也会指定`animationEnter`、`animationUpdate`和`animationExit`配置,以确保在数据变化时能够触发相应的动画效果。
+
+
+
+```xml
+const chartSpec = {
+ series: [
+ {
+ type: 'bar',
+ data: [
+ { value: 10 },
+ { value: 20 },
+ { value: 30 }
+ ],
+ animationEnter: {
+ type: 'fadeIn',
+ duration: 800,
+ easing: 'easeInOutQuad'
+ },
+ animationUpdate: {
+ type: 'scaleIn',
+ duration: 500,
+ easing: 'easeInOutQuad'
+ },
+ animationExit: {
+ type: 'fadeOut',
+ duration: 600,
+ easing: 'easeInOutQuad'
+ }
+ }
+ ]
+};
+
+```
+
+
+##### 步骤 2: 注册动画
+
+
+
+确保所需的动画已经被正确注册到系统中。这一步骤通常在项目启动时完成,或者在需要的地方显式调用。
+
+
+
+```xml
+import { Factory } from '@visactor/vchart';
+import { Appear_FadeIn, ScaleInOutAnimation, Appear_FadeOut } from './series/bar/animation';
+
+Factory.registerAnimation('fadeIn', Appear_FadeIn);
+Factory.registerAnimation('scaleIn', ScaleInOutAnimation);
+Factory.registerAnimation('fadeOut', Appear_FadeOut);
+
+```
+
+
+##### 步骤 3: 初始化图表实例
+
+
+
+有了上述配置之后,我们可以初始化一个`VChart`实例,并将配置传递给它。这一步骤会触发图表的渲染过程,并应用相应的动画效果。
+
+
+
+```xml
+import { VChart } from '@visactor/vchart';
+
+const container = document.getElementById('chart-container');
+const chart = new VChart({
+ el: container,
+ spec: chartSpec,
+ options: {
+ animation: true, // 开启动画
+ theme: 'light' // 使用浅色主题
+ }
+});
+
+```
+
+
+##### 步骤 4: 触发数据更新动画
+
+
+
+一旦图表被渲染出来,任何数据的变化都会自动触发动画。例如,当有新的数据加入时,`animationEnter`配置会生效;当数据更新时,`animationUpdate`配置生效;而当数据被移除时,则是`animationExit`配置起作用。
+
+
+
+```xml
+// 模拟数据更新
+setTimeout(() => {
+ const updatedData = [
+ { value: 15 }, // 更新第一个数据点
+ { value: 25 }, // 更新第二个数据点
+ { value: 35 }, // 更新第三个数据点
+ { value: 45 } // 添加一个新的数据点
+ ];
+
+ // 更新图表数据并触发动画
+ chart.updateSeriesData(updatedData);
+}, 5000);
+
+```
+
+
+在这个例子中,`updateSeriesData`方法会触发一系列动画:
+
+* 对于新加入的数据点(第四个数据点),`animationEnter`配置会使其以淡入的方式逐渐显现。
+
+* 对于已存在的数据点(前三个数据点),`animationUpdate`配置会根据新的数据值调整它们的大小,并以缩放的方式过渡。
+
+* 如果有数据点被移除,则`animationExit`配置会使其以淡出的方式消失。
+
+
+
+##### 步骤 5: 动态控制动画
+
+
+
+在某些情况下,你可能想要动态地控制数据更新动画的行为,比如更改动画的速度或样式。VChart提供了灵活的方法来实现这一点。
+
+
+
+```xml
+// 更新某个系列的数据更新动画配置
+chart.updateSeriesOptions(0, {
+ animationEnter: {
+ duration: 1000, // 更改淡入动画的持续时间
+ easing: 'linear' // 更改缓动函数
+ },
+ animationUpdate: {
+ duration: 700, // 更改缩放动画的持续时间
+ easing: 'easeInOutCubic' // 更改缓动函数
+ },
+ animationExit: {
+ duration: 900, // 更改淡出动画的持续时间
+ easing: 'easeInOutCubic' // 更改缓动函数
+ }
+});
+
+// 重新应用新的动画配置
+chart.render();
+
+```
+
+
+#### 7. 动画生命周期管理
+
+
+
+**事件监听与钩子**
+
+
+
+为了更好地管理动画的生命周期,VChart提供了一系列事件监听器和钩子函数。例如,`VGRAMMAR_HOOK_EVENT.AFTER_DO_RENDER`事件可以在图表首次渲染完成后触发,而`VGRAMMAR_HOOK_EVENT.ANIMATION_END`则会在动画结束时触发。
+
+
+
+```xml
+this._event.on(VGRAMMAR_HOOK_EVENT.AFTER_DO_RENDER, () => {
+ // 图表首次渲染完成后的逻辑
+});
+
+this._event.on(VGRAMMAR_HOOK_EVENT.ANIMATION_END, ({ event }) => {
+ if (event.animationState === AnimationStateEnum.enter) {
+ // enter 动画结束后的逻辑
+ } else if (event.animationState === AnimationStateEnum.update) {
+ // update 动画结束后的逻辑
+ } else if (event.animationState === AnimationStateEnum.exit) {
+ // exit 动画结束后的逻辑
+ }
+});
+
+```
+
+
+这段代码展示了如何在不同的动画阶段执行特定的逻辑,保证动画之间的平滑过渡,提升用户体验。
+
+
+
+#### 8. 差异检测与动画触发
+
+
+
+**差异检测**
+
+
+
+在数据更新过程中,VChart会自动进行差异检测,识别哪些数据点是新增的、更新的或移除的。基于这些信息,`AnimateManager`会触发相应的动画。
+
+
+
+```xml
+if (state === AnimationStateEnum.update) {
+ this.updateState(
+ {
+ animationState: {
+ callback: (datum: any, element: IElement) => element.diffState
+ }
+ },
+ noRender
+ );
+}
+
+```
+
+
+这里的`diffState`属性表示元素的状态变化类型,如`enter`、`update`或`exit`。`AnimateManager`会根据这个属性来决定应用哪种类型的动画。
+
+
+
+#### 9. 动画的具体实现
+
+
+
+**具体动画函数**
+
+
+
+每个具体的动画函数(如`Appear_FadeIn`、`ScaleInOutAnimation`和`Appear_FadeOut`)定义了动画的具体行为。例如,`Appear_FadeIn`函数可能如下所示:
+
+
+
+```xml
+export const Appear_FadeIn: IAnimationTypeConfig = {
+ type: 'fadeIn',
+ duration: 800,
+ easing: 'easeInOutQuad',
+ channel: {
+ opacity: { from: 0, to: 1 }
+ }
+};
+
+```
+
+
+这段代码定义了一个淡入动画,通过调整图形元素的`opacity`属性从0变到1来实现视觉上的淡入效果。
+
+
+
+#### 10. 动画状态管理
+
+
+
+**状态切换与更新**
+
+
+
+`AnimateManager`不仅管理`normal`动画,还负责处理其他状态下的动画切换。例如,当有新数据加入时,`enter`状态的动画会被触发;当数据更新时,`update`状态的动画生效;而当数据被移除时,则是`exit`状态的动画起作用。
+
+
+
+```xml
+class AnimateManager extends StateManager implements IAnimate {
+ updateAnimateState(state: AnimationStateEnum, noRender?: boolean) {
+ if (state === AnimationStateEnum.update) {
+ this.updateState(
+ {
+ animationState: {
+ callback: (datum: any, element: IElement) => element.diffState
+ }
+ },
+ noRender
+ );
+ } else if (state === AnimationStateEnum.appear) {
+ // appear 状态下的动画逻辑
+ } else if (state === AnimationStateEnum.exit) {
+ // exit 状态下的动画逻辑
+ }
+ }
+}
+
+```
+
+
+当图表元素进入`update`、`appear`或`exit`状态时,`updateAnimateState`方法会被调用,并将状态传递给内部的状态管理逻辑。这使得所有符合条件的元素都能够执行对应的动画。
+
+
+
+### 总结
+
+
+
+通过上述步骤,我们详细解读了VChart中数据更新动画的实现原理。VChart的数据更新动画系统设计巧妙地结合了工厂模式、状态管理器模式以及模块化的动画配置,不仅提供了丰富的内置动画效果,还支持高度定制化的需求。开发者可以根据实际应用场景灵活配置和组合不同的动画,创造出既美观又实用的可视化效果。具体来说:
+
+
+
+* `**animationEnter**`:适用于新数据点的入场动画,如淡入、生长等。
+
+* `**animationUpdate**`:适用于现有数据点的更新动画,如缩放、颜色渐变等。
+
+* `**animationExit**`:适用于旧数据点的退场动画,如淡出、缩小等。
+
+
+
+这种设计确保了在数据变化时,图表能够以平滑且直观的方式呈现给用户,提升了交互体验和视觉吸引力。
+
+ # 本文档由以下人员修正整理
+ [玄魂](https://github.com/xuanhun)
\ No newline at end of file
diff --git a/docs/assets/contributing/zh/sourcesode/10.5-animation-orchestration.md b/docs/assets/contributing/zh/sourcesode/10.5-animation-orchestration.md
new file mode 100644
index 0000000000..6cbcdb9e37
--- /dev/null
+++ b/docs/assets/contributing/zh/sourcesode/10.5-animation-orchestration.md
@@ -0,0 +1,2363 @@
+---
+title: 10.5 动画编排
+
+key words: VisActor,VChart,VTable,VStrory,VMind,VGrammar,VRender,Visualization,Chart,Data,Table,Graph,Gis,LLM
+---
+## 10.5 动画编排
+
+分数:4
+
+1. 全局动画:
+
+1. 代码入口:`packages/vchart/src/animation/`
+
+1. 解读重点:
+
+1. 动画编排的实现
+
+1. 其他参考文档:
+
+https://www.visactor.io/vchart/guide/tutorial_docs/Animation/Animation_Types
+
+https://www.visactor.io/vrender/guide/asd/Basic_Tutorial/Animate
+
+https://visactor.io/vgrammar/guide/guides/animation
+
+[魔力之帧(上):前端图表库动画实现原理一幅生动的可视化作品往往少不了动画的参与。无论是各色各样的图表还是叙事作品,组织周 - 掘金](https://juejin.cn/post/7275270809777520651)
+
+VChart 源码中的动画编排主要围绕着生成和配置动画,以实现不同状态下的动画效果。下面我们从几个关键函数和类型定义来解读其实现:
+
+1. 类型定义与常量
+
+utils.ts
+
+Apply
+
+* // 导入各种类型和常量
+import type { IAnimationConfig } from '@visactor/vgrammar-core';
+// ... 其他导入 ...
+/**
+定义动画状态的数组,包括默认动画配置中的所有键和 'normal'
+ */
+export const AnimationStates = [...Object.keys(DEFAULT_ANIMATION_CONFIG), 'normal'];
+
+* 类型导入:从不同的模块导入了多种类型,如 `IAnimationConfig`、`IElement` 等,这些类型用于定义动画配置、元素等,确保代码的类型安全。
+
+* `AnimationStates` 常量:包含了所有可能的动画状态,包括默认动画配置中的状态和 `'normal'` 状态,用于后续遍历和处理不同状态的动画配置。
+
+1. 生成动画配置
+
+utils.ts
+
+```xml
+export function animationConfig(
+ defaultConfig: MarkAnimationSpec = {},
+ userConfig?: Partial<
+ Record | IAnimationConfig | IAnimationConfig[]>
+ >,
+ params?: {
+ dataIndex: (datum: any, params: any) => number;
+ dataCount: () => number;
+ }
+) {
+ // ... 函数实现 ...
+}
+
+```
+* 参数:
+
+* `defaultConfig`:默认的动画配置。
+
+* `userConfig`:用户自定义的动画配置,可能是部分状态的配置。
+
+* `params`:包含数据索引和数据计数函数的参数。
+
+* 实现逻辑:
+
+1. 创建一个空对象 `config` 来存储最终的动画配置。
+
+1. 遍历 `AnimationStates` 数组,处理每个动画状态的配置。
+
+1. 根据用户配置和默认配置,合并或覆盖相应状态的动画配置。
+
+1. 对于 `'exit'` 状态,设置控制选项 `stopWhenStateChange: true`。
+
+1. 处理用户配置中的 `oneByOne` 选项,生成逐个执行的动画配置。
+
+1. 返回最终的动画配置。
+
+1. 生成用户动画配置
+
+utils.ts
+
+```xml
+export function userAnimationConfig(
+ markName: SeriesMarkNameEnum | string,
+ spec: IAnimationSpec,
+ ctx: IModelMarkAttributeContext
+) {
+ // ... 函数实现 ...
+}
+
+```
+* 参数:
+
+* `markName`:标记名称。
+
+* `spec`:动画规范。
+
+* `ctx`:模型标记属性上下文。
+
+* 实现逻辑:
+
+1. 创建一个空对象 `userConfig` 来存储用户动画配置。
+
+1. 根据 `spec` 中的不同动画配置(如 `animationAppear`、`animationDisappear` 等),将相应的配置赋值给 `userConfig`。
+
+1. 调用 `uniformAnimationConfig` 函数统一动画配置。
+
+1. 返回生成的用户动画配置。
+
+1. 逐个执行动画配置
+
+utils.ts
+
+```xml
+function produceOneByOne(
+ stateConfig: IAnimationTypeConfig,
+ dataIndex: (datum: any, params: any) => number,
+ dataCount?: () => number
+) {
+ // ... 函数实现 ...
+}
+
+```
+* 参数:
+
+* `stateConfig`:动画类型的配置对象。
+
+* `dataIndex`:返回数据项在动画序列中的索引的函数。
+
+* `dataCount`:可选函数,返回数据项的总数。
+
+* 实现逻辑:
+
+1. 解构 `stateConfig` 中的 `oneByOne`、`duration`、`delay` 和 `delayAfter` 配置。
+
+1. 配置元素出现前的延迟时间 `delay`,根据数据项索引和动画参数计算延迟时间。
+
+1. 配置元素出现后的延迟时间 `delayAfter`,同样根据数据项索引和动画参数计算延迟时间。
+
+1. 移除不再需要的 `oneByOne` 参数。
+
+1. 返回更新后的动画配置对象。
+
+1. 其他辅助函数
+
+* `defaultDataIndex`:根据数据项或动画参数获取默认的数据索引。
+
+* `shouldMarkDoMorph`:判断指定的标记是否应该进行形态变形动画。
+
+* `isTimeLineAnimation` 和 `isChannelAnimation`:判断动画配置是否为时间线动画或通道动画。
+
+* `uniformAnimationConfig`:统一动画配置,处理和转换配置中的函数。
+
+* `traverseSpec`:遍历并转换给定的对象或数组,应用提供的转换函数。
+
+* `isAnimationEnabledForSeries`:判断系列是否启用了动画,根据系列规格、区域动画属性和数据量进行检查。
+
+### 总结
+
+VChart 的动画编排实现主要通过一系列函数和类型定义,将默认配置和用户配置进行合并和处理,生成最终的动画配置。同时,提供了逐个执行动画、形态变形动画等功能,以及判断动画是否启用的逻辑,确保动画在不同场景下的灵活性和可配置性。
+
+
+
+### 动画编排的实现解读
+
+
+
+动画编排是指将多个动画任务按照一定的顺序或条件组合起来,形成一个连贯且复杂的动画序列。在VChart中,动画编排的设计允许开发者创建多阶段、多元素协同工作的动画效果,从而提升图表的视觉表现力和用户体验。以下是详细的实现解读。
+
+
+
+#### 1. 动画编排的概念
+
+
+
+**动画编排**(Animation Arrangement)是通过精心设计的动画序列来增强数据可视化的效果。它不仅仅是简单的动画叠加,而是考虑到了动画之间的协调性、时间线管理以及状态转换等因素。VChart提供了灵活的工具来实现动画编排,包括但不限于:
+
+
+
+* **链式动画**:多个动画按顺序依次执行。
+
+* **并行动画**:多个动画同时执行。
+
+* **条件触发**:根据特定条件触发某些动画。
+
+* **事件驱动**:基于用户交互或其他事件触发动画。
+
+
+
+#### 2. 动画配置结构
+
+
+
+**IAnimationSpec 接口**
+
+
+
+`IAnimationSpec`接口定义了动画配置的基本结构,其中包含了针对不同状态的动画设置。对于动画编排来说,它主要涉及以下属性:
+
+
+
+* `animationState`:用于描述状态切换动画,可以用来构建复杂的动画序列。
+
+* `animationNormal`:用于描述持续存在的循环动画,可以在动画编排中作为背景动画使用。
+
+
+
+```xml
+interface IAnimationSpec {
+ animationState?: boolean | IStateAnimationConfig;
+ animationNormal?: IMarkAnimateSpec;
+}
+
+```
+
+
+每个属性都可以接受布尔值(启用/禁用)、预设配置对象或自定义配置对象作为参数,从而为开发者提供了高度定制化的可能性。
+
+
+
+#### 3. 动画任务接口
+
+
+
+**IAnimationTask 接口**
+
+
+
+为了支持复杂的动画编排,VChart引入了`IAnimationTask`接口来描述动画任务的数据结构。每个任务包含时间偏移、动作队列和后继任务列表,形成了一种链式动画执行机制。
+
+
+
+```xml
+interface IAnimationTask {
+ timeOffset: number; // 时间偏移量,表示该任务相对于前一个任务的延迟时间
+ actionList: Action[]; // 动作队列,包含一系列动画操作
+ nextTaskList: IAnimationTask[]; // 后继任务列表,表示后续要执行的任务
+}
+
+```
+
+
+这种设计使得多个动画任务可以按顺序或并发执行,从而实现更加复杂和细腻的动画效果。
+
+
+
+#### 4. 动画编排的具体实现
+
+
+
+以创建一个带有动画编排的柱状图为例,假设我们希望实现如下效果:
+
+* 当页面加载时,所有柱子从底部向上生长;
+
+* 柱子生长完成后,顶部添加一个脉冲效果,吸引用户的注意力;
+
+* 如果有新数据加入,新柱子以淡入的方式进入,并且现有柱子轻微缩放以示变化。
+
+
+
+##### 步骤 1: 定义动画配置
+
+
+
+首先,在图表配置中为柱状图系列指定`animationAppear`、`animationEnter`、`animationUpdate`等配置。这里我们可以选择内置的动画类型,并调整其持续时间和缓动函数。
+
+
+
+```xml
+const chartSpec = {
+ series: [
+ {
+ type: 'bar',
+ data: [/* 初始数据数组 */],
+ animationAppear: {
+ type: 'growCenterIn', // 柱子从中心向外生长
+ duration: 1000,
+ easing: 'easeInOutQuad'
+ },
+ animationNormal: {
+ type: 'pulse', // 生长完成后顶部添加脉冲效果
+ duration: 800,
+ easing: 'easeInOutQuad'
+ },
+ animationEnter: {
+ type: 'fadeIn', // 新数据点淡入
+ duration: 800,
+ easing: 'easeInOutQuad'
+ },
+ animationUpdate: {
+ type: 'scaleIn', // 更新数据点缩放
+ duration: 500,
+ easing: 'easeInOutQuad'
+ }
+ }
+ ]
+};
+
+```
+
+
+##### 步骤 2: 注册动画
+
+
+
+确保所需的动画已经被正确注册到系统中。这一步骤通常在项目启动时完成,或者在需要的地方显式调用。
+
+
+
+```xml
+import { Factory } from '@visactor/vchart';
+import { Appear_Grow, pulseAnimation, Appear_FadeIn, ScaleInOutAnimation } from './series/bar/animation';
+
+// 注册柱子生长动画
+Factory.registerAnimation('growCenterIn', Appear_Grow);
+
+// 注册脉冲动画
+Factory.registerAnimation('pulse', pulseAnimation);
+
+// 注册淡入动画
+Factory.registerAnimation('fadeIn', Appear_FadeIn);
+
+// 注册缩放动画
+Factory.registerAnimation('scaleIn', ScaleInOutAnimation);
+
+```
+
+
+##### 步骤 3: 初始化图表实例
+
+
+
+有了上述配置之后,我们可以初始化一个`VChart`实例,并将配置传递给它。这会触发图表的渲染过程,并应用相应的动画效果。
+
+
+
+```xml
+import { VChart } from '@visactor/vchart';
+
+const container = document.getElementById('chart-container');
+const chart = new VChart({
+ el: container,
+ spec: chartSpec,
+ options: {
+ animation: true, // 开启动画
+ theme: 'light' // 使用浅色主题
+ }
+});
+
+```
+
+
+##### 步骤 4: 构建动画编排
+
+
+
+为了实现动画编排,我们需要构建一个包含多个动画任务的任务链。每个任务可以是一个单独的动画,也可以是一个复合动画(即包含多个子任务)。以下是具体的实现步骤:
+
+
+
+* **定义动画任务**:首先,定义每个独立的动画任务,包括它们的时间偏移、动作队列和后继任务列表。
+
+
+
+```xml
+const appearTask: IAnimationTask = {
+ timeOffset: 0,
+ actionList: [{ type: 'growCenterIn', duration: 1000 }],
+ nextTaskList: [normalTask]
+};
+
+const normalTask: IAnimationTask = {
+ timeOffset: 0,
+ actionList: [{ type: 'pulse', duration: 800, loop: true }],
+ nextTaskList: []
+};
+
+const enterTask: IAnimationTask = {
+ timeOffset: 0,
+ actionList: [{ type: 'fadeIn', duration: 800 }],
+ nextTaskList: []
+};
+
+const updateTask: IAnimationTask = {
+ timeOffset: 0,
+ actionList: [{ type: 'scaleIn', duration: 500 }],
+ nextTaskList: []
+};
+
+```
+
+
+* **组合动画任务**:接下来,将这些任务组合成一个完整的动画编排。例如,我们可以创建一个包含入场动画和正常状态下动画的任务链。
+
+
+
+```xml
+const animationArrangement: IAnimationTask = {
+ timeOffset: 0,
+ actionList: [],
+ nextTaskList: [appearTask, normalTask]
+};
+
+```
+
+
+##### 步骤 5: 触发数据更新动画
+
+
+
+一旦图表被渲染出来,任何数据的变化都会自动触发动画。例如,当有新的数据加入时,`enter`任务会被触发;当数据更新时,`update`任务生效;而当数据被移除时,则是`exit`任务起作用。
+
+
+
+```xml
+// 模拟数据更新
+setTimeout(() => {
+ const updatedData = [
+ { value: 15 }, // 更新第一个数据点
+ { value: 25 }, // 更新第二个数据点
+ { value: 35 }, // 更新第三个数据点
+ { value: 45 } // 添加一个新的数据点
+ ];
+
+ // 更新图表数据并触发动画
+ chart.updateSeriesData(updatedData);
+}, 5000);
+
+```
+
+
+在这个例子中,`updateSeriesData`方法会触发一系列动画:
+
+* 对于新加入的数据点(第四个数据点),`enter`任务会使其以淡入的方式逐渐显现。
+
+* 对于已存在的数据点(前三个数据点),`update`任务会根据新的数据值调整它们的大小,并以缩放的方式过渡。
+
+
+
+##### 步骤 6: 动态控制动画编排
+
+
+
+在某些情况下,你可能想要动态地控制动画编排的行为,比如更改动画的速度或样式。VChart提供了灵活的方法来实现这一点。
+
+
+
+```xml
+// 更新某个系列的动画编排配置
+chart.updateSeriesOptions(0, {
+ animationAppear: {
+ type: 'growCenterIn',
+ duration: 1200, // 更改持续时间
+ easing: 'linear' // 更改缓动函数
+ },
+ animationNormal: {
+ type: 'pulse',
+ duration: 1000, // 更改持续时间
+ easing: 'easeInOutCubic' // 更改缓动函数
+ }
+});
+
+// 重新应用新的动画配置
+chart.render();
+
+```
+
+
+#### 5. 动画编排的内部实现
+
+
+
+**AnimateManager 类**
+
+
+
+`AnimateManager`类负责管理和协调所有动画的状态。它实现了`IAnimate`接口,并提供了方法来更新和检索动画状态。对于动画编排而言,`AnimateManager`会确保这些动画任务按照预定的顺序或条件执行。
+
+
+
+```xml
+class AnimateManager extends StateManager implements IAnimate {
+ updateAnimateState(state: AnimationStateEnum, noRender?: boolean) {
+ if (state === AnimationStateEnum.appear) {
+ this.updateState(
+ {
+ animationState: {
+ callback: (datum: any, element: IElement) => state
+ }
+ },
+ noRender
+ );
+ } else if (state === AnimationStateEnum.normal) {
+ this.updateState(
+ {
+ animationState: {
+ callback: (datum: any, element: IElement) => state
+ }
+ },
+ noRender
+ );
+ }
+ }
+
+ // 动画编排逻辑
+ arrangeAnimations(tasks: IAnimationTask[]) {
+ tasks.forEach(task => {
+ // 执行当前任务的动作队列
+ task.actionList.forEach(action => {
+ this.executeAction(action);
+ });
+
+ // 如果存在后继任务,则递归执行
+ if (task.nextTaskList && task.nextTaskList.length > 0) {
+ setTimeout(() => {
+ this.arrangeAnimations(task.nextTaskList);
+ }, task.timeOffset);
+ }
+ });
+ }
+
+ private executeAction(action: Action) {
+ // 根据action.type获取对应的动画配置
+ const animationConfig = Factory.getAnimationInKey(action.type);
+
+ // 应用动画配置到目标元素
+ this.applyAnimation(animationConfig, action.duration, action.easing);
+ }
+
+ private applyAnimation(config: MarkAnimationSpec, duration: number, easing: string) {
+ // 实际应用动画的逻辑
+ }
+}
+
+```
+
+
+这段代码展示了如何通过`arrangeAnimations`方法来执行一组动画任务。每个任务中的动作队列会被逐一执行,然后根据`timeOffset`属性递归地处理后继任务。这样就可以构建出一个有序的动画序列,实现复杂的动画编排效果。
+
+
+
+#### 6. 动画编排的高级特性
+
+
+
+**条件触发与事件监听**
+
+
+
+为了增加动画编排的灵活性,VChart还提供了条件触发和事件监听的功能。例如,可以通过监听用户交互事件(如点击、悬停)来触发动画,或者根据特定条件(如数据阈值)动态调整动画行为。
+
+
+
+```xml
+// 监听用户交互事件
+chart.on('element:click', (event) => {
+ const element = event.detail.element;
+ if (element) {
+ // 根据点击事件触发动画
+ this.triggerCustomAnimation(element);
+ }
+});
+
+// 条件触发动画
+if (someCondition) {
+ // 触发特定条件下的动画
+ this.triggerConditionalAnimation();
+}
+
+```
+
+
+**并行动画**
+
+
+
+有时,我们希望多个动画能够同时发生,而不是依次等待。VChart支持并行动画,允许开发者定义多个动画任务在同一时刻开始执行。
+
+
+
+```xml
+const parallelTasks: IAnimationTask[] = [
+ {
+ timeOffset: 0,
+ actionList: [{ type: 'growCenterIn', duration: 1000 }],
+ nextTaskList: []
+ },
+ {
+ timeOffset: 0,
+ actionList: [{ type: 'pulse', duration: 800, loop: true }],
+ nextTaskList: []
+ }
+];
+
+this.arrangeAnimations(parallelTasks);
+
+```
+
+
+**延时与间隔**
+
+
+
+通过设置`timeOffset`属性,可以控制动画任务之间的延迟时间。此外,还可以使用`setInterval`或`setTimeout`来实现更复杂的定时逻辑。
+
+
+
+```xml
+// 设置延时
+const delayedTask: IAnimationTask = {
+ timeOffset: 500, // 延迟500毫秒后执行
+ actionList: [{ type: 'pulse', duration: 800, loop: true }],
+ nextTaskList: []
+};
+
+this.arrangeAnimations([delayedTask]);
+
+// 使用 setInterval 实现周期性动画
+setInterval(() => {
+ this.triggerPeriodicAnimation();
+}, 2000); // 每2秒触发一次
+
+```
+
+
+#### 7. 示例:创建一个带有动画编排的柱状图
+
+
+
+下面以创建一个带有动画编排的柱状图为例,说明如何使用VChart的动画编排系统来实现基础流程。
+
+### 示例:创建一个带有动画编排的柱状图
+
+
+
+在VChart中,动画编排是指通过组合和序列化多个动画效果,以实现复杂且协调的视觉效果。通过合理的动画编排,可以显著提升图表的交互性和用户体验。下面我们将详细展示如何创建一个带有动画编排的柱状图,包括新数据点的入场动画、现有数据点的更新动画以及旧数据点的退场动画。
+
+
+
+#### 1. 定义动画配置
+
+
+
+首先,我们需要定义柱状图的基本配置,并为每个动画状态(`enter`、`update`、`exit`)指定具体的动画效果。为了实现复杂的动画编排,我们可以使用链式动画任务来定义每个状态下的具体动画序列。
+
+
+
+```xml
+const chartSpec = {
+ series: [
+ {
+ type: 'bar',
+ data: [
+ { category: 'A', value: 10 },
+ { category: 'B', value: 20 },
+ { category: 'C', value: 30 }
+ ],
+ animationEnter: {
+ type: 'fadeIn',
+ duration: 800,
+ easing: 'easeInOutQuad',
+ nextTaskList: [
+ {
+ timeOffset: 800,
+ actionList: [
+ { type: 'growCenterIn', duration: 500, easing: 'easeInOutQuad' }
+ ],
+ nextTaskList: [
+ {
+ timeOffset: 500,
+ actionList: [
+ { type: 'pulse', duration: 300, easing: 'easeInOutQuad' }
+ ]
+ }
+ ]
+ }
+ ]
+ },
+ animationUpdate: {
+ type: 'scaleIn',
+ duration: 500,
+ easing: 'easeInOutQuad'
+ },
+ animationExit: {
+ type: 'fadeOut',
+ duration: 600,
+ easing: 'easeInOutQuad'
+ }
+ }
+ ]
+};
+
+```
+
+
+在这个配置中:
+
+* `**animationEnter**`:新数据点先淡入(`fadeIn`),然后从中心向外生长(`growCenterIn`),最后轻微脉冲(`pulse`)。
+
+* `**animationUpdate**`:现有数据点在更新时以缩放的方式过渡。
+
+* `**animationExit**`:旧数据点以淡出的方式消失。
+
+
+
+#### 2. 注册动画
+
+
+
+接下来,我们需要确保所需的动画已经被正确注册到系统中。这一步骤通常在项目启动时完成,或者在需要的地方显式调用。
+
+
+
+```xml
+import { Factory } from '@visactor/vchart';
+import { Appear_FadeIn, ScaleInOutAnimation, Appear_FadeOut, growCenterIn, pulseAnimation } from './series/bar/animation';
+
+// 注册淡入动画
+Factory.registerAnimation('fadeIn', Appear_FadeIn);
+
+// 注册缩放动画
+Factory.registerAnimation('scaleIn', ScaleInOutAnimation);
+
+// 注册淡出动画
+Factory.registerAnimation('fadeOut', Appear_FadeOut);
+
+// 注册中心生长动画
+Factory.registerAnimation('growCenterIn', growCenterIn);
+
+// 注册脉冲动画
+Factory.registerAnimation('pulse', pulseAnimation);
+
+```
+
+
+这些动画函数分别定义了淡入、缩放、淡出、中心生长和脉冲动画的具体逻辑。例如,`Appear_FadeIn`函数可能如下所示:
+
+
+
+```xml
+export const Appear_FadeIn: IAnimationTypeConfig = {
+ type: 'fadeIn',
+ duration: 800,
+ easing: 'easeInOutQuad',
+ channel: {
+ opacity: { from: 0, to: 1 }
+ }
+};
+
+export const growCenterIn: IAnimationTypeConfig = {
+ type: 'growCenterIn',
+ duration: 500,
+ easing: 'easeInOutQuad',
+ channel: {
+ width: { from: 0, to: '100%' },
+ height: { from: 0, to: '100%' }
+ }
+};
+
+export const pulseAnimation: IAnimationTypeConfig = {
+ type: 'pulse',
+ duration: 300,
+ easing: 'easeInOutQuad',
+ channel: {
+ scale: { from: 1, to: 1.1, toBack: 1 }
+ }
+};
+
+```
+
+
+#### 3. 初始化图表实例
+
+
+
+有了上述配置之后,我们可以初始化一个`VChart`实例,并将配置传递给它。这会触发图表的渲染过程,并应用相应的动画效果。
+
+
+
+```xml
+import { VChart } from '@visactor/vchart';
+
+const container = document.getElementById('chart-container');
+const chart = new VChart({
+ el: container,
+ spec: chartSpec,
+ options: {
+ animation: true, // 开启动画
+ theme: 'light' // 使用浅色主题
+ }
+});
+
+```
+
+
+#### 4. 触发动画
+
+
+
+一旦图表被渲染出来,任何数据的变化都会自动触发动画。例如,当有新的数据加入时,`animationEnter`配置会生效;当数据更新时,`animationUpdate`配置生效;而当数据被移除时,则是`animationExit`配置起作用。
+
+
+
+```xml
+// 模拟数据更新
+setTimeout(() => {
+ const updatedData = [
+ { category: 'A', value: 15 }, // 更新第一个数据点
+ { category: 'B', value: 25 }, // 更新第二个数据点
+ { category: 'C', value: 35 }, // 更新第三个数据点
+ { category: 'D', value: 45 } // 添加一个新的数据点
+ ];
+
+ // 更新图表数据并触发动画
+ chart.updateSeriesData(updatedData);
+}, 5000);
+
+```
+
+
+在这个例子中,`updateSeriesData`方法会触发一系列动画:
+
+* **新数据点(D)**:
+
+1. 淡入(`fadeIn`):从透明度0逐渐变为1。
+
+1. 中心生长(`growCenterIn`):从中心向外生长,宽度和高度从0变为最终值。
+
+1. 脉冲(`pulse`):轻微放大后再恢复原状,以吸引用户的注意力。
+
+* **现有数据点(A、B、C)**:
+
+* 缩放(`scaleIn`):根据新的数据值调整柱子的高度,以平滑过渡。
+
+
+
+#### 5. 动画编排的详细实现
+
+
+
+**链式动画任务**
+
+
+
+为了实现复杂的动画编排,我们可以使用`IAnimationTask`接口来定义每个状态下的动画任务序列。每个任务包含时间偏移、动作队列和后继任务列表,形成了一种链式动画执行机制。
+
+
+
+```xml
+interface IAnimationTask {
+ timeOffset: number;
+ actionList: Action[];
+ nextTaskList: IAnimationTask[];
+}
+
+```
+
+
+**示例:定义链式动画任务**
+
+
+
+假设我们要为柱状图中的新数据点定义一个复杂的链式动画任务,首先是淡入,然后是中心生长,最后是轻微的脉冲效果。
+
+
+
+```xml
+const enterAnimationTasks: IAnimationTask[] = [
+ {
+ timeOffset: 0,
+ actionList: [
+ { type: 'fadeIn', duration: 800, easing: 'easeInOutQuad' }
+ ],
+ nextTaskList: [
+ {
+ timeOffset: 800,
+ actionList: [
+ { type: 'growCenterIn', duration: 500, easing: 'easeInOutQuad' }
+ ],
+ nextTaskList: [
+ {
+ timeOffset: 500,
+ actionList: [
+ { type: 'pulse', duration: 300, easing: 'easeInOutQuad' }
+ ]
+ }
+ ]
+ }
+ ]
+ }
+];
+
+```
+
+
+**在图表配置中使用链式动画任务**
+
+
+
+将定义好的链式动画任务集成到图表配置中,确保新数据点能够按照预期的顺序和效果执行动画。
+
+
+
+```xml
+const chartSpec = {
+ series: [
+ {
+ type: 'bar',
+ data: [
+ { category: 'A', value: 10 },
+ { category: 'B', value: 20 },
+ { category: 'C', value: 30 }
+ ],
+ animationEnter: enterAnimationTasks,
+ animationUpdate: {
+ type: 'scaleIn',
+ duration: 500,
+ easing: 'easeInOutQuad'
+ },
+ animationExit: {
+ type: 'fadeOut',
+ duration: 600,
+ easing: 'easeInOutQuad'
+ }
+ }
+ ]
+};
+
+```
+
+
+#### 6. 动画任务的执行
+
+
+
+**动画任务的解析与执行**
+
+
+
+VChart内部会解析`animationEnter`、`animationUpdate`和`animationExit`中的动画任务,并按照定义的顺序和时间偏移执行相应的动画。以下是一个简化的示例,展示如何解析和执行链式动画任务。
+
+
+
+```xml
+class AnimateManager extends StateManager implements IAnimate {
+ updateAnimateState(state: AnimationStateEnum, noRender?: boolean) {
+ if (state === AnimationStateEnum.update) {
+ this.updateState(
+ {
+ animationState: {
+ callback: (datum: any, element: IElement) => element.diffState
+ }
+ },
+ noRender
+ );
+ } else if (state === AnimationStateEnum.appear) {
+ // 处理新数据点的入场动画
+ this.handleAnimationTasks(element, element.animationConfig.enter);
+ } else if (state === AnimationStateEnum.exit) {
+ // 处理旧数据点的退场动画
+ this.handleAnimationTasks(element, element.animationConfig.exit);
+ }
+ }
+
+ private handleAnimationTasks(element: IElement, tasks: IAnimationTask[]) {
+ tasks.forEach(task => {
+ setTimeout(() => {
+ task.actionList.forEach(action => {
+ element.startAnimation(action.type, action.duration, action.easing);
+ });
+ if (task.nextTaskList) {
+ this.handleAnimationTasks(element, task.nextTaskList);
+ }
+ }, task.timeOffset);
+ });
+ }
+}
+
+```
+
+
+在这个示例中,`handleAnimationTasks`方法会递归地解析并执行每个动画任务,确保按照定义的顺序和时间偏移触发相应的动画。
+
+
+
+#### 7. 动画的具体实现
+
+
+
+**动画函数的定义**
+
+
+
+每个具体的动画函数(如`Appear_FadeIn`、`ScaleInOutAnimation`、`Appear_FadeOut`、`growCenterIn`和`pulseAnimation`)定义了动画的具体行为。以下是一些具体的动画函数示例:
+
+
+
+```xml
+// 淡入动画
+export const Appear_FadeIn: IAnimationTypeConfig = {
+ type: 'fadeIn',
+ duration: 800,
+ easing: 'easeInOutQuad',
+ channel: {
+ opacity: { from: 0, to: 1 }
+ }
+};
+
+// 缩放动画
+export const ScaleInOutAnimation: IAnimationTypeConfig = {
+ type: 'scaleIn',
+ duration: 500,
+ easing: 'easeInOutQuad',
+ channel: {
+ scale: { from: 0.8, to: 1 }
+ }
+};
+
+// 淡出动画
+export const Appear_FadeOut: IAnimationTypeConfig = {
+ type: 'fadeOut',
+ duration: 600,
+ easing: 'easeInOutQuad',
+ channel: {
+ opacity: { from: 1, to: 0 }
+ }
+};
+
+// 中心生长动画
+export const growCenterIn: IAnimationTypeConfig = {
+ type: 'growCenterIn',
+ duration: 500,
+ easing: 'easeInOutQuad',
+ channel: {
+ width: { from: 0, to: '100%' },
+ height: { from: 0, to: '100%' }
+ }
+};
+
+// 脉冲动画
+export const pulseAnimation: IAnimationTypeConfig = {
+ type: 'pulse',
+ duration: 300,
+ easing: 'easeInOutQuad',
+ channel: {
+ scale: { from: 1, to: 1.1, toBack: 1 }
+ }
+};
+
+```
+
+
+**动画函数的注册**
+
+
+
+确保这些动画函数已经被正确注册到系统中,以便在需要时被调用。
+
+
+
+```xml
+import { Factory } from '@visactor/vchart';
+import { Appear_FadeIn, ScaleInOutAnimation, Appear_FadeOut, growCenterIn, pulseAnimation } from './series/bar/animation';
+
+Factory.registerAnimation('fadeIn', Appear_FadeIn);
+Factory.registerAnimation('scaleIn', ScaleInOutAnimation);
+Factory.registerAnimation('fadeOut', Appear_FadeOut);
+Factory.registerAnimation('growCenterIn', growCenterIn);
+Factory.registerAnimation('pulse', pulseAnimation);
+
+```
+
+
+#### 8. 完整示例代码
+
+
+
+以下是一个完整的示例代码,展示了如何创建一个带有复杂动画编排的柱状图。
+
+
+
+```xml
+// 导入必要的模块
+import { VChart } from '@visactor/vchart';
+import { Factory } from '@visactor/vchart';
+import { IElement, IAnimationTypeConfig } from '@visactor/vgrammar-core';
+
+// 定义动画函数
+export const Appear_FadeIn: IAnimationTypeConfig = {
+ type: 'fadeIn',
+ duration: 800,
+ easing: 'easeInOutQuad',
+ channel: {
+ opacity: { from: 0, to: 1 }
+ }
+};
+
+export const ScaleInOutAnimation: IAnimationTypeConfig = {
+ type: 'scaleIn',
+ duration: 500,
+ easing: 'easeInOutQuad',
+ channel: {
+ scale: { from: 0.8, to: 1 }
+ }
+};
+
+export const Appear_FadeOut: IAnimationTypeConfig = {
+ type: 'fadeOut',
+ duration: 600,
+ easing: 'easeInOutQuad',
+ channel: {
+ opacity: { from: 1, to: 0 }
+ }
+};
+
+export const growCenterIn: IAnimationTypeConfig = {
+ type: 'growCenterIn',
+ duration: 500,
+ easing: 'easeInOutQuad',
+ channel: {
+ width: { from: 0, to: '100%' },
+ height: { from: 0, to: '100%' }
+ }
+};
+
+export const pulseAnimation: IAnimationTypeConfig = {
+ type: 'pulse',
+ duration: 300,
+ easing: 'easeInOutQuad',
+ channel: {
+ scale: { from: 1, to: 1.1, toBack: 1 }
+ }
+};
+
+// 注册动画
+Factory.registerAnimation('fadeIn', Appear_FadeIn);
+Factory.registerAnimation('scaleIn', ScaleInOutAnimation);
+Factory.registerAnimation('fadeOut', Appear_FadeOut);
+Factory.registerAnimation('growCenterIn', growCenterIn);
+Factory.registerAnimation('pulse', pulseAnimation);
+
+// 定义链式动画任务
+const enterAnimationTasks: IAnimationTask[] = [
+ {
+ timeOffset: 0,
+ actionList: [
+ { type: 'fadeIn', duration: 800, easing: 'easeInOutQuad' }
+ ],
+ nextTaskList: [
+ {
+ timeOffset: 800,
+ actionList: [
+ { type: 'growCenterIn', duration: 500, easing: 'easeInOutQuad' }
+ ],
+ nextTaskList: [
+ {
+ timeOffset: 500,
+ actionList: [
+ { type: 'pulse', duration: 300, easing: 'easeInOutQuad' }
+ ]
+ }
+ ]
+ }
+ ]
+ }
+];
+
+// 定义图表配置
+const chartSpec = {
+ series: [
+ {
+ type: 'bar',
+ data: [
+ { category: 'A', value: 10 },
+ { category: 'B', value: 20 },
+ { category: 'C', value: 30 }
+ ],
+ animationEnter: enterAnimationTasks,
+ animationUpdate: {
+ type: 'scaleIn',
+ duration: 500,
+ easing: 'easeInOutQuad'
+ },
+ animationExit: {
+ type: 'fadeOut',
+ duration: 600,
+ easing: 'easeInOutQuad'
+ }
+ }
+ ]
+};
+
+// 初始化图表实例
+const container = document.getElementById('chart-container');
+const chart = new VChart({
+ el: container,
+ spec: chartSpec,
+ options: {
+ animation: true, // 开启动画
+ theme: 'light' // 使用浅色主题
+ }
+});
+
+// 模拟数据更新
+setTimeout(() => {
+ const updatedData = [
+ { category: 'A', value: 15 }, // 更新第一个数据点
+ { category: 'B', value: 25 }, // 更新第二个数据点
+ { category: 'C', value: 35 }, // 更新第三个数据点
+ { category: 'D', value: 45 } // 添加一个新的数据点
+ ];
+
+ // 更新图表数据并触发动画
+ chart.updateSeriesData(updatedData);
+}, 5000);
+
+```
+
+
+#### 9. 动画编排的高级用法
+
+
+
+**条件性动画配置**
+
+
+
+**条件性动画配置** 允许根据数据点的具体属性动态选择不同的动画效果。例如,当数据值超过某个阈值时,使用一种特殊的动画;否则,使用默认的动画。VChart允许你在配置中嵌入逻辑判断,以实现这样的需求。
+
+
+
+```xml
+const chartSpec = {
+ series: [
+ {
+ type: 'bar',
+ data: [
+ { category: 'A', value: 10 },
+ { category: 'B', value: 60 },
+ { category: 'C', value: 30 }
+ ],
+ animationEnter: (datum: any) => {
+ if (datum.value > 50) {
+ return {
+ type: 'specialGrowth', // 特殊的生长动画
+ duration: 1000,
+ easing: 'easeInOutQuad'
+ };
+ } else {
+ return {
+ type: 'fadeIn', // 默认的淡入动画
+ duration: 800,
+ easing: 'easeInOutQuad'
+ };
+ }
+ },
+ animationUpdate: {
+ type: 'scaleIn',
+ duration: 500,
+ easing: 'easeInOutQuad'
+ },
+ animationExit: {
+ type: 'fadeOut',
+ duration: 600,
+ easing: 'easeInOutQuad'
+ }
+ }
+ ]
+};
+
+```
+
+
+在这个例子中,`animationEnter`配置接受一个函数作为参数,该函数可以根据数据点的具体属性返回不同的动画配置对象。具体来说:
+
+* **数据点 B 的值为 60**,大于阈值 50,因此使用 `specialGrowth` 动画。
+
+* **数据点 A 和 C 的值分别为 10 和 30**,小于阈值 50,因此使用 `fadeIn` 动画。
+
+
+
+**自定义动画类型**
+
+
+
+除了使用内置的动画类型外,VChart还支持开发者自定义动画逻辑。你可以通过继承或扩展现有的动画类来创建新的动画效果,并将其注册到系统中。
+
+
+
+```xml
+// 定义一个新的动画类型
+function specialGrowthAnimation(params: any): IAnimationTypeConfig {
+ return {
+ type: 'specialGrowth',
+ duration: 1000,
+ easing: 'easeInOutQuad',
+ channel: {
+ width: { from: 0, to: params.width },
+ height: { from: 0, to: params.height },
+ opacity: { from: 0, to: 1 }
+ }
+ };
+}
+
+// 注册自定义动画
+Factory.registerAnimation('specialGrowth', specialGrowthAnimation);
+
+// 在图表配置中使用自定义动画
+const chartSpec = {
+ series: [
+ {
+ type: 'bar',
+ data: [
+ { category: 'A', value: 10 },
+ { category: 'B', value: 60 },
+ { category: 'C', value: 30 }
+ ],
+ animationEnter: (datum: any) => {
+ if (datum.value > 50) {
+ return {
+ type: 'specialGrowth',
+ duration: 1000,
+ easing: 'easeInOutQuad'
+ };
+ } else {
+ return {
+ type: 'fadeIn',
+ duration: 800,
+ easing: 'easeInOutQuad'
+ };
+ }
+ },
+ animationUpdate: {
+ type: 'scaleIn',
+ duration: 500,
+ easing: 'easeInOutQuad'
+ },
+ animationExit: {
+ type: 'fadeOut',
+ duration: 600,
+ easing: 'easeInOutQuad'
+ }
+ }
+ ]
+};
+
+```
+
+
+在这个例子中,我们定义了一个名为 `specialGrowth` 的自定义动画,并将其注册到系统中。然后,在 `animationEnter` 配置中根据数据点的值动态选择使用 `specialGrowth` 或 `fadeIn` 动画。
+
+
+
+#### 10. 动画任务的高级用法
+
+
+
+**嵌套动画任务**
+
+
+
+除了简单的链式动画任务外,VChart还支持嵌套的动画任务,使得动画编排更加灵活和复杂。通过嵌套任务,可以实现更精细的动画控制。
+
+
+
+**示例:嵌套动画任务**
+
+
+
+假设我们要为新加入的数据点创建一个更复杂的动画序列,首先是淡入,然后是中心生长,接着是轻微的脉冲效果,最后是高亮显示。
+
+
+
+```xml
+const enterAnimationTasks: IAnimationTask[] = [
+ {
+ timeOffset: 0,
+ actionList: [
+ { type: 'fadeIn', duration: 800, easing: 'easeInOutQuad' }
+ ],
+ nextTaskList: [
+ {
+ timeOffset: 800,
+ actionList: [
+ { type: 'growCenterIn', duration: 500, easing: 'easeInOutQuad' }
+ ],
+ nextTaskList: [
+ {
+ timeOffset: 500,
+ actionList: [
+ { type: 'pulse', duration: 300, easing: 'easeInOutQuad' }
+ ],
+ nextTaskList: [
+ {
+ timeOffset: 300,
+ actionList: [
+ { type: 'highlight', duration: 500, easing: 'easeInOutQuad' }
+ ]
+ }
+ ]
+ }
+ ]
+ }
+ ]
+ }
+];
+
+```
+
+
+在这个嵌套的动画任务中:
+
+1. **淡入(**`**fadeIn**`**)**:从透明度0逐渐变为1。
+
+1. **中心生长(**`**growCenterIn**`**)**:从中心向外生长,宽度和高度从0变为最终值。
+
+1. **脉冲(**`**pulse**`**)**:轻微放大后再恢复原状,以吸引用户的注意力。
+
+1. **高亮显示(**`**highlight**`**)**:在动画结束后,为数据点添加高亮效果。
+
+
+
+**定义高亮显示动画**
+
+
+
+首先,定义并注册高亮显示动画。
+
+
+
+```xml
+export const highlightAnimation: IAnimationTypeConfig = {
+ type: 'highlight',
+ duration: 500,
+ easing: 'easeInOutQuad',
+ channel: {
+ fill: { from: 'blue', to: 'red', toBack: 'blue' }
+ }
+};
+
+// 注册高亮显示动画
+Factory.registerAnimation('highlight', highlightAnimation);
+
+```
+
+
+**在图表配置中使用嵌套动画任务**
+
+
+
+将定义好的嵌套动画任务集成到图表配置中。
+
+
+
+```xml
+const chartSpec = {
+ series: [
+ {
+ type: 'bar',
+ data: [
+ { category: 'A', value: 10 },
+ { category: 'B', value: 20 },
+ { category: 'C', value: 30 }
+ ],
+ animationEnter: enterAnimationTasks,
+ animationUpdate: {
+ type: 'scaleIn',
+ duration: 500,
+ easing: 'easeInOutQuad'
+ },
+ animationExit: {
+ type: 'fadeOut',
+ duration: 600,
+ easing: 'easeInOutQuad'
+ }
+ }
+ ]
+};
+
+```
+
+
+#### 11. 动画任务的执行机制
+
+
+
+**动画任务的解析与执行**
+
+
+
+VChart内部会解析`animationEnter`、`animationUpdate`和`animationExit`中的动画任务,并按照定义的顺序和时间偏移执行相应的动画。以下是一个简化的示例,展示如何解析和执行链式动画任务。
+
+
+
+```xml
+class AnimateManager extends StateManager implements IAnimate {
+ updateAnimateState(state: AnimationStateEnum, noRender?: boolean) {
+ if (state === AnimationStateEnum.update) {
+ this.updateState(
+ {
+ animationState: {
+ callback: (datum: any, element: IElement) => element.diffState
+ }
+ },
+ noRender
+ );
+ } else if (state === AnimationStateEnum.appear) {
+ // 处理新数据点的入场动画
+ this.handleAnimationTasks(element, element.animationConfig.enter);
+ } else if (state === AnimationStateEnum.exit) {
+ // 处理旧数据点的退场动画
+ this.handleAnimationTasks(element, element.animationConfig.exit);
+ }
+ }
+
+ private handleAnimationTasks(element: IElement, tasks: IAnimationTask[]) {
+ tasks.forEach(task => {
+ setTimeout(() => {
+ task.actionList.forEach(action => {
+ element.startAnimation(action.type, action.duration, action.easing);
+ });
+ if (task.nextTaskList) {
+ this.handleAnimationTasks(element, task.nextTaskList);
+ }
+ }, task.timeOffset);
+ });
+ }
+}
+
+```
+
+
+在这个示例中,`handleAnimationTasks`方法会递归地解析并执行每个动画任务,确保按照定义的顺序和时间偏移触发相应的动画。
+
+
+
+**动画任务的触发时机**
+
+
+
+为了确保动画在合适的时间触发,VChart提供了一系列钩子函数,如`VGRAMMAR_HOOK_EVENT.AFTER_DO_RENDER`和`VGRAMMAR_HOOK_EVENT.ANIMATION_END`。这些钩子可以帮助我们在图表首次渲染完成或动画结束时执行特定的逻辑。
+
+
+
+```xml
+this._event.on(VGRAMMAR_HOOK_EVENT.AFTER_DO_RENDER, () => {
+ // 图表首次渲染完成后的逻辑
+ console.log('图表首次渲染完成');
+});
+
+this._event.on(VGRAMMAR_HOOK_EVENT.ANIMATION_END, ({ event }) => {
+ if (event.animationState === AnimationStateEnum.enter) {
+ // enter 动画结束后的逻辑
+ console.log('新数据点入场动画结束');
+ } else if (event.animationState === AnimationStateEnum.update) {
+ // update 动画结束后的逻辑
+ console.log('现有数据点更新动画结束');
+ } else if (event.animationState === AnimationStateEnum.exit) {
+ // exit 动画结束后的逻辑
+ console.log('旧数据点退场动画结束');
+ }
+});
+
+```
+
+
+#### 12. 动画编排的最佳实践
+
+
+
+**批量更新数据**
+
+
+
+为了提高性能,建议尽量减少频繁的数据更新操作。如果需要更新大量数据,可以考虑将这些更新合并成一次批量操作,以减少不必要的渲染次数。
+
+
+
+```xml
+// 不推荐的做法:逐个更新数据点
+data.forEach((item, index) => {
+ setTimeout(() => {
+ chart.updateSeriesData([/* 更新后的数据 */]);
+ }, index * 100); // 每隔100毫秒更新一个数据点
+});
+
+// 推荐的做法:一次性批量更新所有数据
+setTimeout(() => {
+ const updatedData = data.map(item => /* 更新后的数据 */);
+ chart.updateSeriesData(updatedData);
+}, 1000); // 1秒后一次性更新所有数据
+
+```
+
+
+**懒加载动画**
+
+
+
+对于大型图表或包含大量数据点的场景,可以采用懒加载的方式延迟加载动画,直到用户交互或特定条件下才触发。这有助于提升初始加载速度和整体性能。
+
+
+
+```xml
+// 懒加载动画配置
+const chartSpec = {
+ series: [
+ {
+ type: 'bar',
+ data: [/* 大量数据数组 */],
+ animationEnter: {
+ type: 'lazyFadeIn',
+ duration: 800,
+ easing: 'easeInOutQuad',
+ lazyLoad: true // 启用懒加载
+ }
+ }
+ ]
+};
+
+// 当用户滚动到视口内时触发懒加载动画
+window.addEventListener('scroll', () => {
+ if (isInViewPort(chartContainer)) {
+ chart.startLazyAnimations();
+ }
+});
+
+```
+
+
+**缓存动画结果**
+
+
+
+对于那些计算成本较高的动画效果,可以考虑缓存其结果,避免重复计算。例如,对于复杂的路径动画,可以预先计算好路径的关键帧,并在后续渲染中复用这些关键帧。
+
+
+
+```xml
+class PathAnimator {
+ private cachedFrames: KeyFrame[];
+
+ constructor(private pathData: PathData) {
+ this.cachedFrames = this.computeKeyFrames(pathData);
+ }
+
+ private computeKeyFrames(data: PathData): KeyFrame[] {
+ // 计算路径的关键帧并返回
+ }
+
+ public animate(element: IElement): void {
+ // 使用缓存的关键帧进行动画
+ this.applyCachedFrames(element);
+ }
+}
+
+```
+
+
+**事件节流与防抖**
+
+
+
+为了避免因频繁触发事件导致性能问题,可以对事件监听器应用节流(throttle)或防抖(debounce)技术。例如,在处理鼠标悬停事件时,可以限制动画触发的频率。
+
+
+
+```xml
+import throttle from 'lodash/throttle';
+
+// 对鼠标悬停事件应用节流
+chart.on('element:hover', throttle((event) => {
+ // 触发悬停动画
+}, 200)); // 每200毫秒最多触发一次
+
+```
+
+
+**动态控制动画**
+
+
+
+在某些情况下,你可能想要动态地控制动画的行为,比如更改动画的速度或样式。VChart提供了灵活的方法来实现这一点。
+
+
+
+```xml
+// 更新某个系列的动画配置
+chart.updateSeriesOptions(0, {
+ animationEnter: {
+ duration: 1000, // 更改淡入动画的持续时间
+ easing: 'linear' // 更改缓动函数
+ },
+ animationUpdate: {
+ duration: 700, // 更改缩放动画的持续时间
+ easing: 'easeInOutCubic' // 更改缓动函数
+ },
+ animationExit: {
+ duration: 900, // 更改淡出动画的持续时间
+ easing: 'easeInOutCubic' // 更改缓动函数
+ }
+});
+
+// 重新应用新的动画配置
+chart.render();
+
+```
+
+
+#### 13. 完整示例代码
+
+
+
+以下是一个完整的示例代码,展示了如何创建一个带有复杂动画编排的柱状图,并实现条件性动画配置和自定义动画类型。
+
+
+
+```xml
+// 导入必要的模块
+import { VChart } from '@visactor/vchart';
+import { Factory } from '@visactor/vchart';
+import { IElement, IAnimationTypeConfig } from '@visactor/vgrammar-core';
+
+// 定义动画函数
+export const Appear_FadeIn: IAnimationTypeConfig = {
+ type: 'fadeIn',
+ duration: 800,
+ easing: 'easeInOutQuad',
+ channel: {
+ opacity: { from: 0, to: 1 }
+ }
+};
+
+export const ScaleInOutAnimation: IAnimationTypeConfig = {
+ type: 'scaleIn',
+ duration: 500,
+ easing: 'easeInOutQuad',
+ channel: {
+ scale: { from: 0.8, to: 1 }
+ }
+};
+
+export const Appear_FadeOut: IAnimationTypeConfig = {
+ type: 'fadeOut',
+ duration: 600,
+ easing: 'easeInOutQuad',
+ channel: {
+ opacity: { from: 1, to: 0 }
+ }
+};
+
+export const growCenterIn: IAnimationTypeConfig = {
+ type: 'growCenterIn',
+ duration: 500,
+ easing: 'easeInOutQuad',
+ channel: {
+ width: { from: 0, to: '100%' },
+ height: { from: 0, to: '100%' }
+ }
+};
+
+export const pulseAnimation: IAnimationTypeConfig = {
+ type: 'pulse',
+ duration: 300,
+ easing: 'easeInOutQuad',
+ channel: {
+ scale: { from: 1, to: 1.1, toBack: 1 }
+ }
+};
+
+export const highlightAnimation: IAnimationTypeConfig = {
+ type: 'highlight',
+ duration: 500,
+ easing: 'easeInOutQuad',
+ channel: {
+ fill: { from: 'blue', to: 'red', toBack: 'blue' }
+ }
+};
+
+// 注册动画
+Factory.registerAnimation('fadeIn', Appear_FadeIn);
+Factory.registerAnimation('scaleIn', ScaleInOutAnimation);
+Factory.registerAnimation('fadeOut', Appear_FadeOut);
+Factory.registerAnimation('growCenterIn', growCenterIn);
+Factory.registerAnimation('pulse', pulseAnimation);
+Factory.registerAnimation('highlight', highlightAnimation);
+
+// 定义链式动画任务
+const enterAnimationTasks: IAnimationTask[] = [
+ {
+ timeOffset: 0,
+ actionList: [
+ { type: 'fadeIn', duration: 800, easing: 'easeInOutQuad' }
+ ],
+ nextTaskList: [
+ {
+ timeOffset: 800,
+ actionList: [
+ { type: 'growCenterIn', duration: 500, easing: 'easeInOutQuad' }
+ ],
+ nextTaskList: [
+ {
+ timeOffset: 500,
+ actionList: [
+ { type: 'pulse', duration: 300, easing: 'easeInOutQuad' }
+ ],
+ nextTaskList: [
+ {
+ timeOffset: 300,
+ actionList: [
+ { type: 'highlight', duration: 500, easing: 'easeInOutQuad' }
+ ]
+ }
+ ]
+ }
+ ]
+ }
+ ]
+ }
+];
+
+// 定义图表配置
+const chartSpec = {
+ series: [
+ {
+ type: 'bar',
+ data: [
+ { category: 'A', value: 10 },
+ { category: 'B', value: 20 },
+ { category: 'C', value: 30 }
+ ],
+ animationEnter: enterAnimationTasks,
+ animationUpdate: {
+ type: 'scaleIn',
+ duration: 500,
+ easing: 'easeInOutQuad'
+ },
+ animationExit: {
+ type: 'fadeOut',
+ duration: 600,
+ easing: 'easeInOutQuad'
+ }
+ }
+ ]
+};
+
+// 初始化图表实例
+const container = document.getElementById('chart-container');
+const chart = new VChart({
+ el: container,
+ spec: chartSpec,
+ options: {
+ animation: true, // 开启动画
+ theme: 'light' // 使用浅色主题
+ }
+});
+
+// 模拟数据更新
+setTimeout(() => {
+ const updatedData = [
+ { category: 'A', value: 15 }, // 更新第一个数据点
+ { category: 'B', value: 25 }, // 更新第二个数据点
+ { category: 'C', value: 35 }, // 更新第三个数据点
+ { category: 'D', value: 65
+
+```
+
+
+在这个例子中,`animationEnter`配置接受一个函数作为参数,该函数可以根据数据点的具体属性返回不同的
+
+### 继续解读数据更新动画的实现
+
+
+
+在前一部分中,我们已经详细介绍了VChart中数据更新动画的基本概念和实现方式。接下来,我们将深入探讨一些更具体的细节,包括如何处理复杂的动画序列、动画配置的高级用法以及优化性能的最佳实践。
+
+
+
+#### 1. 复杂动画序列的处理
+
+
+
+**链式动画任务**
+
+
+
+对于复杂的动画序列,VChart引入了`IAnimationTask`接口来描述动画任务的数据结构。每个任务包含时间偏移、动作队列和后继任务列表,形成了一种链式动画执行机制。
+
+
+
+```xml
+interface IAnimationTask {
+ timeOffset: number;
+ actionList: Action[];
+ nextTaskList: IAnimationTask[];
+}
+
+```
+
+
+这种设计使得多个动画任务可以按顺序或并发执行,从而实现更加复杂和细腻的动画效果。例如,在一个柱状图中,我们可以定义一系列连续的动画任务,先让新加入的数据点淡入,然后逐渐增长到最终高度,最后添加一些装饰性的动画(如高亮显示)。
+
+
+
+**示例:创建链式动画**
+
+
+
+假设我们要为一个柱状图中的新数据点创建一个链式的入场动画,首先是淡入,接着是生长,最后是轻微的脉冲效果以吸引用户的注意力。
+
+
+
+```xml
+const enterAnimationTasks: IAnimationTask[] = [
+ {
+ timeOffset: 0,
+ actionList: [
+ { type: 'fadeIn', duration: 800, easing: 'easeInOutQuad' }
+ ],
+ nextTaskList: [
+ {
+ timeOffset: 800,
+ actionList: [
+ { type: 'growCenterIn', duration: 500, easing: 'easeInOutQuad' }
+ ],
+ nextTaskList: [
+ {
+ timeOffset: 500,
+ actionList: [
+ { type: 'pulse', duration: 300, easing: 'easeInOutQuad' }
+ ]
+ }
+ ]
+ }
+ ]
+ }
+];
+
+```
+
+
+在这个例子中,我们使用了`enterAnimationTasks`数组来定义一系列动画任务,每个任务都有自己的时间偏移、动作队列和后继任务列表。通过这种方式,可以实现非常丰富的视觉效果。
+
+
+
+#### 2. 动画配置的高级用法
+
+
+
+**条件性动画配置**
+
+
+
+有时候,你可能希望根据某些条件动态地选择不同的动画效果。例如,当数据值超过某个阈值时,使用一种特殊的动画;否则,使用默认的动画。VChart允许你在配置中嵌入逻辑判断,以实现这样的需求。
+
+
+
+```xml
+const chartSpec = {
+ series: [
+ {
+ type: 'bar',
+ data: [/* 数据数组 */],
+ animationEnter: (datum: any) => {
+ if (datum.value > 50) {
+ return {
+ type: 'specialGrowth', // 特殊的生长动画
+ duration: 1000,
+ easing: 'easeInOutQuad'
+ };
+ } else {
+ return {
+ type: 'fadeIn', // 默认的淡入动画
+ duration: 800,
+ easing: 'easeInOutQuad'
+ };
+ }
+ },
+ animationUpdate: {
+ type: 'scaleIn',
+ duration: 500,
+ easing: 'easeInOutQuad'
+ },
+ animationExit: {
+ type: 'fadeOut',
+ duration: 600,
+ easing: 'easeInOutQuad'
+ }
+ }
+ ]
+};
+
+```
+
+
+在这个例子中,`animationEnter`配置接受一个函数作为参数,该函数可以根据数据点的具体属性返回不同的动画配置对象。这使得动画行为可以根据实际数据动态调整,增强了图表的表现力。
+
+
+
+**自定义动画类型**
+
+
+
+除了使用内置的动画类型外,VChart还支持开发者自定义动画逻辑。你可以通过继承或扩展现有的动画类来创建新的动画效果,并将其注册到系统中。
+
+
+
+```xml
+import { Factory } from '@visactor/vchart';
+import { IElement, IAnimationTypeConfig } from '@visactor/vgrammar-core';
+
+// 定义一个新的动画类型
+function customGrowAnimation(params: any): IAnimationTypeConfig {
+ return {
+ type: 'customGrow',
+ duration: 1000,
+ easing: 'easeInOutQuad',
+ channel: {
+ width: { from: 0, to: params.width },
+ height: { from: 0, to: params.height }
+ }
+ };
+}
+
+// 注册自定义动画
+Factory.registerAnimation('customGrow', customGrowAnimation);
+
+// 在图表配置中使用自定义动画
+const chartSpec = {
+ series: [
+ {
+ type: 'bar',
+ data: [/* 数据数组 */],
+ animationEnter: {
+ type: 'customGrow',
+ width: 50,
+ height: 100
+ }
+ }
+ ]
+};
+
+```
+
+
+这段代码展示了如何定义并注册一个名为`customGrow`的自定义动画,它会根据传入的参数调整图形元素的宽度和高度。然后,可以在图表配置中直接使用这个自定义动画。
+
+
+
+#### 3. 性能优化与最佳实践
+
+
+
+**批量更新数据**
+
+
+
+为了提高性能,建议尽量减少频繁的数据更新操作。如果需要更新大量数据,可以考虑将这些更新合并成一次批量操作,以减少不必要的渲染次数。
+
+
+
+```xml
+// 不推荐的做法:逐个更新数据点
+data.forEach((item, index) => {
+ setTimeout(() => {
+ chart.updateSeriesData([/* 更新后的数据 */]);
+ }, index * 100); // 每隔100毫秒更新一个数据点
+});
+
+// 推荐的做法:一次性批量更新所有数据
+setTimeout(() => {
+ const updatedData = data.map(item => /* 更新后的数据 */);
+ chart.updateSeriesData(updatedData);
+}, 1000); // 1秒后一次性更新所有数据
+
+```
+
+
+**懒加载动画**
+
+
+
+对于大型图表或包含大量数据点的场景,可以采用懒加载的方式延迟加载动画,直到用户交互或特定条件下才触发。这有助于提升初始加载速度和整体性能。
+
+
+
+```xml
+// 懒加载动画配置
+const chartSpec = {
+ series: [
+ {
+ type: 'bar',
+ data: [/* 大量数据数组 */],
+ animationEnter: {
+ type: 'lazyFadeIn',
+ duration: 800,
+ easing: 'easeInOutQuad',
+ lazyLoad: true // 启用懒加载
+ }
+ }
+ ]
+};
+
+// 当用户滚动到视口内时触发懒加载动画
+window.addEventListener('scroll', () => {
+ if (isInViewPort(chartContainer)) {
+ chart.startLazyAnimations();
+ }
+});
+
+```
+
+
+**缓存动画结果**
+
+
+
+对于那些计算成本较高的动画效果,可以考虑缓存其结果,避免重复计算。例如,对于复杂的路径动画,可以预先计算好路径的关键帧,并在后续渲染中复用这些关键帧。
+
+
+
+```xml
+class PathAnimator {
+ private cachedFrames: KeyFrame[];
+
+ constructor(private pathData: PathData) {
+ this.cachedFrames = this.computeKeyFrames(pathData);
+ }
+
+ private computeKeyFrames(data: PathData): KeyFrame[] {
+ // 计算路径的关键帧并返回
+ }
+
+ public animate(element: IElement): void {
+ // 使用缓存的关键帧进行动画
+ this.applyCachedFrames(element);
+ }
+}
+
+```
+
+
+**事件节流与防抖**
+
+
+
+为了避免因频繁触发事件导致性能问题,可以对事件监听器应用节流(throttle)或防抖(debounce)技术。例如,在处理鼠标悬停事件时,可以限制动画触发的频率。
+
+
+
+```xml
+import throttle from 'lodash/throttle';
+
+// 对鼠标悬停事件应用节流
+chart.on('element:hover', throttle((event) => {
+ // 触发悬停动画
+}, 200)); // 每200毫秒最多触发一次
+
+```
+
+
+#### 4. 实际案例分析
+
+
+
+**案例:动态柱状图**
+
+
+
+假设我们正在开发一个实时更新的动态柱状图,每秒钟都会有一批新的数据加入图表中。我们需要确保每次数据更新时,新加入的数据点能够以平滑且引人注目的方式呈现给用户,而现有数据点则保持稳定。
+
+
+
+##### 步骤 1: 定义基础配置
+
+
+
+首先,定义柱状图的基础配置,包括初始数据和其他视觉属性。同时,指定`animationEnter`、`animationUpdate`和`animationExit`配置,以确保在数据变化时能够触发动画。
+
+
+
+```xml
+const chartSpec = {
+ series: [
+ {
+ type: 'bar',
+ data: [/* 初始数据数组 */],
+ animationEnter: {
+ type: 'fadeIn',
+ duration: 800,
+ easing: 'easeInOutQuad'
+ },
+ animationUpdate: {
+ type: 'scaleIn',
+ duration: 500,
+ easing: 'easeInOutQuad'
+ },
+ animationExit: {
+ type: 'fadeOut',
+ duration: 600,
+ easing: 'easeInOutQuad'
+ }
+ }
+ ]
+};
+
+```
+
+
+##### 步骤 2: 实现数据更新逻辑
+
+
+
+接下来,实现一个定时器,每隔一秒向图表中添加一批新的数据,并触发相应的动画。
+
+
+
+```xml
+setInterval(() => {
+ const newDataBatch = generateNewData(); // 生成新的数据批次
+ const updatedData = [...chart.getData(), ...newDataBatch];
+
+ // 更新图表数据并触发动画
+ chart.updateSeriesData(updatedData);
+}, 1000);
+
+```
+
+
+##### 步骤 3: 优化性能
+
+
+
+考虑到每秒钟都会有一批新的数据加入,可能会对性能造成影响。因此,我们可以采取以下几种优化措施:
+
+
+
+* **批量更新数据**:将所有新数据一次性更新到图表中,而不是逐个添加。
+
+* **懒加载动画**:对于新加入的数据点,启用懒加载动画,只有当它们进入视口时才开始播放动画。
+
+* **事件节流**:对鼠标悬停等交互事件应用节流技术,防止频繁触发不必要的动画。
+
+
+
+```xml
+// 批量更新数据
+setTimeout(() => {
+ const updatedData = generateAllNewData(); // 生成所有新的数据
+ chart.updateSeriesData(updatedData);
+}, 1000);
+
+// 懒加载动画配置
+const chartSpec = {
+ series: [
+ {
+ type: 'bar',
+ data: [/* 数据数组 */],
+ animationEnter: {
+ type: 'lazyFadeIn',
+ duration: 800,
+ easing: 'easeInOutQuad',
+ lazyLoad: true
+ }
+ }
+ ]
+};
+
+// 对鼠标悬停事件应用节流
+chart.on('element:hover', throttle((event) => {
+ // 触发悬停动画
+}, 200));
+
+```
+
+
+##### 步骤 4: 增强用户体验
+
+
+
+为了让图表更加生动有趣,还可以为新加入的数据点添加额外的装饰性动画,如高亮显示或标签提示。这不仅提升了视觉吸引力,也帮助用户更好地理解数据的变化。
+
+
+
+```xml
+// 添加高亮显示动画
+const chartSpec = {
+ series: [
+ {
+ type: 'bar',
+ data: [/* 数据数组 */],
+ animationEnter: {
+ type: 'fadeIn',
+ duration: 800,
+ easing: 'easeInOutQuad',
+ onEnd: (element: IElement) => {
+ element.addHighlight(); // 添加高亮效果
+ }
+ }
+ }
+ ]
+};
+
+// 添加标签提示动画
+chart.on('element:hover', (event) => {
+ const element = event.detail.element;
+ if (element) {
+ element.showTooltip(); // 显示标签提示
+ }
+});
+
+```
+
+
+#### 5. 动态控制动画
+
+
+
+**动态调整动画参数**
+
+
+
+在某些情况下,你可能想要根据用户的输入或其他外部因素动态调整动画参数,如持续时间、缓动函数等。VChart提供了灵活的方法来实现这一点。
+
+
+
+```xml
+// 根据用户选择动态调整动画参数
+const updateAnimationParams = (seriesIndex: number, newParams: Partial) => {
+ chart.updateSeriesOptions(seriesIndex, {
+ animationEnter: {
+ ...chart.getSeriesOptions(seriesIndex).animationEnter,
+ ...newParams
+ }
+ });
+
+ // 重新应用新的动画配置
+ chart.render();
+};
+
+// 用户选择更快的动画速度
+updateAnimationParams(0, { duration: 500 });
+
+```
+
+
+**暂停与恢复动画**
+
+
+
+ # 本文档由以下人员修正整理
+ [玄魂](https://github.com/xuanhun)
\ No newline at end of file
diff --git a/docs/assets/contributing/zh/sourcesode/11.1-theme-configuration-parsing-logic.md b/docs/assets/contributing/zh/sourcesode/11.1-theme-configuration-parsing-logic.md
new file mode 100644
index 0000000000..179000b495
--- /dev/null
+++ b/docs/assets/contributing/zh/sourcesode/11.1-theme-configuration-parsing-logic.md
@@ -0,0 +1,436 @@
+---
+title: 11.1 主题的配置解析逻辑
+
+key words: VisActor,VChart,VTable,VStrory,VMind,VGrammar,VRender,Visualization,Chart,Data,Table,Graph,Gis,LLM
+---
+# VChart主题相关概念
+
+VChart的主题模块是一个强大且灵活的图表样式配置系统。它允许用户通过统一和可复用的方式定制图表的视觉外观。用户可以轻松地为整个图表或特定图表类型定义全面的样式配置,包括颜色、字体、布局、组件样式等。通过预定义主题,用户可以快速实现一致的设计风格,无需为每个图表重复配置样式,从而大大简化了图表开发过程,并确保图表在不同场景下保持视觉一致性和专业性。简单来说,VChart的主题就像是图表的"设计模板",用户只需选择或自定义主题,就能快速创建美观、专业的数据可视化图表。
+
+主题概念相关文档:[VisActor/VChart tutorial documents](https://www.visactor.io/vchart/guide/tutorial_docs/Theme/Theme_Concept_and_Design_Rules)
+
+## 主题相关源码位置与内容
+
+* package/vchart/scr/util/theme:主题相关的工具类文件夹,包含对主题合并,解析,预处理(色板,token语义化)以及字符串主题转对象等实用的工具。
+
+* package/vchart/scr/core/vchart.ts:定义了核心类VChart,包括图表生命周期内的一系列钩子例如 主题初始化,注册,更新,切换,销毁。VChart 是具体的图表实例,负责应用和渲染,与主题的配置和更新有密不可分的联系。
+
+* package/vchart/src/theme:该文件夹包含了主题相关的特殊概念:色板(color-theme)、tokenMap、主题管理类(theme-manager)等数据结构。
+
+## 核心类及之间的联系
+
+* VChart:负责图表的具体渲染、实例化和生命周期管理
+
+* ThemeManager:负责主题的全局注册、管理和切换
+
+`ThemeManager`作为VChart的一个静态类暴露出来,用户可以使用诸如
+
+`VChart.ThemeManager.registerTheme('myTheme', { ... });`或`VChart.ThemeManager.setCurrentTheme('myTheme');`来管理主题
+
+```xml
+export class VChart implements IVChart {
+ static readonly ThemeManager = ThemeManager;
+}
+
+```
+但是本质上,`ThemeManager `仍然是一个独立的类,只是通过这种方式提供了更便捷的访问方式,这种静态属性暴露的设计模式做到了主题管理和图表渲染的解耦。
+
+# **主题的配置解析逻辑**
+
+VChart 提供了两种方式配置图表主题:
+
+* 通过图表 `spec `配置
+
+* 通过 `ThemeManager `注册主题
+
+## **主题配置的获取与优先级比较 (core/vchart.ts)**
+
+
+
+这两种配置都可以通过配置一套 `ITheme` 类型的主题对象,但是这两种配置的优先级是什么呢?这在updateCurrentTheme 方法里处理了优先级问题:
+
+
+
+ **注意**:严谨地说是三种主题来源:
+
+> * `currentTheme`:通过 `ThemeManager` 注册的全局默认主题
+> * `optionTheme`:在 VChart 构造函数的 options 中传入的主题
+> * `specTheme`:在图表规格(spec)中指定的主题
+>
+> 它们的优先级从低到高依次是:
+> * `currentTheme` < `optionTheme` < `specTheme`
+
+
+
+在 `src/core/vchart.ts` 中有如下属性,获取到了用户配置的主题内容:
+
+
+
+* `_spec.theme`:用户在图表 spec 对象配置中指定的主题
+
+* `_currentThemeName`:通过 `VChart.ThemeManager.registerTheme` 注册的当前全局主题名称
+
+### **简析主题合并的逻辑 (util/theme/merge-theme.ts)**
+
+#### **mergeTheme 函数**
+
+```xml
+export function mergeTheme(target: Maybe, ...sources: Maybe[]): Maybe {
+ return mergeSpec(transformThemeToMerge(target), ...sources.map(transformThemeToMerge));
+}
+
+```
+* 是合并主题的基础,一层简单的封装,简单地说是对象的属性覆盖
+
+* 表现结果是后出现的 `sources` 会覆盖前出现的 `theme`
+
+**示例**
+
+```xml
+const baseTheme = { color: 'blue', fontSize: 12 };
+const optionTheme = { color: 'red' };
+const specTheme = { fontSize: 14 };
+
+const finalTheme = mergeTheme({}, baseTheme, optionTheme, specTheme);
+// 结果:{ color: 'red', fontSize: 14 }
+
+```
+#### transformThemeToMerge函数
+
+```xml
+ function transformThemeToMerge(theme?: Maybe): Maybe {
+ if (!theme) {
+ return theme;
+ }
+ // 将色板转化为标准形式
+ const colorScheme = transformColorSchemeToMerge(theme.colorScheme);
+
+ return Object.assign({}, theme, {
+ colorScheme,
+ token: theme.token ?? {},
+ series: Object.assign({}, theme.series)
+ } as Partial);
+}
+
+/** 将色板转化为标准形式 */
+export function transformColorSchemeToMerge(colorScheme?: Maybe): Maybe {
+ if (colorScheme) {
+ colorScheme = Object.keys(colorScheme).reduce((scheme, key) => {
+ const value = colorScheme[key];
+ scheme[key] = transformColorSchemeToStandardStruct(value);
+ return scheme;
+ }, {} as IThemeColorScheme);
+ }
+ return colorScheme;
+}
+
+```
+`transformThemeToMerge`总的作用是完成了对主题对象进行标准化和规范化处理,他解决了
+
+* 颜色总是数组形式
+
+* 始终存在 `token `和 `series `属性
+
+确保无论用户传入的主题配置如何,都能转换成一个结构完整、一致且可预测的主题对象,为后续的主题合并和应用提供一个标准化的数据结构。
+
+#### **processThemeByChartType 函数**
+
+```xml
+const processThemeByChartType = (type: string, theme: ITheme) => {
+ if (theme.chart?.[type]) {
+ theme = mergeTheme({}, theme, theme.chart[type]);
+ }
+ return theme;
+};
+
+```
+`processThemeByChartType `是 VChart 主题系统中实现图表类型个性化的关键函数。它通过条件合并和 `mergeTheme`,实现了在保持全局主题一致性的同时,为不同图表类型提供定制化样式的能力。
+
+### **字符串主题与对象主题的解析处理**
+
+用户配置主题时可以简单便捷的传入字符串主题(通常是从第三方主题包中导出的主题),例如:
+
+```xml
+import vScreenVolcanoBlue from '@visactor/vchart-theme/public/vScreenVolcanoBlue.json';
+import VChart from '@visactor/vchart';
+
+VChart.ThemeManager.registerTheme('vScreenVolcanoBlue', vScreenVolcanoBlue);
+
+VChart.ThemeManager.setCurrentTheme('vScreenVolcanoBlue');
+
+```
+也可以传入详细配置的自定义主题,例如:
+
+```xml
+const chart = new VChart({
+ theme: {
+ color: { primary: 'red' },
+ fontSize: 14,
+ chart: {
+ bar: {
+ color: 'blue'
+ }
+ }
+ }
+});
+
+```
+在源码里针对两者的处理的核心,在\_updateCurrentTheme 里判断类型,并通过 `getThemeObject()`做转化,统一处理成对象主题来解析的,这是个简单的逻辑,却为 VChart 的配置提供了灵活性和便捷性。
+
+
+
+最终,经过层层关于优先级比较,表格类型的合并(`processThemeByChartType`),主题的合并处理逻辑,最终得到挂载在 VChart 对象里的 `currentTheme` 属性。
+
+## **主题配置的预处理**
+
+当主题配置,合并后,会进入预处理阶段。主题预处理是 VChart 主题系统的关键步骤,将抽象的主题描述转换为具体的样式配置,为开发者提供直观的配置能力。
+
+主要完成以下工作:
+
+1. 语义化颜色转换
+
+* 将形如 `{ color: 'brand.primary' }` 的颜色语义转换为具体颜色值
+
+1. Token 替换
+
+* 将形如 `{ fontSize: 'size.m' }` 的 token 语义转换为具体字号
+
+1. 递归处理嵌套对象
+
+**预处理流程**:
+
+```xml
+this._currentTheme = preprocessTheme(processThemeByChartType(chartType, finalTheme));
+
+```
+## **主题的预处理与解析**
+
+```xml
+export function preprocessTheme(
+ obj: any, //主题对象
+ colorScheme?: IThemeColorScheme, // 颜色方案
+ tokenMap?: TokenMap, // 标记映射
+ seriesSpec?: ISeriesSpec // 系列规格
+);
+
+```
+这里涉及了 VChart 主题配置的重要概念:
+
+* `colorScheme`: 颜色方案
+
+* `tokenMap`: 标记映射
+
+```xml
+VChart.ThemeManager.registerTheme('dataVizTheme', {
+ colorScheme: {
+ brand: { primary: '#3A8DFF' },
+ data: {
+ positive: '#48BB78',
+ negative: '#F56565'
+ }
+ },
+ tokenMap: {
+ typography: {
+ fontSize: {
+ small: 12,
+ medium: 14,
+ large: 16
+ }
+ }
+ }
+});
+
+```
+
+
+开发者可以在注册时利用`registerTheme`方法仿照如上案例注册一套基于这 2 个概念的复杂主题配置,在实际使用中,开发者可以通过 { color: 'data.positive' } 或 { fontSize: { token: 'typography.fontSize.medium' } } 的方式引用这些定义。这里谈谈 VChart 是如何解析这个复杂对象的。
+
+
+
+先逐层分析,这个处理函数 processTheme 的关键算法是递归遍历对象:
+
+```xml
+Object.keys(obj).forEach(key => {
+ const value = obj[key];
+ if (IGNORE_KEYS.includes(key)) {
+ newObj[key] = value;
+ }
+ // 处理颜色语义化转换、Token 语义化转换
+ else if (isPlainObject(value)) {
+ if (isColorKey(value)) {
+ newObj[key] = getActualColor(value, colorScheme, seriesSpec);
+ } else if (isTokenKey(value)) {
+ newObj[key] = queryToken(tokenMap, value);
+ }
+ // 这里使用了递归处理嵌套对象,使得能够处理任意深度的嵌套对象
+ else {
+ newObj[key] = preprocessTheme(value, colorScheme, tokenMap, seriesSpec);
+ }
+ }
+ // 非对象类型直接赋值
+ else {
+ newObj[key] = value;
+ }
+});
+
+```
+
+
+接下来分析具体的对于颜色语义和 token 语义的处理与解析
+
+#### **getActualColor 颜色语义化**
+
+```xml
+/** 查询语义化颜色 */
+export const getActualColor = (value: any, colorScheme?: IThemeColorScheme, seriesSpec?: ISeriesSpec) => {
+ if (colorScheme && isColorKey(value)) {
+ const color = queryColorFromColorScheme(colorScheme, value, seriesSpec);
+ if (color) {
+ return color;
+ }
+ }
+ return value;
+};
+
+export function queryColorFromColorScheme(
+ colorScheme: IThemeColorScheme,
+ colorKey: IColorKey,
+ seriesSpec?: ISeriesSpec
+): ColorSchemeItem | undefined {
+ const scheme = getColorSchemeBySeries(colorScheme, seriesSpec);
+ if (!scheme) {
+ return undefined;
+ }
+ let color;
+ const { palette } = scheme as IColorSchemeStruct;
+ if (isObject(palette)) {
+ color = getUpgradedTokenValue(palette, colorKey.key) ?? colorKey.default;
+ }
+ if (!color) {
+ return undefined;
+ }
+ if ((isNil(colorKey.a) && isNil(colorKey.l)) || !isString(color)) {
+ return color;
+ }
+ let c = new Color(color);
+ if (isValid(colorKey.l)) {
+ const { r, g, b } = c.color;
+ const { h, s } = rgbToHsl(r, g, b);
+ const rgb = hslToRgb(h, s, colorKey.l);
+ const newColor = new Color(`rgb(${rgb.r}, ${rgb.g}, ${rgb.b})`);
+ newColor.setOpacity(c.color.opacity);
+ c = newColor;
+ }
+ if (isValid(colorKey.a)) {
+ c.setOpacity(colorKey.a);
+ }
+ return c.toRGBA();
+}
+
+```
+
+
+queryColorFromColorScheme 是 VChart 主题系统中颜色处理的核心函数,它接收颜色方案(colorScheme)、颜色键(colorKey)和可选的系列规格(seriesSpec),通过一系列复杂的颜色查找和转换算法,实现了语义化颜色的精确定位和动态增强。
+
+
+
+函数的核心逻辑是:首先根据系列规格获取特定的颜色方案,然后从调色板中查找对应的颜色。
+
+```xml
+export function getColorSchemeBySeries(
+ colorScheme?: IThemeColorScheme,
+ seriesSpec?: ISeriesSpec
+): ColorScheme | undefined {
+ const { type: seriesType } = seriesSpec ?? {};
+ let scheme: ColorScheme | undefined;
+ if (!seriesSpec || isNil(seriesType)) {
+ scheme = colorScheme?.default;
+ } else {
+ const direction = getDirectionFromSeriesSpec(seriesSpec);
+ scheme = colorScheme?.[`${seriesType}_${direction}`] ?? colorScheme?.[seriesType] ?? colorScheme?.default;
+ }
+ return scheme;
+}
+
+```
+这个算法优先匹配具体 `seriesType_direction` 的颜色方案,然后再匹配通用 `seriesType` 的颜色方案,最后再匹配默认颜色方案。
+
+
+
+值得一提的是,此外函数还提供了两种高级颜色处理能力,根据 `colorKey` 中 `l` 或 `a` 的属性来动态处理颜色特性:
+
+1. **通过 HSL 色彩空间转换实现颜色亮度的动态调整**
+
+ **算法原理**
+
+ 色彩空间转换:RGB → HSL → RGB
+
+ **HSL 亮度调整核心代码**
+
+```xml
+ if (isValid(colorKey.l)) {
+ const { r, g, b } = c.color;
+ const { h, s } = rgbToHsl(r, g, b);
+ const rgb = hslToRgb(h, s, colorKey.l);
+ const newColor = new Color(rgb(${rgb.r}, ${rgb.g}, ${rgb.b}));
+ newColor.setOpacity(c.color.opacity);
+ c = newColor;
+ }
+
+```
+简单来说,就是在保持颜色原有色调(H)和饱和度(S)的情况下,仅调整颜色的明暗程度(L)。有关hsl和rgb格式的转换算法不是主题解析的重点,就简单提一下:
+
+(tokenMap: TokenMap, tokenKey: ITokenKey): T | undefined {
+ if (tokenMap && tokenKey.key in tokenMap) {
+ return tokenMap[tokenKey.key];
+ }
+ return tokenKey.default;
+}
+
+```
+这个函数用于根据 tokenMap 和 tokenKey 查询对应的 token 值,如果 tokenMap 中存在对应的 token,就返回对应的值,否则返回默认值。
+
+
+
+---
+# 本文档由以下人员提供
+
+吨吨(https://github.com/Shabi-x)
+
+
+
+ # 本文档由以下人员修正整理
+ [玄魂](https://github.com/xuanhun)
\ No newline at end of file
diff --git a/docs/assets/contributing/zh/sourcesode/11.2-theme-update-source-code-analysis.md b/docs/assets/contributing/zh/sourcesode/11.2-theme-update-source-code-analysis.md
new file mode 100644
index 0000000000..73f36c993d
--- /dev/null
+++ b/docs/assets/contributing/zh/sourcesode/11.2-theme-update-source-code-analysis.md
@@ -0,0 +1,308 @@
+---
+title: 11.2 主题的更新源码解读
+
+key words: VisActor,VChart,VTable,VStrory,VMind,VGrammar,VRender,Visualization,Chart,Data,Table,Graph,Gis,LLM
+---
+# 主题更新基本概念
+
+VChart主题切换是一个常见的操作:例如根据不同季节、节日,或者是国际化、个性化的配色方案,还有常见的夜间模式,用户可以手动或者监听用户系统对应切换不同风格的主题以适应不同的使用环境。
+
+## 主题更新案例
+
+例如夜间模式的注册和切换:
+
+```xml
+VChart.ThemeManager.registerTheme('darkTheme', { ... });
+VChart.ThemeManager.registerTheme('lightTheme', { ... });
+
+function toggleTheme(isDarkMode) {
+ const themeName = isDarkMode ? 'darkTheme' : 'lightTheme';
+ VChart.ThemeManager.setCurrentTheme(themeName);
+}
+
+```
+不同应用场景的风格切换:
+
+```xml
+// 不同风格的主题配置
+const themes = {
+ 'finance': { ... },
+ 'medical': { ... },
+ 'technology': { ... }
+};
+
+Object.keys(themes).forEach(key => {
+ VChart.ThemeManager.registerTheme(key + 'Theme', themes[key]);
+});
+
+function switchDashboardTheme(businessType) {
+ const themeName = businessType + 'Theme';
+ VChart.ThemeManager.setCurrentTheme(themeName);
+}
+
+```
+# 主题相关源码位置与内容
+
+* package/vchart/scr/core/**vchart.ts**:单个图表实例的主题更新执行者,实现具体的主题应用逻辑,将全局主题转化为图表的实际样式变更,图表的更新逻辑主要在这里。
+
+* package/vchart/src/core/instance-manager.ts:图表实例的注册和管理中枢,为主题实例更新提供遍历和定位的基础设施,确保每个图表都能接收到主题更新。
+
+* package/vchart/src/theme/theme-manager.ts: 全局主题调度中心,负责主题的注册、获取和全局更新,提供统一的主题管理入口和协调机制。
+
+
+> 格式化效果如图
+
+
+
+### media-query
+
+media-query插件模块实现了媒体查询功能,为了方便理解,可以借助官网的一个demo来解释:
+
+```Typescript
+const getSpec = () => ({
+ type: 'pie',
+ data: [
+ //...
+ ],
+ //query-media配置流程
+ media: [
+ {
+ query: {
+ maxHeight: 200
+ },
+ action: [
+ {
+ filterType: 'legends',
+ filter: [{ orient: 'top' }, { orient: 'bottom' }],
+ spec: { orient: 'left', padding: 0 }
+ },
+ {
+ filterType: 'title',
+ spec: { visible: false }
+ },
+ {
+ filterType: 'chart',
+ spec: { padding: 10 }
+ }
+ ]
+ }
+ ]
+});
+
+```
+
+
+
+
+
+
+
+
+观察这个实例不难发现,在媒体查询的作用下,通过声明媒体查询逻辑,实现了图表在不同高度下动态的布局的样式变化:
+
+* 当图表高度 ≤ 200px 时:
+
+* 图例方向改为左侧,内边距为 0。
+
+* 标题隐藏。
+
+* 图表内边距为 10。
+
+* 当图表高度 > 200px 时:
+
+* 恢复默认样式。
+
+
+
+简单的说,VChart的media-query插件支持我们触发动作(action)的情况下,执行对图表布局的重新排布,实现了图表的响应式设计,提升了用户体验和开发效率。
+
+
+
+
+
+下一章节我将围绕插件的具体实现机制,做更深入的解读:
+
+
+ # 本文档由以下人员修正整理
+ [玄魂](https://github.com/xuanhun)
\ No newline at end of file
diff --git a/docs/assets/contributing/zh/sourcesode/12.2-vchart-plugin-feature-source-code-analysis.md b/docs/assets/contributing/zh/sourcesode/12.2-vchart-plugin-feature-source-code-analysis.md
new file mode 100644
index 0000000000..c0853f63b2
--- /dev/null
+++ b/docs/assets/contributing/zh/sourcesode/12.2-vchart-plugin-feature-source-code-analysis.md
@@ -0,0 +1,101 @@
+---
+title: 12.2 VChart 插件功能源码详解
+
+key words: VisActor,VChart,VTable,VStrory,VMind,VGrammar,VRender,Visualization,Chart,Data,Table,Graph,Gis,LLM
+---
+上文(#12.1 VChart 插件机制 )介绍了VChart中插件的基本使用,这一节我将深入源码重点探索各类插件的实现逻辑;
+
+## 相关源码位置
+
+* ` packages/vchart/src/plugin/chart/formatter/` :格式化插件的核心实现
+
+* ` packages/vchart/src/plugin/chart/media-query/` :媒体查询插件的核心实现
+
+## 格式化插件
+
+### 数值文本格式化
+
+```xml
+ protected _formatSingleText(text: string | number, formatter: string): string | number {
+ const isNumeric = numberSpecifierReg.test(formatter);
+ if (isNumeric && this._numericFormatter) {
+ // 内置的 formatter 逻辑,可以进行缓存性能优化
+ let numericFormat;
+ if (this._numericFormatterCache && this._numericSpecifier) {
+ if (this._numericFormatterCache.get(formatter)) {
+ numericFormat = this._numericFormatterCache.get(formatter);
+ } else {
+ numericFormat = this._numericSpecifier(formatter) as any;
+ this._numericFormatterCache.set(formatter, numericFormat);
+ }
+ return numericFormat(Number(text));
+ }
+ return this._numericFormatter(formatter, Number(text));
+ } else if (formatter.includes('%') && this._timeFormatter) {
+ return this._timeFormatter(formatter, text);
+ }
+ return text;
+ }
+
+
+```
+### 时间文本格式化
+
+VChart对于时间格式的转换在
+
+```xml
+private readonly _timeModeFormat = {
+ utc: TimeUtil.getInstance().timeUTCFormat,
+ local: TimeUtil.getInstance().timeFormat
+};
+
+// 在 onInit 中设置时间格式化器
+onInit(service: IChartPluginService, chartSpec: any) {
+ const { timeMode, timeFormatter } = this._spec;
+
+ if (isFunction(timeFormatter)) {
+ // 使用自定义时间格式化函数
+ this._timeFormatter = timeFormatter;
+ } else if (timeMode && this._timeModeFormat[timeMode]) {
+ // 使用内置的 UTC 或本地时间格式化
+ this._timeFormatter = this._timeModeFormat[timeMode];
+ }
+}
+
+// 在 _formatSingleText 中处理时间格式化
+protected _formatSingleText(text: string | number, formatter: string): string | number {
+ // 数值格式化逻辑...
+
+ // 时间格式化逻辑
+ else if (formatter.includes('%') && this._timeFormatter) {
+ return this._timeFormatter(formatter, text);
+ }
+
+ return text;
+}
+
+```
+### 数据变量替换
+
+1. **模板解析**:
+
+* 使用正则表达式`/\{([^}]+)\}/g`匹配大括号模板
+
+* 支持嵌套格式定义(如`{field:format}`)
+
+1. **字段提取**:
+
+* 通过冒号分割字段名和格式说明(`field:format`)
+
+1. **动态替换**:
+
+* 从数据对象`datum`中提取对应字段值
+
+* 递归应用格式说明进行二次格式化
+
+## Media-query插件
+
+
+
+ # 本文档由以下人员修正整理
+ [玄魂](https://github.com/xuanhun)
\ No newline at end of file
diff --git a/docs/assets/contributing/zh/sourcesode/13.1-vchart-on-demand-loading-mechanism.md b/docs/assets/contributing/zh/sourcesode/13.1-vchart-on-demand-loading-mechanism.md
new file mode 100644
index 0000000000..06ec2e9c04
--- /dev/null
+++ b/docs/assets/contributing/zh/sourcesode/13.1-vchart-on-demand-loading-mechanism.md
@@ -0,0 +1,145 @@
+---
+title: 13.1 VChart 按需加载机制
+
+key words: VisActor,VChart,VTable,VStrory,VMind,VGrammar,VRender,Visualization,Chart,Data,Table,Graph,Gis,LLM
+---
+VChart是一款开箱即用的图表库,默认提供了20+的图表类型,随着图表类型的增加,功能的丰富,包体积也是大家非常关注的一个点,所以VChart通过按需加载机制来满足各种场景对vchart的不同需要;在介绍具体设计之前,我们需要了解两个前置概念:
+
+* vchart图表构成
+
+* 什么是tree-shaking
+
+本文将从这两个角度介绍vchart按需加载的原理
+
+## VChart 图表组成
+
+### 术语定义
+
+在深入了解VChart图表组成之前,我们需要了解以下术语:
+
+* `series` - 图表主体,也称系列,包含一组图元及其对应的图表逻辑。
+
+* `mark` - 基本图形元素,也称基础图元,如点、线条形等。
+
+* `region` - 空间信息元素,关联一组或多组 series,帮助定位空间。
+
+* `component` - 组件,帮助图表阅读和交互的元素,如图例、坐标轴、提示等。
+
+* `layout` - 布局,管理图表元素的空间分布。
+
+* `chart` - 图表抽象概念,整合、管理数据、图元、组件、布局各种元素的管理者。
+
+### 图表定义
+
+#### 逻辑层图表元素
+
+我们将图表的逻辑层元素拆解为以下四个部分:
+
+* series 是图表主体,含一组图元和对应类型的图表逻辑。例如线图中,series 指点和线的集合以及线图所有的逻辑等。
+
+* component 提供辅助能力,帮助图表阅读和交互的组件,比如图例,坐标轴,tooltip,dataZoom 等。
+
+* region 是一个空间信息元素,它可以关联一组或多组 series,帮助 series 进行空间定位,同时 region 还是一个最小组合单元。
+
+* chart 是一个抽象概念,它是对图表的各种元素进行整合、管理布局的管理者,是图表逻辑层的核心上下文。
+
+##### 简单图表
+
+简单图表是由一个 region、一个确定类型的 series、component 和一个管理图表逻辑的 chart 构成。以一个常见的折线图为例,其组成如下
+
+
+
+##### 组合图表
+
+我们将组合图定义为由多个 region、多个确定类型的 series、component 和一个管理图表逻辑的 chart 构成,这里的 chart 我们将其封装为 `type: 'common'` 的组合图表。
+
+在组合图中可以定义若干不同类型的子图。每个子图可以独立配置自己的数据和组件,所有子图默认关联在同一个 region。此时各个子图在 region 上是重叠的。我们以常见的柱线双轴图为例来详细介绍组合图表:
+
+* 首先如果我们需要创建组合图,我们需要声明 `type: 'common'`,表示我们需要创建的图表类型为组合图
+
+* 在上面我们提到,chart 是整合、管理数据、图元、组件、布局各种元素的管理者,从逻辑层组成上他是由 region + series + layout 组成的,而柱线分别对应 'bar' 和 'line' 这两种系列类型,而默认所有的系列都是关联在同一个 region 的,所以这里我们不需要配置 region
+
+* 每个系列可以有自己的数据源,也可以直接将数据源配置在 chart 上,series 中通过 `fromDataId` 或者 `fromDataIndex` 来关联,当前的例子我们选择配置在 chart 上
+
+
+
+如前所述,region 是空间信息元素,可以结合布局利用多个不同定位的 region 对画布进行空间划分;同时,组件也可以指定与 region 关联的关系,当一个组件关联了多个 region 时,会默认收集所有 region 下子图的数据维度进行展示,如下示例所示:
+
+
+
+### 图元 mark
+
+图元是图表视图层对图形的定义,VChart 定义图表中的图元包括基础图元和组合图元。
+
+基础图元包括:标记(symbol)、矩形(rect)、线条(line)、直线(rule)、弧形(arc)、面积(area)、文本(text)、路径(path)、图片(image)、3D 矩形(rect3d)、3D 弧线(arc3d)、多边形(polygon)等。
+
+由多个基础图元进行组合就构成了组合图元,我们把基础图元和组合图元统称为图元。
+
+逻辑层元素(如 series 系列)是由若干图元构成的,如面积图(`'area'`)系列,包括点、线、面积组成,对应的基础图元分别为:标记(Symbol)、线条(line)、面积(area)
+
+
+
+## 什么是tree-shaking
+
+
+
+Tree Shaking 是一种代码优化技术,用于移除 JavaScript 中未使用的代码(dead code)。这个概念最早由 Rollup 提出,后来被 Webpack 等构建工具广泛采用。
+
+
+
+Tree Shaking 的实现主要依赖于 ES Module 的这些特性:
+
+* 导入导出语句只能在模块顶层
+
+* 导入导出的模块名字不能是动态的
+
+* 导入的模块是不可变的
+
+
+
+```javascript
+// 1. 导入导出语句只能在模块顶层
+import { foo } from './foo';
+export const bar = () => {};
+
+// 2. 导入导出的模块名字不能是动态的
+import { 'f' + 'oo' }; // 错误
+
+// 3. 导入的模块是不可变的
+import { foo } from './foo';
+foo = 'bar'; // 错误
+
+```
+打包工具根据文件之间的依赖关系,在标记阶段构建模块依赖图,分析导入导出关系,在打包阶段移除未使用的导出,仅保留使用的代码
+
+
+
+```javascript
+// 1. 标记阶段
+// module.js
+export const foo = () => console.log('foo');
+export const bar = () => console.log('bar');
+
+// main.js
+import { foo } from './module';
+foo(); // foo被标记为使用
+// bar未被使用,标记为dead code
+
+// 2. 删除阶段
+// 打包后,bar函数被删除
+const foo = () => console.log('foo');
+foo();
+
+```
+在使用 Tree Shaking 时,`sideEffects` 配置在确保未使用代码被正确移除方面起着关键作用。在项目的 `package.json` 文件中,`sideEffects` 字段用于告知打包工具哪些文件或模块具有副作用,即除了导出值之外还会执行其他操作(例如修改全局状态、执行初始化代码等)。如果一个模块没有副作用,打包工具可以安全地移除未被引用的部分。
+
+## VChart 按需加载的原理
+
+基于上述对 VChart 图表组成和 Tree Shaking 概念的了解,VChart 按需加载的核心思路就是利用 Tree Shaking 技术,只打包用户实际使用到的图表类型、组件、图元等代码,从而减小包体积。再下一章节,我们将详述一些实现细节。
+
+
+
+
+
+ # 本文档由以下人员修正整理
+ [玄魂](https://github.com/xuanhun)
\ No newline at end of file
diff --git a/docs/assets/contributing/zh/sourcesode/13.2-vchart-on-demand-loading-source-code-analysis.md b/docs/assets/contributing/zh/sourcesode/13.2-vchart-on-demand-loading-source-code-analysis.md
new file mode 100644
index 0000000000..2c917bc77a
--- /dev/null
+++ b/docs/assets/contributing/zh/sourcesode/13.2-vchart-on-demand-loading-source-code-analysis.md
@@ -0,0 +1,188 @@
+---
+title: 13.2 VChart 按需加载源码详解
+
+key words: VisActor,VChart,VTable,VStrory,VMind,VGrammar,VRender,Visualization,Chart,Data,Table,Graph,Gis,LLM
+---
+基于前文,我们已介绍了 VChart 图表组成和 Tree Shaking 概念。基于这两个前置概念,接下来将详细阐述 VChart 按需加载的具体实现。
+
+## VChart图表的核心创建流程
+
+
+
+
+
+## Factory
+
+VChart 的按需加载主要依托 `Factory` 类来达成。该类承担着重要职责,负责对各类图表、系列、组件、图元、Region、布局以及插件进行注册和创建。下面将从注册机制、创建机制以及图表的按需注册这几个方面展开深入分析。
+
+### 注册机制
+
+`Factory` 类提供了一系列静态方法,用于注册不同类型的模块。通过这些方法,模块被注册到 `Factory` 的静态属性中,进而形成一个注册表。具体代码如下:
+
+```xml
+static registerChart(key: string, chart: IChartConstructor) {
+ Factory._charts[key] = chart;
+}
+static registerSeries(key: string, series: ISeriesConstructor) {
+ Factory._series[key] = series;
+}
+static registerComponent(key: string, cmp: IComponentConstructor, alwaysCheck?: boolean) {
+ Factory._components[key] = { cmp, alwaysCheck };
+}
+// 其他注册方法...
+
+```
+### 创建机制
+
+`Factory` 类同样提供了一系列静态方法,用于按需创建模块实例。这些方法会依据类型从注册表中查找对应的构造函数,并创建实例。示例代码如下:
+
+```xml
+static createChart(chartType: string, spec: any, options: IChartOption): IChart | null {
+ if (!Factory._charts[chartType]) {
+ return null;
+ }
+ const ChartConstructor = Factory._charts[chartType];
+ return new ChartConstructor(spec, options);
+}
+static createSeries(seriesType: string, spec: any, options: ISeriesOption) {
+ if (!Factory._series[seriesType]) {
+ return null;
+ }
+ const SeriesConstructor = Factory._series[seriesType];
+ return new SeriesConstructor(spec, options);
+}
+// 其他创建方法...
+
+```
+### 图表的按需注册
+
+以线图为例,下面来看具体的按需注册实现。在 `packages/vchart/src/chart/line/line.ts` 中,有如下代码:
+
+```javascript
+export const registerLineChart = () => {
+ registerLineSeries();
+ Factory.registerChart(LineChart.type, LineChart);
+};
+
+```
+其中 `registerLineSeries` 在 `packages/vchart/src/series/line/line.ts` 中实现,代码如下:
+
+```javascript
+export const registerLineSeries = () => {
+ registerSampleTransform();
+ registerMarkOverlapTransform();
+ registerLineMark();
+ registerSymbolMark();
+ registerLineAnimation();
+ registerScaleInOutAnimation();
+ registerCartesianBandAxis();
+ registerCartesianLinearAxis();
+ Factory.registerSeries(LineSeries.type, LineSeries);
+};
+
+```
+通过上述代码实现,在使用 VChart 时,若调用 `registerLineChart` 注册线图,就会将线图依赖的线的系列、线图元、点图元等必要元素默认注册。具体使用方式如下:
+
+```xml
+import { VChart } from './core';
+import { registerLineChart } from './chart/line';
+VChart.useRegisters([
+ registerLineChart,
+ // 其他需要的模块
+]);
+
+```
+而在 `packages/vchart/src/core/vchart.ts` 中,创建图表实例时并非直接通过路径引用,而是借助 `Factory.createChart` 来创建。如此一来,核心类 `vchart` 就能在不引用所有图表实现的情况下,依据用户注册的图表创建实例。相关代码如下:
+
+```xml
+private _initChart(spec: any) {
+ // ...
+ const chart = Factory.createChart(spec.type, spec, this._getChartOption(spec.type));
+ //...
+ }
+
+```
+## 核心类 VChart 的按需加载
+
+接下来探讨一个问题:以下两种引用 `VChart` 的方式是否存在差异?
+
+* 方法一:
+
+```javascript
+import VChart from '@visactor/vchart';
+
+```
+* 方法二:
+
+```javascript
+import { VChart } from '@visactor/vchart';
+
+```
+答案是肯定的,这两种引用方式所产生的效果不同。下面分析其差异原因。
+
+首先,在 vchart 代码库对应的 `package.json` 中,可看到如下配置:
+
+```xml
+{
+ "sideEffects": [
+ "./*/index-lark.js",
+ "./*/index-wx-simple.js",
+ "./*/index-wx.js",
+ "./*/vchart-all.js",
+ "./*/vchart-simple.js"
+ ],
+}
+
+```
+该配置明确声明了所有有副作用的文件。
+
+在 `packages/vchart/index.ts` 中,有以下导出内容:
+
+```xml
+import { VChart } from './vchart-all';
+export default VChart;
+export * from './core';
+
+```
+其中 `core/index.ts` 文件中又有如下导出:
+
+```javascript
+import { VChart } from './vchart';
+export { VChart, Factory };
+
+```
+所以方法一等价于如下引用,引用的 VChart 是 vchart - all 导出的 VChart 类,方法二引用的相当于从 `core/vchart.ts` 导出的 VChart 类。
+
+```json
+import { default as VChart } from '@visactor/vchart';
+
+```
+其中文件 `vchart-all.ts` 的主要作用是注册和导出 VChart 的所有功能模块:
+
+```json
+VChart.useRegisters([
+ // charts
+ registerLineChart,
+ registerAreaChart,
+ // ...其他图表
+ // components
+ registerCartesianLinearAxis,
+ registerCartesianBandAxis,
+ // ...其他组件
+ // layout
+ registerGridLayout,
+ registerLayout3d,
+ // mark
+ registerAllMarks,
+ // plugin
+ registerDomTooltipHandler,
+ registerCanvasTooltipHandler,
+ // ...其他插件
+]);
+export { VChart };
+
+```
+由于 vchart - all 是声明了有副作用的文件,所以当采用方案一引用 VChart 时,会将所有 `vchart-all` 中依赖的文件都进行打包;而使用方案二引用 VChart 时,仅会打包 `core/vchart.ts`。
+
+ # 本文档由以下人员修正整理
+ [玄魂](https://github.com/xuanhun)
\ No newline at end of file
diff --git a/docs/assets/contributing/zh/sourcesode/14.1.1-react-vchart-introduction.md b/docs/assets/contributing/zh/sourcesode/14.1.1-react-vchart-introduction.md
new file mode 100644
index 0000000000..a5583e1ecd
--- /dev/null
+++ b/docs/assets/contributing/zh/sourcesode/14.1.1-react-vchart-introduction.md
@@ -0,0 +1,133 @@
+---
+title: 14.1.1 React-VChart 简介
+
+key words: VisActor,VChart,VTable,VStrory,VMind,VGrammar,VRender,Visualization,Chart,Data,Table,Graph,Gis,LLM
+---
+## 概览
+
+react-vchart 是 VChart 的 React 封装版本,对外主要提供两种风格的组件:
+
+* `` 以及 ``
+
+* ``等语义化标签
+
+它们的差异如下:
+
+* **适用场景**:
+
+* ``和``封装的原理差异并不多,首先所有Chart组件都是基于 `BaseChart`封装的,核心代码在以下文件:
+
+* [`packages/react-vchart/src/containers/withContainer.tsx`](https://github.com/VisActor/VChart/blob/develop/packages/react-vchart/src/containers/withContainer.tsx)
+
+* [`packages/react-vchart/src/charts/BaseChart.tsx`](https://github.com/VisActor/VChart/blob/develop/packages/react-vchart/src/charts/BaseChart.tsx)
+
+对于语义化标签而言,除了上述模块外,主要是对组件和系列的封装,核心代码如下:
+
+* [`packages/react-vchart/src/components/BaseComponent.tsx`](https://github.com/VisActor/VChart/blob/develop/packages/react-vchart/src/components/BaseComponent.tsx)
+
+* [`packages/react-vchart/src/series/BaseSeries.tsx`](https://github.com/VisActor/VChart/blob/develop/packages/react-vchart/src/series/BaseSeries.tsx)
+
+
+
+以AreaChart为例,主要的类关系图如下
+
+
+
+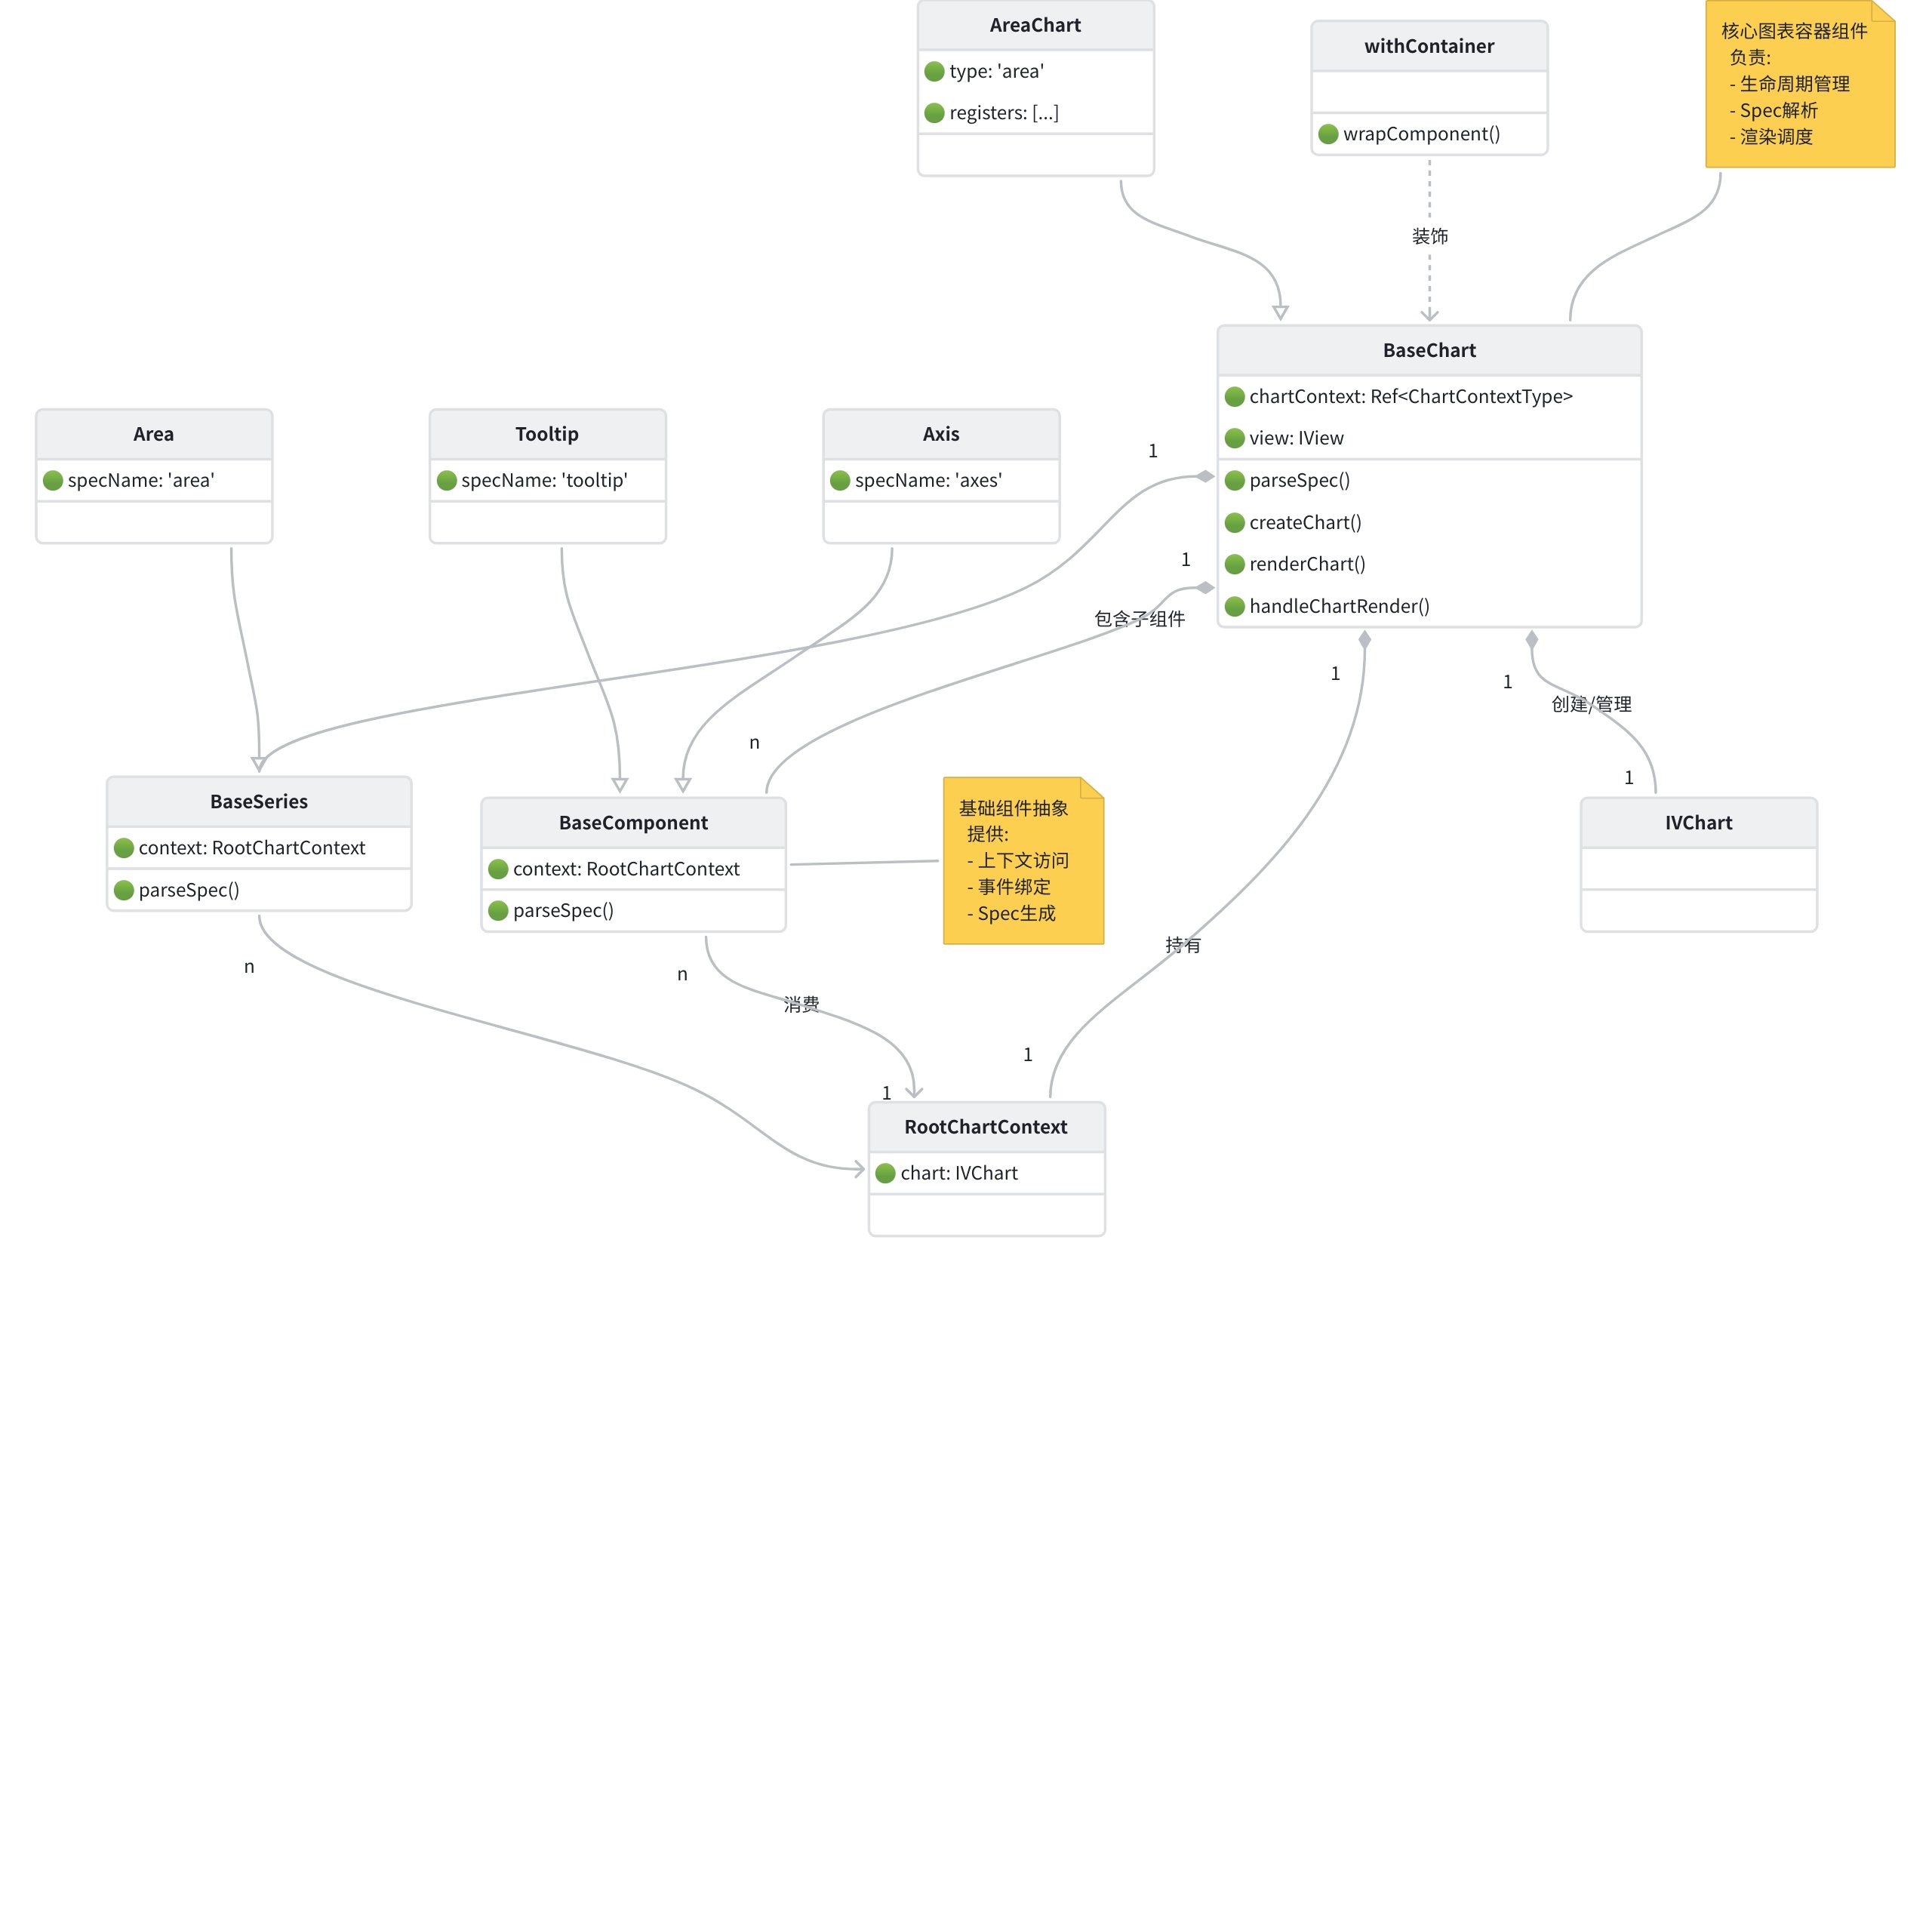
+
+
+
+在接下来的章节,我们将详细的分析Chart组件、系列组件、VChart组件的封装
+
+
+
+
+
+
+
+
+
+
+
+ # 本文档由以下人员修正整理
+ [玄魂](https://github.com/xuanhun)
\ No newline at end of file
diff --git a/docs/assets/contributing/zh/sourcesode/14.1.2-react-vchart-source-code-analysis.md b/docs/assets/contributing/zh/sourcesode/14.1.2-react-vchart-source-code-analysis.md
new file mode 100644
index 0000000000..2dcf473869
--- /dev/null
+++ b/docs/assets/contributing/zh/sourcesode/14.1.2-react-vchart-source-code-analysis.md
@@ -0,0 +1,461 @@
+---
+title: 14.1.2 react-vchart 源码详解
+
+key words: VisActor,VChart,VTable,VStrory,VMind,VGrammar,VRender,Visualization,Chart,Data,Table,Graph,Gis,LLM
+---
+## BaseChart的实现
+
+react-vchart中所有图表的封装都是通过高阶组件`createChart`来实现的,接下来我们以``的封装解读
+
+``的封装如下:
+
+```javascript
+export const VChart = createChart
+
+Taro is a framework that can run in various mini-program environments. When using GeneralChart, you can pass in different environments to adapt:
+
+```Typescript
+const strategies = {
+ lark: () =>
+
+In the following chapters, we will analyze the encapsulation of the WX-VChart component in detail.
+
+
+
+
+
+
+
+ # This document was revised and organized by the following person
+ [玄魂](https://github.com/xuanhun)
\ No newline at end of file
diff --git a/docs/assets/contributing/en/sourcecode/14.2.2-taro-vchart-source-code-analysis.md b/docs/assets/contributing/en/sourcecode/14.2.2-taro-vchart-source-code-analysis.md
new file mode 100644
index 0000000000..af51af7843
--- /dev/null
+++ b/docs/assets/contributing/en/sourcecode/14.2.2-taro-vchart-source-code-analysis.md
@@ -0,0 +1,189 @@
+---
+title: 14.2.2 Taro-VChart Source Code Explanation
+
+key words: VisActor,VChart,VTable,VStrory,VMind,VGrammar,VRender,Visualization,Chart,Data,Table,Graph,Gis,LLM
+---
+## Compatibility with Host Environment
+
+The Taro framework, based on the React technology stack, provides cross-platform component development capabilities (https://taro-docs.jd.com/docs/component). A Taro component consists of the following files:
+
+* index.config.ts: Component compilation configuration (optional)
+
+* index.tsx: Component logic and template content
+
+* index.module.scss: Component styles (CSS Modules scheme recommended)
+
+
+
+### File Description
+
+1. **index.tsx**
+
+Main component file, includes:
+
+* Define the component using `function Component() { ... }` or `class Component extends Component { ... }`
+
+* Write component structure using JSX template syntax
+
+* Export the component through export default
+
+* Component lifecycle management (using Hooks or Class lifecycle)
+
+* Event handling (following React synthetic event specifications)
+
+
+
+2. **index.module.scss**
+
+Component style file:
+
+* Supports Sass/Scss preprocessing
+
+* Use CSS Modules to avoid style pollution
+
+* Import using `import styles from './index.module.scss'`
+
+* Bind styles using className={styles.container}
+
+
+
+3. **index.config.ts** (optional)
+
+Component compilation configuration:
+
+* Define component name: `defineCustomComponent({ name: 'my-component' })`
+
+* Set default values for component properties
+
+* Configure native mini-program components needed by the component
+
+* Cross-platform compatibility configuration
+
+
+
+### 1. Core Entry Module
+
+`index.tsx` is the entry file of the entire library, exporting two core components `VChart` and `VChartSimple`:
+
+
+```xml
+import { VChartSimple } from './simple';
+import { VChart } from './vchart';
+
+export * from './charts'; // 导出所有图表组件
+export { VChart, VChartSimple }; // 导出核心适配器
+export default VChart; // 默认导出
+
+```
+Three-layer export strategy is implemented here:
+
+* Chart component set: Export all predefined charts in bulk through export *
+
+* Core adapters: Individually export the two main components, VChart and VChartSimple
+
+* Default export: Maintain compatibility with the original VChart API
+
+## 2. Environment Adaptation Layer
+
+### 2.1 VChart Component
+
+`vchart.tsx` is the main environment adaptation component, which will choose the appropriate rendering strategy based on the current environment:
+
+
+```xml
+const strategies = {
+ lark: () =>
+
+### General Chart Component
+
+`components/general-chart/index.tsx` is the core rendering component in the mini program environment, with the following key technical points:
+
+* Asynchronous DOM acquisition mechanism (solving Feishu mini program issues)
+
+* Three-canvas rendering architecture (main canvas, interactive canvas, auxiliary canvas)
+
+* Event delegation and redirection
+
+* Environment-specific configuration
+
+### Web Chart Component
+
+`components/web-chart/index.tsx` is the rendering component for the browser environment, with the main differences from the mini program component:
+
+* Single container rendering (vs. three-canvas structure)
+
+* Synchronous DOM acquisition (vs. asynchronous loop attempts)
+
+* Direct event binding (vs. event delegation)
+
+## Chart Control Layer
+
+`utils/tt-canvas/index.ts` is the controller for chart instances, TTCanvas is responsible for managing VChart instances, receiving props passed by GeneralChart, and achieving seamless integration of chart capabilities in the mini program ecosystem through abstract general interfaces.
+
+
+
+The core responsibilities of TTCanvas:
+
+* Lifecycle management (creation, rendering, updating, releasing)
+
+* Cross-end parameter bridging (converting mini program parameters to VChart usable format)
+
+* Event system adaptation (binding custom events)
+
+* Rendering strategy control (environment-specific configuration)
+
+
+
+
+
+
+ # This document was revised and organized by the following person
+ [玄魂](https://github.com/xuanhun)
\ No newline at end of file
diff --git a/docs/assets/contributing/en/sourcecode/14.3.1-lark-vchart-introduction.md b/docs/assets/contributing/en/sourcecode/14.3.1-lark-vchart-introduction.md
new file mode 100644
index 0000000000..db70c747fa
--- /dev/null
+++ b/docs/assets/contributing/en/sourcecode/14.3.1-lark-vchart-introduction.md
@@ -0,0 +1,39 @@
+---
+title: 14.3.1 Lark-VChart 简介
+
+key words: VisActor,VChart,VTable,VStrory,VMind,VGrammar,VRender,Visualization,Chart,Data,Table,Graph,Gis,LLM
+---
+## 概览
+
+lark-vchart 是 VChart 的 Lark 小程序封装版本,提供了在飞书小程序环境下的 VChart 封装。
+
+* 关于更多飞书小程序的宿主环境介绍,请参见官方文档:https://open.feishu.cn/document/client-docs/gadget/introduction/host-environment
+
+* Lark-vchart 包的使用示例请参见文档:https://github.com/VisActor/lark-vchart-example
+
+
+
+## 核心代码结构
+
+Lark-vchart 包的核心实现包含两个部分:
+
+* Lark 环境相关适配:Lark 环境的适配逻辑包含必要的实现代码及声明,其内容存放于 `packages/lark-vchart/src` 中;
+
+* VChart 产物:vchart 图表库相关的能力直接引用了 VChart 的打包产物,其内容存放于 `packages/lark-vchart/src/vchart/index.js` 中。
+
+
+
+在接下来的章节,我们将详细的分析Lark-VChart组件的封装。
+
+
+
+
+
+
+
+
+
+
+
+ # 本文档由以下人员修正整理
+ [玄魂](https://github.com/xuanhun)
\ No newline at end of file
diff --git a/docs/assets/contributing/en/sourcecode/14.3.2-lark-vchart-source-code-analysis.md b/docs/assets/contributing/en/sourcecode/14.3.2-lark-vchart-source-code-analysis.md
new file mode 100644
index 0000000000..d25465e177
--- /dev/null
+++ b/docs/assets/contributing/en/sourcecode/14.3.2-lark-vchart-source-code-analysis.md
@@ -0,0 +1,55 @@
+---
+title: 14.3.2 Lark-VChart Source Code Explanation
+
+key words: VisActor,VChart,VTable,VStrory,VMind,VGrammar,VRender,Visualization,Chart,Data,Table,Graph,Gis,LLM
+---
+
+
+## Compatibility with Host Environment
+
+Feishu gadgets provide the ability to create custom components (https://open.feishu.cn/document/client-docs/gadget/component-component/custom-components/custom-components), each custom gadget includes several parts:
+
+* index.js: Component registration logic
+
+* index.json: Component declaration
+
+* index.ttml: Component template content
+
+* index.ttss: Component style
+
+
+
+### Component Declaration
+
+To ensure the VChart capability in the Feishu environment, Lark VChart's custom components declare three canvases:
+
+* Render canvas: Used to render VChart chart content;
+
+* Hit canvas: Although called Hit Canvas, VChart no longer uses an additional canvas for graphic picking. This canvas is mainly used for additional canvas operations. For example, pixel matching logic in the word cloud layout algorithm and texture rendering logic need to be performed in an additional canvas;
+
+* Tooltip canvas: Used to render additional tooltip content, separating Render canvas and Tooltip canvas to avoid redrawing the entire canvas.
+
+
+
+### Component Registration
+
+Component registration includes properties and necessary lifecycle.
+
+**Component Properties:**
+
+* spec: Same as VChart's spec configuration, but an observer is added in the registration to monitor changes in the chart spec. When the spec is updated, vchart.updateSpec() will be automatically called;
+
+* options: Same as VChart's options configuration;
+
+* events: Same as VChart's registered events, vchart.on will be called during chart initialization to listen to corresponding events.
+
+**Component Methods:**
+
+* init: The core of VChart rendering requires the Canvas. In the init function, Lark VChart will find the corresponding canvas component and initialize the VChart instance to execute the rendering process. The rendering process is the same as a regular VChart example;
+
+* bindEvent: Bind events and filter out potentially duplicate PC & mobile events in the Feishu environment.
+
+
+
+ # This document was revised and organized by the following personnel
+ [Xuanhun](https://github.com/xuanhun)
\ No newline at end of file
diff --git a/docs/assets/contributing/en/sourcecode/14.4.1-tt-vchart-introduction.md b/docs/assets/contributing/en/sourcecode/14.4.1-tt-vchart-introduction.md
new file mode 100644
index 0000000000..dd0939f212
--- /dev/null
+++ b/docs/assets/contributing/en/sourcecode/14.4.1-tt-vchart-introduction.md
@@ -0,0 +1,35 @@
+---
+title: 14.4.1 TT-VChart Introduction
+
+key words: VisActor,VChart,VTable,VStrory,VMind,VGrammar,VRender,Visualization,Chart,Data,Table,Graph,Gis,LLM
+---
+## Overview
+
+TT-vchart is the Douyin mini program encapsulated version of VChart, providing VChart encapsulation in the Feishu mini program environment.
+
+* For more information about the host environment of Byte mini programs, please refer to the official documentation: https://developer.open-douyin.com/docs/resource/zh-CN/mini-app/develop/tutorial/custom-component/custom-component
+
+
+
+## Core Code Structure
+
+The core implementation of the TT-vchart package consists of two parts:
+
+* Douyin mini program environment adaptation: The adaptation logic for the Douyin mini program environment includes necessary implementation code and declarations, which are stored in `packages/tt-vchart/src`;
+
+* VChart products: The capabilities related to the vchart chart library directly reference the packaged products of VChart, which are stored in `packages/tt-vchart/src/vchart/index.js`.
+
+
+
+In the following chapters, we will analyze the encapsulation of the TT-VChart component in detail.
+
+
+
+
+
+
+
+
+
+ # This document was revised and organized by the following personnel
+ [Xuanhun](https://github.com/xuanhun)
\ No newline at end of file
diff --git a/docs/assets/contributing/en/sourcecode/14.4.2-tt-vchart-source-code-analysis.md b/docs/assets/contributing/en/sourcecode/14.4.2-tt-vchart-source-code-analysis.md
new file mode 100644
index 0000000000..5bc50b51ad
--- /dev/null
+++ b/docs/assets/contributing/en/sourcecode/14.4.2-tt-vchart-source-code-analysis.md
@@ -0,0 +1,55 @@
+---
+title: 14.4.2 TT-VChart Source Code Explanation
+
+key words: VisActor,VChart,VTable,VStrory,VMind,VGrammar,VRender,Visualization,Chart,Data,Table,Graph,Gis,LLM
+---
+
+
+## Compatibility with Host Environment
+
+Douyin widgets provide the ability to create custom components (https://developer.open-douyin.com/docs/resource/zh-CN/mini-app/develop/tutorial/custom-component/custom-component). Each custom widget includes several parts:
+
+* index.js: Component registration logic
+
+* index.json: Component declaration
+
+* index.ttml: Component template content
+
+* index.ttss: Component style
+
+
+
+### Component Declaration
+
+To ensure VChart capabilities in the Douyin environment, the TT VChart custom component declares three canvases:
+
+* Render canvas: Used to render VChart chart content;
+
+* Hit canvas: Although called Hit Canvas, VChart no longer uses an additional canvas for graphic picking. This canvas is mainly used for additional canvas operations. For example, pixel matching logic in the word cloud layout algorithm and texture rendering logic need to be performed on an additional canvas;
+
+* Tooltip canvas: Used to render additional tooltip content, separating Render canvas and Tooltip canvas to avoid redrawing the entire canvas.
+
+
+
+### Component Registration
+
+Component registration includes properties and necessary lifecycle.
+
+**Component Properties:**
+
+* spec: Same as VChart's spec configuration, but an observer is added in the registration to monitor changes in the chart spec. When the spec is updated, vchart.updateSpec() will be automatically called;
+
+* options: Same as VChart's options configuration;
+
+* events: Same as VChart's registered events, vchart.on will be called during chart initialization to listen for corresponding events.
+
+**Component Methods:**
+
+* init: The core of VChart rendering requires a Canvas. In the init function, tt vchart will find the corresponding canvas component and initialize the VChart instance to execute the rendering process. The rendering process is the same as a regular VChart example;
+
+* bindEvent: Bind events and filter out potentially duplicate PC & mobile events in the Douyin environment.
+
+
+
+ # This document was revised and organized by the following personnel
+ [Xuanhun](https://github.com/xuanhun)
\ No newline at end of file
diff --git a/docs/assets/contributing/en/sourcecode/14.5.1-wx-vchart-introduction.md b/docs/assets/contributing/en/sourcecode/14.5.1-wx-vchart-introduction.md
new file mode 100644
index 0000000000..f3fa133fbc
--- /dev/null
+++ b/docs/assets/contributing/en/sourcecode/14.5.1-wx-vchart-introduction.md
@@ -0,0 +1,33 @@
+---
+title: 14.5.1 WX-VChart Introduction
+
+key words: VisActor,VChart,VTable,VStrory,VMind,VGrammar,VRender,Visualization,Chart,Data,Table,Graph,Gis,LLM
+---
+## Overview
+
+wx-vchart is the WeChat Mini Program encapsulation version of VChart, providing VChart encapsulation in the WeChat Mini Program environment.
+
+* For more introduction to the host environment of WeChat Mini Programs, please refer to the official documentation: https://developers.weixin.qq.com/miniprogram/dev/framework/
+
+
+
+## Core Code Structure
+
+The core implementation of the wx-vchart package consists of two parts:
+
+* WeChat Mini Program environment adaptation: The adaptation logic for the WeChat Mini Program environment includes necessary implementation code and declarations, which are stored in `packages/wx-vchart/miniprogram`;
+
+* VChart product: The capabilities related to the vchart chart library directly reference the packaged product of VChart, which is stored in `packages/wx-vchart/miniprogram/src/vchart/index.js`.
+
+
+
+In the following chapters, we will analyze the encapsulation of the WX-VChart component in detail.
+
+
+
+
+
+
+
+ # This document was revised and organized by the following personnel
+ [Xuanhun](https://github.com/xuanhun)
\ No newline at end of file
diff --git a/docs/assets/contributing/en/sourcecode/14.5.2-wx-vchart-source-code-analysis.md b/docs/assets/contributing/en/sourcecode/14.5.2-wx-vchart-source-code-analysis.md
new file mode 100644
index 0000000000..02aacad958
--- /dev/null
+++ b/docs/assets/contributing/en/sourcecode/14.5.2-wx-vchart-source-code-analysis.md
@@ -0,0 +1,53 @@
+---
+title: 14.5.2 WX-VChart Source Code Explanation
+
+key words: VisActor,VChart,VTable,VStrory,VMind,VGrammar,VRender,Visualization,Chart,Data,Table,Graph,Gis,LLM
+---
+## Compatibility with Host Environment
+
+WeChat mini-programs provide the ability to create custom components (https://developers.weixin.qq.com/miniprogram/dev/framework/custom-component/), a custom component consists of four files: `json` `wxml` `wxss` `js`:
+
+* index.js: Component registration logic
+
+* index.json: Component declaration
+
+* index.wxml: Component template content
+
+* index.wxss: Component style
+
+
+
+### Component Declaration
+
+To ensure the VChart capability in the WeChat environment, the WX VChart custom component declares three canvases:
+
+* Render canvas: Used to render VChart chart content;
+
+* Hit canvas: Although called Hit Canvas, VChart no longer uses an additional canvas for graphic picking. This canvas is mainly used for executing additional canvas operations. For example, pixel matching logic in the word cloud layout algorithm and texture rendering logic need to be performed on an additional canvas;
+
+* Tooltip canvas: Used to render additional tooltip content, separating Render canvas and Tooltip canvas to avoid redrawing the entire canvas.
+
+
+
+### Component Registration
+
+Component registration includes properties and necessary lifecycle.
+
+**Component Properties:**
+
+* spec: Same as VChart's spec configuration, but an observer is added in the registration to monitor changes in the chart spec. When the spec is updated, vchart.updateSpec() will be automatically called;
+
+* options: Same as VChart's options configuration;
+
+* events: Same as VChart's registered events, vchart.on will be called during chart initialization to listen to corresponding events.
+
+**Component Methods:**
+
+* init: The core of VChart rendering requires the Canvas, in the init function, wx vchart will find the corresponding canvas component and initialize the VChart instance to execute the rendering process. The rendering process is the same as a regular VChart example;
+
+* bindEvent: Bind events and filter out potentially duplicate PC & mobile events in the WeChat environment.
+
+
+
+ # This document was revised and organized by the following personnel
+ [Xuanhun](https://github.com/xuanhun)
\ No newline at end of file
diff --git a/docs/assets/contributing/en/sourcecode/14.6.1-openinula-vchart-introduction.md b/docs/assets/contributing/en/sourcecode/14.6.1-openinula-vchart-introduction.md
new file mode 100644
index 0000000000..804495283d
--- /dev/null
+++ b/docs/assets/contributing/en/sourcecode/14.6.1-openinula-vchart-introduction.md
@@ -0,0 +1,109 @@
+---
+title: 14.6.1 Introduction to Openinula-VChart
+
+key words: VisActor,VChart,VTable,VStrory,VMind,VGrammar,VRender,Visualization,Chart,Data,Table,Graph,Gis,LLM
+---
+# I. Component Introduction
+
+`@visactor/openinula-vchart` is a packaged version of the [VChart](https://visactor.io/vchart) chart library provided by [VisActor](https://visactor.io/) for [Openinula](https://openinula.net/). It offers a series of easy-to-use [Openinula](https://openinula.net/) components for conveniently creating various types of charts in the [Openinula](https://openinula.net/) development environment, including line charts, bar charts, pie charts, etc. The components of `@visactor/openinula-vchart` are highly customizable and extensible, allowing different chart effects to be achieved by passing different parameters and configurations.
+
+# II. **Component Overview**
+
+**openinula-vchart** provides two styles of components:
+
+1. **Unified entry components,** such as: `| + +Features + |
+
+` |
+
+` | + +Semantic components + |
| + +Configuration method + | + +Full spec + | + +Full spec, but only supports some charts + | + +Componentized declaration + |
| + +Extensibility + | + +High + | + +High + | + +Medium + |
| + +Development experience + | + +Configuration-driven + | + +Configuration-driven + | + +Declarative development + |
+
+**Typical Subcomponent Implementation**
+
+Take the Marker component as an example:
+
+```xml
+// 实现 parseSpec 方法
+class MarkPoint extends BaseComponent {
+ static parseSpec(props: MarkProps) {
+ return {
+ specName: 'markPoint', // 对应 spec 中的字段名
+ isSingle: false, // 允许多个 MarkPoint 组件
+ spec: {
+ type: props.type,
+ style: props.style
+ }
+ };
+ }
+}
+
+```
+### Create Chart
+
+
+```xml
+const createChart = (props: Props) => {
+ // 1. 实例化图表(利用传入的图表构造器)
+ const cs = new props.vchartConstrouctor(
+ parseSpec(props), // 合并后的图表spec
+ {
+ ...props.options, // 透传图表配置
+ onError: props.onError, // 异常处理回调
+ autoFit: true, // 开启自动尺寸适配
+ dom: props.container // 绑定 DOM 容器
+ }
+ );
+
+ // 2. 更新上下文引用
+ chartContext.current = { ...chartContext.current, chart: cs };
+
+ // 3. 重置卸载标记
+ isUnmount.current = false;
+};
+
+```
+#### spec analysis
+
+
+```Typescript
+const parseSpec = (props: Props) => {
+ // 决策逻辑:优先使用全量 spec 配置
+ let spec: ISpec = undefined;
+
+ // 全量 spec 模式(直接使用传入的 spec)
+ if (hasSpec && props.spec) {
+ spec = props.spec;
+ }
+ // 声明式组件模式(合并 props 和子组件生成的 spec)
+ else {
+ spec = {
+ ...prevSpec.current, // 来自组件 props 的配置
+ ...specFromChildren.current // 来自子组件解析的配置
+ } as ISpec;
+ }
+
+ // 自定义 tooltip 处理(React 组件与 VChart 的桥接)
+ const tooltipSpec = initCustomTooltip(setTooltipNode, props, spec.tooltip);
+ if (tooltipSpec) {
+ spec.tooltip = tooltipSpec; // 覆盖默认 tooltip 配置
+ }
+
+ return spec;
+};
+
+```
+### Render Charts
+
+
+```xml
+ const renderChart = () => {
+ if (chartContext.current.chart) {
+ chartContext.current.chart.renderSync({
+ reuse: false
+ });
+ handleChartRender();
+ }
+ };
+
+```
+Get the mounted instance through the chartContext and call the instance's `renderSync` method to render the chart.
+
+### Event Binding & Context Update
+
+```Typescript
+const handleChartRender = () => {
+ // 1. 安全检查:确保组件未卸载且图表实例存在
+ if (!isUnmount.current) {
+ if (!chartContext.current || !chartContext.current.chart) {
+ return;
+ }
+
+ // 2. 事件系统:重新绑定所有图表事件
+ bindEventsToChart(chartContext.current.chart, props, eventsBinded.current, CHART_EVENTS);
+
+ // 3. 获取底层视图实例
+ const newView = chartContext.current.chart.getCompiler().getVGrammarView();
+
+ // 4. 状态更新:触发子组件重渲染
+ setUpdateId(updateId + 1);
+
+ // 5. 生命周期回调:通知父组件渲染完成
+ if (props.onReady) {
+ props.onReady(chartContext.current.chart, updateId === 0); // 区分首次渲染
+ }
+
+ // 6. 更新视图上下文
+ setView(newView);
+ }
+};
+
+```
+This section mainly executes the processing logic after the chart rendering is completed, mainly implementing:
+
+1. Event Update:
+
+Dynamic update of event listeners is achieved through `bindEventsToChart`, using a differential comparison strategy to avoid duplicate bindings.
+
+It is particularly important to remount events after the chart is re-rendered (such as data updates) to ensure the correctness of interactive responses.
+
+1. Bidirectional State Synchronization
+
+Trigger child component updates through setUpdateId (using the key value change mechanism), while storing the VGrammar view instance in the React context to achieve state synchronization between the Canvas layer and the React component layer. The judgment of updateId === 0 distinguishes the first rendering.
+
+1. Lifecycle Notification
+
+Achieve parent-child communication in a layered architecture through the onReady callback. After the underlying chart completes the rendering pipeline (layout, drawing, animation), notify the business layer to perform subsequent operations (such as data fetching, associated interactions, etc.).
+
+# Three, Series
+
+
+
+
+
+
+## Event Binding
+
+
+```Typescript
+const addMarkEvent = (events: EventsProps) => {
+ // 1. 安全校验:确保事件对象和图表实例存在
+ if (!events || !context.chart) {
+ return;
+ }
+
+ // 2. 清理旧事件:遍历解除所有已绑定的事件监听
+ if (bindedEvents.current) {
+ Object.keys(bindedEvents.current).forEach(eventKey => {
+ context.chart.off(REACT_TO_VCHART_EVENTS[eventKey], bindedEvents.current[eventKey]);
+ bindedEvents.current[eventKey] = null; // 清除引用
+ });
+ }
+
+ // 3. 绑定新事件:动态建立 React 事件到 VChart 的映射关系
+ events &&
+ Object.keys(events).forEach(eventKey => {
+ if (!bindedEvents.current?.[eventKey]) {
+ // 通过事件类型映射表转换事件名
+ context.chart.on(REACT_TO_VCHART_EVENTS[eventKey], handleEvent);
+
+ // 更新绑定记录
+ if (!bindedEvents.current) {
+ bindedEvents.current = {};
+ }
+ bindedEvents.current[eventKey] = handleEvent;
+ }
+ });
+};
+
+```
+1. Input Check: The function receives events as a parameter. If events is empty or context.chart does not exist, the function will return immediately without further operations.
+
+1. Unbind Old Events:
+
+If bindedEvents.current exists, it means events have been bound before. At this point, each event in bindedEvents.current will be iterated over, and these events will be unbound using the context.chart.off method, setting the value of the corresponding event key in bindedEvents.current to null.
+
+1. Bind New Events:
+
+If events exist, each event in events will be iterated over.
+
+For events that do not exist in bindedEvents.current, i.e., the event context, the handleEvent will be bound to the corresponding event using the context.chart.on method, and the context will be updated.
+
+## Event Clearing
+
+```xml
+const removeMarkEvent = () => {
+ addMarkEvent({});
+};
+
+```
+When the component is uninstalled, the events will be cleared
+
+## spec analysis
+
+```Typescript
+ (Comp as any).parseSpec = (compProps: T & { updateId?: number; componentId?: string }) => {
+ // 从组件属性中移除不需要的键,生成新的系列规范
+ const newSeriesSpec = pickWithout
+
+## Event Binding
+
+```Typescript
+// 检查是否需要更新(通过 updateId 变化检测)
+if (props.updateId !== updateId.current) {
+ // 更新当前记录的版本号,保持与父组件同步
+ updateId.current = props.updateId;
+
+ // 重新绑定图表事件(仅当组件支持事件时执行)
+ const hasPrevEventsBinded = supportedEvents
+ ? bindEventsToChart( // 调用事件绑定工具方法
+ context.chart, // 从上下文获取图表实例
+ props, // 当前组件属性(含新事件处理器)
+ eventsBinded.current, // 之前绑定的事件缓存
+ supportedEvents // 该组件支持的事件类型映射
+ )
+ : false;
+
+ // 如果事件绑定成功,更新事件缓存引用
+ if (hasPrevEventsBinded) {
+ eventsBinded.current = props; // 保存当前事件配置用于下次差异比较
+ }
+}
+
+```
+* Update Detection:
+
+Determine whether the component needs to be updated by checking if props.updateId !== updateId.current. The updateId is an update identifier from the parent component (usually a chart) used to trigger the update process of the child component.
+
+* Event Rebinding
+
+When an update is detected, call the bindEventsToChart method to rebind events. Here, a conditional check is used:
+
+* If the component supports events (supportedEvents exists), perform event binding
+
+* After successful binding, update the eventsBinded cache to record the currently bound event properties
+
+* State Synchronization - Update updateId.current to the latest value to ensure the accuracy of subsequent update detections.
+
+## spec Parsing
+
+```Typescript
+ (Comp as any).parseSpec = (props: T & { updateId?: number; componentId?: string }) => {
+ // 使用 pickWithout 函数从 props 中移除 notSpecKeys 中指定的键,得到新的组件配置
+ const newComponentSpec: Partial
+
+## Event Extraction
+
+```Typescript
+// 泛型方法:从组件属性中提取有效事件配置
+export const findEventProps =
+
+## chartContext
+
+
+```Typescript
+export function withChartInstance
+
+The relationship of graphics-related classes in vrender is as follows:
+
+
+
+In other words, through the `vchart` instance, we can obtain the root node `stage` of the scene tree. By recursively traversing the child nodes of `stage`, we can get all the rendered graphics. In the implementation of vrender, all graphics have an `attribute` property to maintain the display configuration of the graphics. Therefore, the task is broken down into two parts:
+
+* Construct the child nodes of the svg based on the child nodes of `stage`
+
+* Convert the `attribute` of vrender graphic elements into the corresponding attributes of svg nodes
+
+## Core File Structure
+
+```plaintext
+src/svg/
+├── convert.ts - 转换入口,处理图表到SVG的转换
+├── graphic.ts - 图形元素转换的核心实现
+├── util.ts - 通用工具函数集合
+├── pattern.ts - 纹理属性转换
+├── shadow.ts - shadow属性转换
+├── arc.ts - 圆弧图形相关转换
+├── area.ts - 区域图形相关转换
+├── line.ts - 线图形相关转换
+├── polygon.ts - 多边形图形相关转换
+├── rect.ts - 矩形图形相关转换
+└── symbol.ts - symbol图形相关转换
+
+
+```
+In the following chapters, we will describe in detail some core code implementations
+
+
+
+
+
+ # This document was revised and organized by the following personnel
+ [玄魂](https://github.com/xuanhun)
\ No newline at end of file
diff --git a/docs/assets/contributing/en/sourcecode/14.8.2-vchart-svg-plugin-source-code-analysis.md b/docs/assets/contributing/en/sourcecode/14.8.2-vchart-svg-plugin-source-code-analysis.md
new file mode 100644
index 0000000000..38d040a791
--- /dev/null
+++ b/docs/assets/contributing/en/sourcecode/14.8.2-vchart-svg-plugin-source-code-analysis.md
@@ -0,0 +1,191 @@
+---
+title: 14.8.2 vchart-svg-plugin Source Code Explanation
+
+key words: VisActor,VChart,VTable,VStrory,VMind,VGrammar,VRender,Visualization,Chart,Data,Table,Graph,Gis,LLM
+---
+## Conversion Entry (convert.ts)
+
+The entry file `convert.ts` provides the core method `convertVChartToSvg`, which mainly undertakes the following important responsibilities:
+
+* **Obtain** `**stage**` **information**: By passing in the vchart instance object, the `getStage` method is called to obtain the vrender's graphic scene tree `stage`, which is the basis for subsequent operations.
+
+* **Set viewport attributes**: Extract viewport information `viewBox` from `stage`, and based on this, generate svg viewport attributes. These attributes define the display area and size of the svg graphic, ensuring that the graphic can be correctly presented in the svg environment.
+
+* **Handle background**: Check the background information `background` of `stage`, and if there is a background, call the `convertCommonStyle` method to convert it into the rectangle element style required by svg.
+
+* **Generate SVG tags**: Combine the processed background rectangle elements and the converted svg elements of `stage` child nodes to generate a complete svg tag string and return it.
+
+```xml
+export const convertVChartToSvg = (vchart: any): string => {
+ // 1. 获取舞台信息
+ const stage = vchart.getStage();
+
+ // 2. 设置视口属性
+ const viewBox = stage.viewBox;
+ const attrs = {
+ width: `${width}px`,
+ height: `${height}px`,
+ viewBox: `${x} ${y} ${width} ${height}`,
+ };
+ // 3. 处理背景
+ const background = stage.background;
+ let backgroundRect = "";
+ if (background) {
+ const style = convertCommonStyle({ fill: background }, stage);
+ // ...
+ }
+ // 4. 生成SVG标签
+ return ``;
+};
+
+```
+## Graphic Transformation Core (graphic.ts)
+
+`graphic.ts` serves as the core graphic processing file in the SVG transformation module, responsible for converting various graphic elements into SVG nodes. This module supports the conversion of multiple graphic types, covering basic graphics (such as paths, rectangles, arcs, etc.) and complex graphic groups.
+
+### Composite Graphic Processing
+
+`parseGroup` is the main entry function for parsing graphics. It recursively processes child node types to gradually generate SVG elements. The specific implementation steps are as follows:
+
+* **Basic Check**: First, check whether the passed `group` object is valid. If `group` does not exist or is invalid, return an empty string directly. It should be noted that `stage` itself is also a special kind of `group`.
+
+* **Attribute Merging**: Merge the theme style `theme?.combinedTheme?.[group.type]` of the `group` with its own attributes `group.attribute` to ensure that the graphics can inherit the correct style.
+
+* **Processing by Type**: When the type of `group` is `group`, it indicates a composite graphic. At this point, first call the `convertCommonStyle` method to generate common styles, then sort the child elements of the `group`. The sorting basis is the `zIndex` attribute of the child elements (if `zIndex` does not exist, it defaults to 0). After sorting, recursively call the `parseGroup` method to process each child element and combine the results to generate the final composite graphic SVG element.
+
+* **Processing Other Types**: If `group` is not a composite graphic type, that is, a simple graphic element, call the `parseSimpleGraphic` method to process other types of graphics.
+
+```xml
+export const parseGroup = (group: any): string => {
+ // 1. 基础检查
+ if (!group ||!group.isValid()) {
+ return "";
+ }
+ // 2. 属性合并
+ const attribute = {
+ ...group.theme?.combinedTheme?.[group.type],
+ ...group.attribute
+ };
+ // 3. 根据类型处理
+ if (group.type === "group") {
+ // 处理组合图形
+ const commonStyle = convertCommonStyle(attribute, group);
+ const children = group.children;
+
+ // 排序子元素
+ children.sort((a: any, b: any) => {
+ return (a.attribute.zIndex ?? 0) - (b.attribute.zIndex ?? 0);
+ });
+ // 生成组合内容
+ return `
+
+## 3.1.5 Component Configuration
+
+VChart also supports configuring various components of the chart, such as axes, legends, crosshair, and tooltip. Currently, the components supported by VChart are:
+
+# 3.2 Series
+
+## 3.2.1 Concept and Types
+
+In VChart, Series are the core building blocks of visual charts, responsible for mapping data into visual expressions. A series represents a set of related data items that share the same visual representation (such as line, bar, etc.). Series are converters from data to graphics, including data processing, coordinate mapping, visual encoding, and other functions. Each series type corresponds to a specific visual representation form, with unique data structure requirements and visual mapping rules.
+
+### Basic and Coordinate System Classes
+
+* base: Basic implementation of series, providing common functions for all series
+
+* cartesian: Cartesian coordinate system base class, used for X-Y axis series
+
+* polar: Polar coordinate system base class, used for circular and radial series
+
+* geo: Geographic coordinate system base class, used for map-related series
+
+### Cartesian Coordinate System Series
+
+* bar: Bar chart, used for category data comparison
+
+* line: Line chart, showing data trends and changes
+
+* area: Area chart, emphasizing cumulative changes in data volume
+
+* scatter: Scatter plot, showing the distribution of data points
+
+* box-plot: Box plot, displaying data distribution and outliers
+
+* dot: Dot plot, simplified scatter plot
+
+* heatmap: Heatmap, using color intensity to represent value size
+
+* range-area: Range area chart, showing upper and lower boundary areas
+
+* range-column: Range column chart, showing data range
+
+* waterfall: Waterfall chart, showing cumulative effects
+
+### Polar Coordinate System Series
+
+* pie: Pie chart, showing the relationship between part and whole
+
+* rose: Rose chart, circular display of multidimensional data
+
+* radar: Radar chart, radial display of multivariable data
+
+### Hierarchical Series
+
+* treemap: Treemap, nested rectangle display of hierarchical structure
+
+* sunburst: Sunburst chart, circular display of hierarchical data
+
+* circle-packing: Circle packing chart, nested circle display of hierarchical structure
+
+### Relational Series
+
+* sankey: Sankey diagram, showing flow and conversion relationships
+
+* correlation: Correlation chart, showing correlations between different dimensions
+
+* venn: Venn diagram, showing intersection relationships between sets
+
+* link: Link chart, showing connections between entities
+
+### Special Series
+
+* funnel: Funnel chart, showing conversion rates of multi-stage processes
+
+* gauge: Gauge chart, showing the achievement of a single indicator
+
+* liquid: Liquid chart, using liquid fill effect to show progress
+
+* map: Map series, displaying data in geographic space
+
+* mosaic: Mosaic chart, using rectangle area to display multidimensional data relationships
+
+* pictogram: Pictogram chart, using icons to represent data
+
+* progress: Progress bar, linear display of completion
+
+* word-cloud: Word cloud chart, displaying text data based on word frequency
+
+## 3.2.2 Series Data Management
+
+
+
+
+### Initialization Phase
+
+```Typescript
+// packages/vchart/src/series/base/base-series.ts
+ protected initData(): void {
+ const d = this._spec.data ?? this._option.getSeriesData(this._spec.dataId, this._spec.dataIndex);
+ if (d) {
+ this._rawData = dataToDataView(d, this._dataSet, this._option.sourceDataList);
+ }
+ this._rawData?.target?.addListener('change', this.rawDataUpdate.bind(this));
+ this._addDataIndexAndKey();
+ // 初始化viewData
+ if (this._rawData) {
+ if (this.getStack()) {
+ // 初始化viewDataFilter
+ this._viewDataFilter = dataViewFromDataView(this._rawData, this._dataSet, {
+ name: `${this.type}_${this.id}_viewDataFilter`
+ });
+ }
+
+ // 初始化viewData
+ const viewData = dataViewFromDataView(this.getStack() ? this._viewDataFilter : this._rawData, this._dataSet, {
+ name: `${this.type}_${this.id}_viewData`
+ });
+ this._data = new SeriesData(this._option, viewData);
+
+ if (this.getStack()) {
+ this._viewDataFilter.target.removeListener('change', viewData.reRunAllTransform);
+ }
+ }
+
+ this.initInvalidDataTransform();
+ }
+
+```
+1. Extract data from the spec's data or option and convert it into a DataView
+
+1. Then register a Listener, which triggers the rawDataUpdate function when the data changes
+
+1. Add index and key to the Data
+
+1. Then we will generate DataViews of different levels
+
+1. If stacked data is needed, we create an intermediate DataView
+
+1. If stacked data is not needed, directly create viewData, which is used by the chart for statistics and rendering
+
+What is a DataView?
+It is a view encapsulation of a data set, providing a series of operations and capabilities to transform data. You can think of a DataView as an "intelligent data container" that not only stores data but also processes and transforms it in various ways.
+
+```Typescript
+// packages/vchart/src/series/base/base-series.ts
+protected _statisticViewData() {
+ registerDataSetInstanceTransform(this._dataSet, 'dimensionStatistics', dimensionStatistics);
+ const viewDataStatisticsName = `${this.type}_${this.id}_viewDataStatic`;
+ this._viewDataStatistics = new DataView(this._dataSet, { name: viewDataStatisticsName });
+ this._viewDataStatistics.parse([this._data.getDataView()], {
+ type: 'dataview'
+ });
+ this._viewDataStatistics.transform(
+ {
+ type: 'dimensionStatistics',
+ options: {
+ fields: () => {
+ const fields = this.getStatisticFields();
+ if (this._seriesField) {
+ mergeFields(fields, [
+ {
+ key: this._seriesField,
+ operations: ['values']
+ }
+ ]);
+ }
+ return fields;
+ },
+ target: 'latest'
+ }
+ },
+ false
+ );
+ // ...
+}
+
+```
+Create a series of statistics, such as maximum, minimum, etc. The statistics generated by different types of charts may vary. The specific chart's series class will implement this `abstract function getStatisticFields` to control what Statistics are generated.
+
+
+```xml
+ abstract getStatisticFields(): {
+ key: string;
+ operations: StatisticOperations;
+ }[];
+
+```
+### Update Data
+
+#### Data Layer
+
+
+```Typescript
+// 1. 原始数据视图
+protected _rawData!: DataView;
+
+// 2. 原始数据统计视图
+protected _rawDataStatistics?: DataView;
+
+// 3. 原始数据统计缓存
+protected _rawStatisticsCache: Record
+
+Among them:
+
+* All specific Marks inherit from `BaseMark` and bridge with vgrammar through `CompilableMark`
+
+* All Marks implement the `IMarkRaw` interface, and for the style system, the `IVisualSpecStyle` interface needs to be implemented
+
+The inheritance chain where the graphic element is located:
+
+
+
+
+### Creation of Primitives
+
+Below we analyze through code how `renderSync()` parses the configuration `spec` and generates various primitives on the graph. Overall, `renderSync()` includes the following three stages: pre-rendering, rendering, and post-rendering.
+
+```Typescript
+ // packages/vchart/src/core/vchart.ts
+ protected ***_renderSync*** = (option: IVChartRenderOption = {}) => {
+ const self = this as unknown as IVChart;
+ if (!this.***_beforeRender***(option)) {
+ return self;
+ }
+ this._compiler?.***render***(option.morphConfig);
+ this.***_afterRender***();
+ return self;
+ };
+
+```
+The rendering process belongs to the domain of `VGrammar`, and after rendering, the main focus is on updating the animation state. We mainly focus on the **pre-render preparation** related to the graphics, including initializing chart configurations, instantiating charts, and compiling rendering instructions.
+
+##### 1. Initialize Chart Configurations
+
+
+
+```Typescript
+ // packages/vchart/src/core/vchart.ts
+ private ***_initChartSpec***(spec: any, actionSource: VChartRenderActionSource) {
+ // 如果用户注册了函数,在配置中替换相应函数名为函数内容
+ if (VChart.***getFunctionList***() && VChart.***getFunctionList***().length) {
+ spec = ***functionTransform***(spec, VChart);
+ }
+ this._spec = spec;
+ // 创建图表配置转换器,并转换为common chart的配置
+ if (!this._chartSpecTransformer) {
+ this._chartSpecTransformer = Factory.***createChartSpecTransformer***(
+ this._spec.type,
+ this.***_getChartOption***(this._spec.type)
+ );
+ }
+ this._chartSpecTransformer?.***transformSpec***(this._spec);
+ // 转换模型配置
+ this._specInfo = this._chartSpecTransformer?.***transformModelSpec***(this._spec);
+ }
+
+```
+First, replace the function name registered by the user with the corresponding function entity. Then, according to the chart type, create the corresponding chart configuration converter to convert the configuration of this type of chart into the configuration of the `common` type chart. This includes creating a default `series` based on the chart type and completing the user-defined `series` configuration:
+
+
+```xml
+ // packages/vchart/src/chart/cartesian/cartesian-transformer.ts
+ const defaultSeriesSpec = this.***_getDefaultSeriesSpec***(spec);
+ if (!spec.series || spec.series.length === 0) { // 没有用户定义的系列 采用默认
+ spec.series = [defaultSeriesSpec];
+ } else {
+ spec.series.***forEach***((s: ISeriesSpec) => {
+ if (!this.***_isValidSeries***(s.type)) { // 判断用户定义系列是否有效
+ return;
+ }
+ Object.***keys***(defaultSeriesSpec).***forEach***(k => { // 补全配置
+ if (!(k in s)) {
+ s[k] = defaultSeriesSpec[k];
+ }
+ });
+ });
+ }
+
+```
+
+
+##### 2. Instantiate the Chart
+
+
+
+Next, create a chart object of the corresponding type. The chart object here does not refer to the `VChart` object created below. `VChart` encapsulates the chart, serving as the entry point for user operations, responsible for global management and external interfaces of the chart;
+
+```xml
+const vchart = new VChart(spec, { dom: CONTAINER_ID });
+
+```
+The instantiated chart here is responsible for the specific chart construction (such as creating and managing series, components) and internal logic processing (managing data flow, global mapping, graphic element states, etc.).
+
+```Typescript
+ // packages/vchart/src/core/vchart.ts
+ private ***_initChart***(spec: any) {
+ // 创建真正的图表对象
+ const chart = Factory.***createChart***(spec.type, spec, this.***_getChartOption***(spec.type));
+ this._chart = chart;
+ // 进行图表初始化
+ this._chart.***setCanvasRect***(this._currentSize.width, this._currentSize.height);
+ this._chart.***created***();
+ this._chart.***init***();
+ this._event.***emit***(ChartEvent.initialized, {
+ chart,
+ vchart: this
+ });
+ }
+
+```
+The core steps are `created` and `init`, the former creates various elements according to `spec`, such as `region`, `series`, `components`, and the latter initializes each element. We focus on the graphic elements in the creation of `series`.
+
+```xml
+ // packages/vchart/src/series/base/base-series.ts
+ ***created***(): void {
+ ...
+ this.***initMark***();
+ ...
+ }
+
+```
+Since the type of our chart is `line`, there is a default `line` series. We look at the implementation of `initMark` in the `line-series`:
+
+```xml
+ // packages/vchart/src/series/line/line.ts
+ ***initMark***(): void {
+ ...
+ const seriesMark = this._spec.seriesMark ?? *'line'*;
+ this.***initLineMark***(progressive, seriesMark === *'line'*);
+ this.***initSymbolMark***(progressive, seriesMark === *'point'*);
+ }
+
+```
+It was found that indeed the `line` primitives and `symbol` primitives continued to be created:
+
+
+
+
+After a series of function calls (`LineLikeSeriesMixin.initLineMark` -> `BaseSeries._createMark` -> `BaseModel._createMark` -> `Factory.createMark`), it finally reaches the constructor of the corresponding graphic element, which is the "implementation of specific graphic elements" mentioned earlier.
+
+
+
+##### **3. Compile Rendering Instructions**
+
+Compile various `VChart` models (`region`, `series`, `component`) into renderable `VGrammar` syntax elements, involving the content of the `VGrammar` syntax layer, which will not be analyzed in detail.
+
+
+
+### Mapping of Graphic Element Visual Configuration
+
+In the `BaseMark` class, graphic elements achieve the mapping from data to visual channels through a series of methods and logic. This can be roughly divided into two processes: the storage of attributes and the calculation of attribute values. The former simply parses the user-defined `spec` and stores it in the style sheets of various states of the graphic element, during which some simple conversions are made; the latter is where the user of the graphic element truly obtains and calculates specific attribute values when laying out the graphic element.
+
+
+
+
+
+#### Step1 Store Style
+
+##### 1. Initialize Style
+
+Initialize the default style of the graphic element, call the `setStyle` method to set the default value for the `normal` state:
+
+```xml
+private ***_initStyle***(): void {
+ const defaultStyle = this.***_getDefaultStyle***();
+ this.***setStyle***(defaultStyle, *'normal'*, 0);
+}
+
+```
+* Default styles include `visible`: true, `x`: 0, `y`: 0, etc.
+
+* These default values ensure that the elements render correctly even without user-defined styles.
+
+The `initStyleWithSpec` method initializes styles based on the user-provided `spec`:
+
+```Typescript
+initStyleWithSpec(spec: IMarkSpec
+
+
+
+##### Register Event
+
+The entry point for interactive events is the `on` method of the `Event` class,
+
+```xml
+***on*****Bubble** is used to manage the collection of handlers for the same event at different bubbling levels (such as Mark, Model, Chart, VChart). It categorizes and stores event handlers according to the bubbling level and provides methods to add, remove, allow, or prohibit handlers, thereby achieving orderly invocation and management of events at each level.
+
+```Typescript
+export type BubbleNode = {
+ handler: EventHandler
+
+
+
+ # This document was revised and organized by the following person
+ [玄魂](https://github.com/xuanhun)
\ No newline at end of file
diff --git a/docs/assets/contributing/en/sourcecode/6.4-custom-primitives.md b/docs/assets/contributing/en/sourcecode/6.4-custom-primitives.md
new file mode 100644
index 0000000000..ec09e5c01b
--- /dev/null
+++ b/docs/assets/contributing/en/sourcecode/6.4-custom-primitives.md
@@ -0,0 +1,487 @@
+---
+title: 6.4 Custom Marks
+
+key words: VisActor,VChart,VTable,VStrory,VMind,VGrammar,VRender,Visualization,Chart,Data,Table,Graph,Gis,LLM
+---
+# Introduction
+
+When we have a large amount of data to display on a chart, we usually need to define a specific type of series (see section 3.2: `series`) and create marks within the series to represent the data. However, if we only need to display a little extra information, such as an image, a title, or a path, and do not want to create a separate series for it, we can use custom marks (`customMark`). Custom marks allow users to add custom annotations to the chart, such as adding some text, images, line segments, etc.
+
+# Types and Examples
+
+Currently, the supported types of custom marks are as follows:
+
+* `symbol`: Point graphic
+
+* `rule`: Line segment
+
+* `text`: Text
+
+* `rect`: Rectangle
+
+* `path`: Path
+
+* `arc`: Sector
+
+* `polygon`: Polygon
+
+* `group`: Group, which can contain other marks
+
+In the following example, in addition to the two data points in the chart (which can be considered a `scatter series`), three custom marks are added above, namely `text`, `symbol`, and `rule`.
+
+xml
+const spec = {
+ type: 'scatter',
+ xField: 'x',
+ yField: 'y',
+ data: [
+ {
+ name: 'data',
+ values: [{y: 10,x: 'point1'},{y: 31,x: 'point2'}]
+ }
+ ],
+ customMark: [
+ { // Custom text mark
+ type: 'text',
+ style: {
+ fontSize: 20,
+ fontWeight: 600,
+ text: "Not a data point:",
+ x: 300,
+ y: 25,
+ fill: 'grey',
+ }
+ },
+ { // Custom symbol mark
+ type: 'symbol',
+ style:{
+ x: 320,
+ y: 18,
+ fill: 'grey',
+ size: 30
+ }
+ },
+ { // Custom rule mark
+ type: 'rule',
+ style:{
+ x: 120,
+ y: 35,
+ x1: 310,
+ y1:35,
+ stroke:'grey'
+ }
+ }
+ ]
+};
+const vchart = new VChart(spec, { dom: CONTAINER_ID });
+vchart.renderSync();
+
+```EnableMarkType一览:
+`group`, `symbol`, `rule`, `line`, `text`, `rect`, `rect3d`, `image`, `path`, `area`, `arc`, `arc3d`, `polygon`, `pyramid3d`, `boxPlot`, `linkPath`, `ripple`
+
+* `IExtensionMarkSpec`是 `ICustomMarkSpec`的扩展接口,但它限制了图元的类型,排除了 `group` 类型。
+
+```xml
+export interface IExtensionMarkSpec
+
+The chart module participates in the layout by holding a layout element and communicating with the layout element.
+
+## Layout Element Attributes
+
+Layout elements have several important attributes:
+
+* Layout Type: Built-in placeholder layouts provide different layout logic to elements through the layout type.
+
+```Typescript
+
+export type ILayoutType =
+ | 'region-relative' // 轴,datazoom这样需要与region贴合,有布局关联的元素, 独立占位,不重合
+ | 'region-relative-overlap' // 与上面的布局逻辑一致,但是同位置的元素会重叠在一起
+ | 'region' // 一般只给region元素使用
+ | 'normal' // 普通布局元素,比如标题。
+ | 'absolute' // 想要多个元素在同一行布局,比如想并排布局多个图例
+ | 'normal-inline'; // 绝对定位元素,使用空间信息配置,基于画布左上角进行定位布局
+
+```
+* Spatial information: Supports attributes such as `x`, `y`, `lef`, `top`, `right`, `bottom`, `width`, `height`, etc. However, in different layout logics, only some attributes will take effect. For example, in grid layout, the elements within the cell `x`, `y` will not be affected by the configured `x`, `y`.
+
+
+
+# Layout Logic
+
+VChart has two built-in layout logics and supports custom layouts.
+
+## Placeholder Layout
+
+This is the most commonly used layout logic. As shown in the figure below.
+
+
+
+By placing elements into canvas placeholders one by one, a compact layout is eventually formed.
+
+## Grid Layout
+
+Grid layout divides the canvas into a grid of `n rows by m columns` according to row and column information, and then places chart elements into the cells.
+
+For example, the following example on the official website is a grid layout of `2 columns, 4 rows`.
+
+
+
+
+Parameter Definition of Grid Layout
+
+```Typescript
+// 网格布局的类型定义
+export interface IGridLayoutSpec extends ILayoutSpecBase {
+ /**
+ * 设置布局类型为grid布局
+ */
+ type: 'grid';
+ /**
+ * grid布局的总列数
+ */
+ col: number;
+ /**
+ * grid布局的总行数
+ */
+ row: number;
+ /**
+ * 可选配置,指定某几列的宽度
+ */
+ colWidth?: {
+ /**
+ * 指定列数,序号从 0 开始
+ */
+ index: number;
+ /**
+ * 设置指定列的宽度,单位为像素
+ */
+ size: number | ((maxSize: number) => number);
+ }[];
+ /**
+ * 可选配置,指定某几行的高度
+ */
+ rowHeight?: {
+ /**
+ * 指定行数,序号从 0 开始
+ */
+ index: number;
+ /**
+ * 设置指定行的高度,单位为像素
+ */
+ size: number | ((maxSize: number) => number);
+ }[];
+ /**
+ *
+ * 指定所有图表元素所在位置,图表元素的位置起点和占几行几列,可以占多行多列
+ * 图表元素位置允许配置重叠。
+ */
+ elements: ElementSpec[];
+}
+
+网格单元格内模块位置设置
+export type ElementSpec = (
+ | {
+ /**
+ * 组件对应的spec key,如'legends'表示图例
+ */
+ modelKey: string;
+ /**
+ * 组件对应的序号
+ */
+ modelIndex: number;
+ }
+ | {
+ /**
+ * 组件对应的id
+ */
+ modelId: string;
+ }
+) & {
+ /**
+ * 组件在grid布局中所在的列。从左向右,从 0 开始计数
+ */
+ col: number;
+ /**
+ * 组件在grid布局中所在的列跨度,即占了几列,默认值为1
+ */
+ colSpan?: number;
+ /**
+ * 组件在grid布局中所在的行。从上向下,从 0 开始计数。
+ */
+ row: number;
+ /**
+ * 组件在grid布局中所在的行跨度,即占了几行,默认值为1
+ */
+ rowSpan?: number;
+};
+
+```
+## Custom Layout
+
+VChart also provides custom layout capabilities, allowing users to freely set spatial properties for all layout elements.
+
+For example, this [example](https://www.visactor.io/vchart/demo/layout/custom-layout) on the official website.
+
+
+
+
+Draw 12 pies at the twelve positions of the clock. No additional attribute configuration is needed for these pie charts, and the layout logic is only about 10 lines.
+
+```Typescript
+const vchart = new VChart(spec, {
+ dom: CONTAINER_ID,
+ // 通过 option 传入自定义布局
+ layout: (chart, item, chartLayoutRect, chartViewBox) => {
+ /**
+ * chart 是图表对象
+ * item 是参与布局的图表模块
+ * chartLayoutRect 是图表减去padding后的可用布局空间
+ * chartViewBox 是图表在画布中的位置,包含图表的padding。
+ */
+ const radius = Math.min(chartLayoutRect.width / 2, chartLayoutRect.height / 2);
+ const center = { x: chartLayoutRect.width / 2, y: chartLayoutRect.height / 2 };
+ const regionSize = radius * 0.2;
+ const regionPosRadius = radius - regionSize * 0.5 * 1.415;
+ // 使用布局元素的属性和提供的方法完成布局
+ item.forEach((i, index) => {
+ const angle = (index / 12) * Math.PI * 2;
+ // 请在布局完成后务必调用
+ i.setLayoutStartPosition({
+ x: center.x + Math.sin(angle) * regionPosRadius - regionSize * 0.5,
+ y: center.y + Math.cos(angle) * regionPosRadius - regionSize * 0.5
+ });
+ i.setLayoutRect({ width: regionSize, height: regionSize });
+ i.updateLayoutAttribute && i.updateLayoutAttribute();
+ });
+ }
+});
+
+```
+
+
+ # This document was revised and organized by the following person
+ [玄魂](https://github.com/xuanhun)
\ No newline at end of file
diff --git a/docs/assets/contributing/en/sourcecode/9.2-vchart-layout-source-code-analysis.md b/docs/assets/contributing/en/sourcecode/9.2-vchart-layout-source-code-analysis.md
new file mode 100644
index 0000000000..a38f137f89
--- /dev/null
+++ b/docs/assets/contributing/en/sourcecode/9.2-vchart-layout-source-code-analysis.md
@@ -0,0 +1,468 @@
+---
+title: 9.2 VChart Layout Source Code Explanation
+
+key words: VisActor,VChart,VTable,VStrory,VMind,VGrammar,VRender,Visualization,Chart,Data,Table,Graph,Gis,LLM
+---
+# Layout Elements
+
+Layout elements inherit the layout information of the chart module and are responsible for participating in the layout logic. Its implementation is at this repository address
+
+`packages/vchart/src/layout/layout-item.ts`
+
+Below is a detailed explanation of the layout element's code
+
+## Receiving Layout Configuration
+
+In the code, the layout element reads the layout configuration from the spec through the setAttrFromSpec lifecycle, and additionally calculates the pixel values in the layout configuration during onLayoutStart.
+
+
+```Typescript
+ // line: 191
+ setAttrFromSpec(spec: ILayoutItemSpec, chartViewRect: ILayoutRect) {
+ this._spec = spec;
+ this.layoutType = spec.layoutType ?? this.layoutType;
+ this.layoutLevel = spec.layoutLevel ?? this.layoutLevel;
+ this.layoutOrient = spec.orient ?? this.layoutOrient;
+
+ this._setLayoutAttributeFromSpec(spec, chartViewRect);
+
+ this.layoutClip = spec.clip ?? this.layoutClip;
+ }
+
+ onLayoutStart(layoutRect: IRect, viewRect: ILayoutRect, ctx: any) {
+ // 在 layoutStart 时重新计算 spec 中的布局属性值
+ // 确保 resize 后,这些值保持正确的px值。
+ this._setLayoutAttributeFromSpec(this._spec, viewRect);
+ }
+
+```
+The logic for calculating layout pixel values includes percentage strings, function configurations, etc. The unified calculation logic for layout values is here. \r\n\r
+```Typescript
+// packages/vchart/src/util/space.ts
+export function calcLayoutNumber(
+ v: ILayoutNumber | undefined,
+ size: number,
+ callOp?: ILayoutRect, //如果是函数类型的话,函数的参数
+ defaultValue: number = 0
+) {
+ if (isNumber(v)) {
+ return v;
+ }
+ if (isPercent(v)) {
+ return (Number(v.substring(0, v.length - 1)) * size) / 100;
+ }
+ if (isFunction(v)) {
+ return v(callOp);
+ }
+ if (isObject(v)) {
+ return size * (v.percent ?? 0) + (v.offset ?? 0);
+ }
+ return defaultValue;
+}
+
+```
+
+
+## Communicating with the Chart Module
+
+The layout logic will obtain the actual drawing size of the chart module in a given space by calling the computeBoundsInRect method of `LayoutItem`.
+
+### **LayoutItem Obtaining Drawing Size**
+
+```Typescript
+// line: 365
+computeBoundsInRect(rect: ILayoutRect): ILayoutRect {
+ // 保留布局使用的rect
+ this._lastComputeRect = rect;
+ // 一些情况下不需要计算
+ if (
+ (this.layoutType === 'region-relative' || this.layoutType === 'region-relative-overlap') &&
+ ((this._layoutRectLevelMap.width === USER_LAYOUT_RECT_LEVEL &&
+ (this.layoutOrient === 'left' || this.layoutOrient === 'right')) ||
+ (this._layoutRectLevelMap.height === USER_LAYOUT_RECT_LEVEL &&
+ (this.layoutOrient === 'bottom' || this.layoutOrient === 'top')))
+ ) {
+ return this._layoutRect;
+ }
+ // 将布局空间限制到 spec 设置内
+ // 避免操作到元素本身的 aabbbounds
+ const bounds = { ...this._model.getBoundsInRect(this.setRectInSpec(rect), rect) };
+ // 用户设置了布局元素宽高的场景下,内部布局结果的 bounds 不能直接作为图表布局bounds
+ this.changeBoundsBySetting(bounds);
+ // 保留当前模块的布局超出内容,用来处理自动缩进
+ // 当前 bounds 需要有实际宽高
+ if (this.autoIndent && bounds.x2 - bounds.x1 > 0 && bounds.y2 - bounds.y1 > 0) {
+ this._lastComputeOutBounds.x1 = Math.ceil(-bounds.x1);
+ this._lastComputeOutBounds.x2 = Math.ceil(bounds.x2 - rect.width);
+ this._lastComputeOutBounds.y1 = Math.ceil(-bounds.y1);
+ this._lastComputeOutBounds.y2 = Math.ceil(bounds.y2 - rect.height);
+ }
+ // 返回的布局大小也要限制到 spec 设置内
+ let result = this.setRectInSpec(boundsInRect(bounds, rect));
+ if (this._option.transformLayoutRect) {
+ result = this._option.transformLayoutRect(result);
+ }
+
+ return result;
+ }
+
+```
+The chart module here needs to implement the interface to get bounds
+
+```Typescript
+export interface ILayoutModel extends IModel {
+ getBoundsInRect: (rect: ILayoutRect, fullRect: ILayoutRect) => IBoundsLike;
+}
+
+```
+### Chart Module Obtaining Layout Information
+
+The chart module obtains the layout space information by holding `layoutItem`
+
+
+```xml
+// 下面是部分类型定义
+export interface ILayoutItem {
+ readonly type: string;
+ /**
+ * 标记这个布局Item的方向(left->right, right->left, top->bottom, bottom->top)
+ */
+ directionStr?: 'l2r' | 'r2l' | 't2b' | 'b2t';
+ layoutClip: boolean;
+ layoutType: ILayoutType;
+ layoutBindRegionID: number | number[];
+ layoutOrient: IOrientType;
+ /** 是否自动缩进 */
+ autoIndent: boolean;
+ alignSelf?: 'start' | 'end' | 'middle';
+ /** paddding */
+ layoutPaddingLeft: number;
+ layoutPaddingTop: number;
+ layoutPaddingRight: number;
+ layoutPaddingBottom: number;
+ /** offset */
+ layoutOffsetX: number;
+ layoutOffsetY: number;
+
+ /** 布局优先级,越大越先处理 */
+ layoutLevel: number;
+
+ getLayoutStartPoint: () => ILayoutPoint;
+ getLayoutRect: () => ILayoutRect;
+ }
+
+
+```
+# Chart Module
+
+The chart module will obtain layout information and update its own graphic position during the `onLayoutEnd` lifecycle.
+
+
+```Typescript
+// packages/vchart/src/model/layout-model.ts
+// line: 56
+onLayoutEnd(ctx: any): void {
+ super.onLayoutEnd(ctx);
+ // diff layoutRect
+ this.updateLayoutAttribute();
+ // ... other code
+ }
+
+```
+
+
+# Layout Logic
+
+In VChart, the definition of layout logic is actually just a function that receives layout elements and updates their layout properties.
+
+
+```xml
+// 类型定义
+export type LayoutCallBack = (
+ chart: any,
+ item: ILayoutItem[],
+ chartLayoutRect: IRect,
+ chartViewBox: IBoundsLike
+) => void;
+
+// VChart 通过接口 setLayout 设置自定义布局
+export interface IVChart {
+ /**
+ * 设置自定义布局
+ */
+ setLayout: (layout: LayoutCallBack) => void;
+ // other
+}
+
+```
+## Placeholder Layout
+
+The most commonly used layout logic is the method of placing layout elements on the canvas one by one according to type and priority.
+
+The calculation of placeholders is done by initializing the top, bottom, left, and right boundaries at the start of the layout, and then reducing the boundaries after each item is laid out, gradually narrowing the layoutable area.
+
+### **Initialization**
+
+
+```Typescript
+protected _layoutInit(_chart: IChart, items: ILayoutItem[], chartLayoutRect: IRect, chartViewBox: IBoundsLike) {
+ this._chartLayoutRect = chartLayoutRect;
+ this._chartViewBox = chartViewBox;
+ this.leftCurrent = chartLayoutRect.x;
+ this.topCurrent = chartLayoutRect.y;
+ this.rightCurrent = chartLayoutRect.x + chartLayoutRect.width;
+ this.bottomCurrent = chartLayoutRect.height + chartLayoutRect.y;
+
+ // 越大越先处理,进行排序调整,利用原地排序特性,排序会受 level 和传进来的数组顺序共同影响
+ items.sort((a, b) => b.layoutLevel - a.layoutLevel);
+}
+
+```
+### Layout Execution
+
+
+```xml
+// packages/vchart/src/layout/base-layout.ts
+
+// line: 91
+layoutItems(_chart: IChart, items: ILayoutItem[], chartLayoutRect: IRect, chartViewBox: IBoundsLike): void {
+ // 布局初始化
+ this._layoutInit(_chart, items, chartLayoutRect, chartViewBox);
+ // 先布局 normal 类型的元素
+ this._layoutNormalItems(items);
+ // 开始布局 region 相关元素
+ // 为了自动缩进能力先保存一下当前的布局空间
+ const layoutTemp: LayoutSideType = {
+ left: this.leftCurrent,
+ top: this.topCurrent,
+ right: this.rightCurrent,
+ bottom: this.bottomCurrent
+ };
+ // 将 reion 相关元素分组
+ const { regionItems, relativeItems, relativeOverlapItems, allRelatives,overlapItems } = this._groupItems(items);
+ // 有元素开启了自动缩进
+ // TODO:目前只有普通占位布局下的 region-relative 元素支持
+ // 主要考虑常规元素超出画布一般为用户个性设置,而且可以设置padding规避裁剪,不需要使用自动缩进
+ this.layoutRegionItems(regionItems, relativeItems, relativeOverlapItems, overlapItems);
+ // 缩进计算
+ this._processAutoIndent(regionItems, relativeItems, relativeOverlapItems, overlapItems, allRelatives, layoutTemp);
+ // 最后布局绝对定位元素
+ this.layoutAbsoluteItems(items.filter(x => x.layoutType === 'absolute'));
+ }
+
+```
+`item` placeholder: Below is the logic for a regular element placeholder. First, pass the current layout range to `item`. After `item` completes the layout, reduce the space in the corresponding direction.
+
+```Typescript
+protected layoutNormalItems(normalItems: ILayoutItem[]): void {
+ normalItems.forEach(item => {
+ const layoutRect = this.getItemComputeLayoutRect(item);
+ const rect = item.computeBoundsInRect(layoutRect);
+ item.setLayoutRect(rect);
+
+ if (item.layoutOrient === 'left') {
+ item.setLayoutStartPosition({
+ x: this.leftCurrent + item.layoutOffsetX + item.layoutPaddingLeft,
+ y: this.topCurrent + item.layoutOffsetY + item.layoutPaddingTop
+ });
+ this.leftCurrent += rect.width + item.layoutPaddingLeft + item.layoutPaddingRight;
+ } else if (item.layoutOrient === 'top') {
+ item.setLayoutStartPosition({
+ x: this.leftCurrent + item.layoutOffsetX + item.layoutPaddingLeft,
+ y: this.topCurrent + item.layoutOffsetY + item.layoutPaddingTop
+ });
+ this.topCurrent += rect.height + item.layoutPaddingTop + item.layoutPaddingBottom;
+ } else if (item.layoutOrient === 'right') {
+ item.setLayoutStartPosition({
+ x: this.rightCurrent + item.layoutOffsetX - rect.width - item.layoutPaddingRight,
+ y: this.topCurrent + item.layoutOffsetY + item.layoutPaddingTop
+ });
+ this.rightCurrent -= rect.width + item.layoutPaddingLeft + item.layoutPaddingRight;
+ } else if (item.layoutOrient === 'bottom') {
+ item.setLayoutStartPosition({
+ x: this.leftCurrent + item.layoutOffsetX + item.layoutPaddingRight,
+ y: this.bottomCurrent + item.layoutOffsetY - rect.height - item.layoutPaddingBottom
+ });
+ this.bottomCurrent -= rect.height + item.layoutPaddingTop + item.layoutPaddingBottom;
+ }
+ });
+ }
+
+```
+
+
+## Grid Layout
+
+The grid layout method is to first establish row and column layout information arrays according to the layout configuration and configuration items.
+
+### Initialization
+
+
+```Typescript
+// packages/vchart/src/layout/grid-layout/grid-layout.ts
+type GridSize = {
+ value: number;
+ isUserSetting: boolean;
+ isLayoutSetting: boolean;
+};
+
+export class GridLayout implements IBaseLayout {
+ // 行列信息
+ protected _col: number = 1;
+ protected _row: number = 1;
+ // 存储行列的大小和配置信息
+ protected _colSize: GridSize[];
+ protected _rowSize: GridSize[];
+
+ // 每一行,每一列都有一个数组存储它对应的布局 item
+ protected _colElements: ILayoutItem[][];
+ protected _rowElements: ILayoutItem[][];
+
+ constructor(gridInfo: IGridLayoutSpec, ctx: utilFunctionCtx) {
+ this.standardizationSpec(gridInfo);
+ this._gridInfo = gridInfo;
+ this._col = gridInfo.col;
+ this._row = gridInfo.row;
+ this._colSize = new Array(this._col).fill(null);
+ this._rowSize = new Array(this._row).fill(null);
+ this._colElements = new Array(this._col).fill([]);
+ this._rowElements = new Array(this._row).fill([]);
+ this._onError = ctx?.onError;
+
+ this.initUserSetting();
+ }
+
+ protected initUserSetting() {
+ // 先对用户设置的宽高进行设置
+ this._gridInfo.colWidth &&
+ this.setSizeFromUserSetting(this._gridInfo.colWidth, this._colSize, this._col, this._chartLayoutRect.width);
+
+ this._gridInfo.rowHeight &&
+ this.setSizeFromUserSetting(this._gridInfo.rowHeight, this._rowSize, this._row, this._chartLayoutRect.height);
+ // 其余位置默认填充0
+ this._colSize.forEach((c, i) => {
+ if (!c) {
+ this._colSize[i] = {
+ value: 0,
+ isUserSetting: false,
+ isLayoutSetting: false
+ };
+ }
+ });
+ this._rowSize.forEach((r, i) => {
+ if (!r) {
+ this._rowSize[i] = {
+ value: 0,
+ isUserSetting: false,
+ isLayoutSetting: false
+ };
+ }
+ });
+ }
+ // other
+}
+
+```
+### Layout Execution
+
+In grid layout, elements are placed into the layout information according to certain attributes, configured to their designated row and column positions. Then, in the order of columns first and rows second, each element undergoes layout calculation and is placed into the prepared row and column layout information.
+
+After the first column layout is completed, only the column width is determined, and then the row layout is performed. After the first round of layout is completed, the column elements undergo a second layout, allowing them to readjust their layout attributes based on the width. Only after this are all layout information finalized, and at this point, all elements are positioned once.
+
+```Typescript
+layoutItems(_chart: IChart, items: ILayoutItem[], chartLayoutRect: IRect, chartViewBox: IBoundsLike): void {
+ this._chartLayoutRect = chartLayoutRect;
+ this._chartViewBox = chartViewBox;
+ // 先清空旧布局信息
+ this.clearLayoutSize();
+ // 越大越先处理,进行排序调整,利用原地排序特性,排序会受 level 和传进来的数组顺序共同影响
+ items.sort((a, b) => b.layoutLevel - a.layoutLevel);
+
+ // 剔除 region 后,其余元素先布局运算
+ const normalItems = items.filter(item => item.layoutType === 'normal' && item.getModelVisible() !== false);
+ const normalItemsCol = normalItems.filter(item => isColItem(item));
+ const normalItemsRow = normalItems.filter(item => !isColItem(item));
+ normalItems.forEach(item => {
+ this.layoutOneItem(item, 'user', false);
+ });
+
+ // region 和 region 关联元素
+ const regionsRelative = items.filter(x => x.layoutType === 'region-relative');
+ const regionsRelativeCol = regionsRelative.filter(item => isColItem(item));
+ const regionsRelativeRow = regionsRelative.filter(item => !isColItem(item));
+ // 先进行 col 方向布局
+ regionsRelativeCol.forEach(item => this.layoutOneItem(item, 'user', false));
+ // 然后得到最终 col 信息 此时已经是最终 col 信息
+ this.layoutGrid('col');
+ // 再使用宽度信息辅助row方向排序
+ // 此时普通占位元素,会因为布局宽度影响最终布局高度
+ normalItemsRow.forEach(item => this.layoutOneItem(item, 'colGrid', false));
+ regionsRelativeRow.forEach(item => {
+ this.layoutOneItem(item, 'colGrid', false);
+ });
+ // 然后得到最终 row 信息
+ this.layoutGrid('row');
+ // 统一水平方向元素高度
+ regionsRelativeRow.forEach(item => {
+ this.layoutOneItem(item, 'grid', false);
+ });
+ // 再使用宽度信息,第二次次对 col 方向布局
+ normalItemsCol.forEach(item => this.layoutOneItem(item, 'grid', false));
+ regionsRelativeCol.forEach(item => {
+ // 此时从布局逻辑可知,item的layoutRect会发生,将item的layoutTag设置为true
+ this.layoutOneItem(item, 'grid', true);
+ });
+ this.layoutGrid('col');
+
+ // region
+ items.filter(x => x.layoutType === 'region').forEach(item => this.layoutOneItem(item, 'grid', false));
+
+ // 再找出 absolute 元素,无需排序,在 compiler 层需要排序放置
+ this.layoutAbsoluteItems(items.filter(x => x.layoutType === 'absolute'));
+
+ // 最后基于grid 设置位置
+ items
+ .filter(x => x.layoutType !== 'absolute')
+ .forEach(item => {
+ item.setLayoutStartPosition(this.getItemPosition(item));
+ });
+ }
+
+```
+The layout logic of a single element remains consistent, using the same method \r\n\r
+```Typescript
+protected layoutOneItem(item: ILayoutItem, sizeType: 'user' | 'grid' | 'colGrid' | 'rowGrid', ignoreTag: boolean) {
+ const sizeCallRow =
+ sizeType === 'rowGrid' || sizeType === 'grid' ? this.getSizeFromGrid.bind(this) : this.getSizeFromUser.bind(this);
+ const sizeCallCol =
+ sizeType === 'colGrid' || sizeType === 'grid' ? this.getSizeFromGrid.bind(this) : this.getSizeFromUser.bind(this);
+ // 先获取 item 的 grid 信息
+ const gridSpec = this.getItemGridInfo(item);
+ // 设置空间
+ const computeRect = {
+ width:
+ (sizeCallCol(gridSpec, 'col') ?? this._chartLayoutRect.width) -
+ item.layoutPaddingLeft -
+ item.layoutPaddingRight,
+ height:
+ (sizeCallRow(gridSpec, 'row') ?? this._chartLayoutRect.height) -
+ item.layoutPaddingTop -
+ item.layoutPaddingBottom
+ };
+ // 计算尺寸
+ const rect = item.computeBoundsInRect(computeRect);
+ if (!isValidNumber(rect.width)) {
+ rect.width = computeRect.width;
+ }
+ if (!isValidNumber(rect.height)) {
+ rect.height = computeRect.height;
+ }
+ // 更新最终尺寸
+ item.setLayoutRect(sizeType !== 'grid' ? rect : computeRect);
+ // 设置大小到grid
+ this.setItemLayoutSizeToGrid(item, gridSpec);
+ }
+}
+
+```
+# This document was revised and organized by the following person \r\n [玄魂](https://github.com/xuanhun)
\ No newline at end of file
diff --git a/docs/assets/contributing/menu.json b/docs/assets/contributing/menu.json
index 6229069988..1f02e3f180 100644
--- a/docs/assets/contributing/menu.json
+++ b/docs/assets/contributing/menu.json
@@ -42,6 +42,267 @@
"zh": "6.如何上传图片",
"en": "6-How to upload images"
}
+ },
+ {
+ "path": "sourcecode",
+ "title": {
+ "zh": "源代码分析",
+ "en": "Source Code Analysis"
+ },
+ "children": [
+ {
+ "path": "0-vchart-engineering",
+ "title": {
+ "zh": "VChart 工程化",
+ "en": "VChart Engineering"
+ }
+ },
+ {
+ "path": "1-vchart-basic-principles",
+ "title": {
+ "zh": "VChart 基本原理",
+ "en": "VChart Basic Principles"
+ }
+ },
+ {
+ "path": "3-how-to-assemble-a-vchart",
+ "title": {
+ "zh": "如何组装一个 VChart",
+ "en": "How to Assemble a VChart"
+ }
+ },
+ {
+ "path": "6.1-primitive-basic-concepts",
+ "title": {
+ "zh": "图元基础概念",
+ "en": "Primitive Basic Concepts"
+ }
+ },
+ {
+ "path": "6.2-visual-channel-mapping",
+ "title": {
+ "zh": "视觉通道映射",
+ "en": "Visual Channel Mapping"
+ }
+ },
+ {
+ "path": "6.3-primitive-interaction-and-state-handling",
+ "title": {
+ "zh": "图元交互与状态处理",
+ "en": "Primitive Interaction and State Handling"
+ }
+ },
+ {
+ "path": "6.4-custom-primitives",
+ "title": {
+ "zh": "自定义图元",
+ "en": "Custom Primitives"
+ }
+ },
+ {
+ "path": "9.1-vchart-layout-basic-concepts",
+ "title": {
+ "zh": "VChart 布局基础概念",
+ "en": "VChart Layout Basic Concepts"
+ }
+ },
+ {
+ "path": "9.2-vchart-layout-source-code-analysis",
+ "title": {
+ "zh": "VChart 布局源码分析",
+ "en": "VChart Layout Source Code Analysis"
+ }
+ },
+ {
+ "path": "10.1-animation-concepts-and-types",
+ "title": {
+ "zh": "动画概念与类型",
+ "en": "Animation Concepts and Types"
+ }
+ },
+ {
+ "path": "10.2-global-morphing-animation",
+ "title": {
+ "zh": "全局变形动画",
+ "en": "Global Morphing Animation"
+ }
+ },
+ {
+ "path": "10.3-state-change-animation",
+ "title": {
+ "zh": "状态变更动画",
+ "en": "State Change Animation"
+ }
+ },
+ {
+ "path": "10.4-data-update-animation",
+ "title": {
+ "zh": "数据更新动画",
+ "en": "Data Update Animation"
+ }
+ },
+ {
+ "path": "10.5-animation-orchestration",
+ "title": {
+ "zh": "动画编排",
+ "en": "Animation Orchestration"
+ }
+ },
+ {
+ "path": "11.1-theme-configuration-parsing-logic",
+ "title": {
+ "zh": "主题配置解析逻辑",
+ "en": "Theme Configuration Parsing Logic"
+ }
+ },
+ {
+ "path": "11.2-theme-update-source-code-analysis",
+ "title": {
+ "zh": "主题更新源码分析",
+ "en": "Theme Update Source Code Analysis"
+ }
+ },
+ {
+ "path": "12.1-vchart-plugin-mechanism",
+ "title": {
+ "zh": "VChart 插件机制",
+ "en": "VChart Plugin Mechanism"
+ }
+ },
+ {
+ "path": "12.2-vchart-plugin-feature-source-code-analysis",
+ "title": {
+ "zh": "VChart 插件功能源码分析",
+ "en": "VChart Plugin Feature Source Code Analysis"
+ }
+ },
+ {
+ "path": "13.1-vchart-on-demand-loading-mechanism",
+ "title": {
+ "zh": "VChart 按需加载机制",
+ "en": "VChart On-demand Loading Mechanism"
+ }
+ },
+ {
+ "path": "13.2-vchart-on-demand-loading-source-code-analysis",
+ "title": {
+ "zh": "VChart 按需加载源码分析",
+ "en": "VChart On-demand Loading Source Code Analysis"
+ }
+ },
+ {
+ "path": "14.1.1-react-vchart-introduction",
+ "title": {
+ "zh": "React VChart 介绍",
+ "en": "React VChart Introduction"
+ }
+ },
+ {
+ "path": "14.1.2-react-vchart-source-code-analysis",
+ "title": {
+ "zh": "React VChart 源码分析",
+ "en": "React VChart Source Code Analysis"
+ }
+ },
+ {
+ "path": "14.2.1-taro-vchart-introduction",
+ "title": {
+ "zh": "Taro VChart 介绍",
+ "en": "Taro VChart Introduction"
+ }
+ },
+ {
+ "path": "14.2.2-taro-vchart-source-code-analysis",
+ "title": {
+ "zh": "Taro VChart 源码分析",
+ "en": "Taro VChart Source Code Analysis"
+ }
+ },
+ {
+ "path": "14.3.1-lark-vchart-introduction",
+ "title": {
+ "zh": "Lark VChart 介绍",
+ "en": "Lark VChart Introduction"
+ }
+ },
+ {
+ "path": "14.3.2-lark-vchart-source-code-analysis",
+ "title": {
+ "zh": "Lark VChart 源码分析",
+ "en": "Lark VChart Source Code Analysis"
+ }
+ },
+ {
+ "path": "14.4.1-tt-vchart-introduction",
+ "title": {
+ "zh": "TT VChart 介绍",
+ "en": "TT VChart Introduction"
+ }
+ },
+ {
+ "path": "14.4.2-tt-vchart-source-code-analysis",
+ "title": {
+ "zh": "TT VChart 源码分析",
+ "en": "TT VChart Source Code Analysis"
+ }
+ },
+ {
+ "path": "14.5.1-wx-vchart-introduction",
+ "title": {
+ "zh": "WX VChart 介绍",
+ "en": "WX VChart Introduction"
+ }
+ },
+ {
+ "path": "14.5.2-wx-vchart-source-code-analysis",
+ "title": {
+ "zh": "WX VChart 源码分析",
+ "en": "WX VChart Source Code Analysis"
+ }
+ },
+ {
+ "path": "14.6.1-openinula-vchart-introduction",
+ "title": {
+ "zh": "OpenInula VChart 介绍",
+ "en": "OpenInula VChart Introduction"
+ }
+ },
+ {
+ "path": "14.6.2-openinula-vchart-source-code-analysis",
+ "title": {
+ "zh": "OpenInula VChart 源码分析",
+ "en": "OpenInula VChart Source Code Analysis"
+ }
+ },
+ {
+ "path": "14.7.1-harmony-vchart-introduction",
+ "title": {
+ "zh": "Harmony VChart 介绍",
+ "en": "Harmony VChart Introduction"
+ }
+ },
+ {
+ "path": "14.7.2-harmony-vchart-source-code-analysis",
+ "title": {
+ "zh": "Harmony VChart 源码分析",
+ "en": "Harmony VChart Source Code Analysis"
+ }
+ },
+ {
+ "path": "14.8.1-vchart-svg-plugin-introduction",
+ "title": {
+ "zh": "VChart SVG 插件介绍",
+ "en": "VChart SVG Plugin Introduction"
+ }
+ },
+ {
+ "path": "14.8.2-vchart-svg-plugin-source-code-analysis",
+ "title": {
+ "zh": "VChart SVG 插件源码分析",
+ "en": "VChart SVG Plugin Source Code Analysis"
+ }
+ }
+ ]
}
]
}
\ No newline at end of file
diff --git a/docs/assets/contributing/zh/sourcesode/0-vchart-engineering.md b/docs/assets/contributing/zh/sourcesode/0-vchart-engineering.md
new file mode 100644
index 0000000000..f6fdfc378b
--- /dev/null
+++ b/docs/assets/contributing/zh/sourcesode/0-vchart-engineering.md
@@ -0,0 +1,193 @@
+---
+title: 0 VChart 工程化
+
+key words: VisActor,VChart,VTable,VStrory,VMind,VGrammar,VRender,Visualization,Chart,Data,Table,Graph,Gis,LLM
+---
+# 0.1 启动 demo
+
+## 0.1.1 Fork 项目
+
+在 Github 上,你需要 Fork VChart 项目。
+
+
+
+## 0.1.2 克隆项目
+
+在你 fork 的仓库中,点击 `Code` 按钮,复制项目地址。然后使用 git clone 命令克隆项目到本地。例如:
+
+```bash
+git clone https://github.com/your-username/VChart.git
+
+```
+克隆完毕后需要添加 VChart 的远程地址。
+
+```bash
+git remote add upstream https://github.com/VisActor/VChart.git
+
+```
+这样以后你就可以从 VChart 的远程地址获取最新的源码。
+
+```bash
+git pull upstream develop
+
+```
+## 0.1.3 启动 demo
+
+我们是用 [@microsoft/rush](https://rushjs.io/) 来管理 monorepo。所以先安装 rush。
+
+```bash
+npm install -g @microsoft/rush
+
+```
+接下来执行命令启动 demo。
+
+```typescript
+*安装依赖*
+$ rush update
+*启动 vchart 的demo页*
+$ rush start
+*启动 react-vchart 的demo页*
+$ rush react
+*启动本地文档站点*
+$ rush docs
+
+```
+## 0.1.4 启动 demo 的时候发生了什么?
+
+当你运行 `rush start` 的时候,会启动 vchart 的 demo 页。可是具体发生了什么呢?
+
+首先我们在 `command-line.json` 中配置了 `start` 命令:
+
+```json
+{"commandKind": "global","name": "start","summary": "Start the development server","description": "Run this command to start vchart development server","shellCommand": "rush run -p @visactor/vchart -s start"},
+
+```
+所以我们得知 start 命令会执行 `rush run -p @visactor/vchart -s start` 命令。
+
+让我详细解释 `rush run -p @visactor/vchart -s start` 这个命令:
+
+这是一个 Rush 工具的命令,可以拆解为以下几个部分:
+
+1. `rush run`:Rush 的子命令,用于在 monorepo 中运行特定项目的 npm 脚本
+
+1. `-p @visactor/vchart`:`-p` 或 `--project` 参数,指定要运行脚本的项目名称,这里指定的是 @visactor/vchart 项目
+
+1. `-s start`:`-s` 或 `--script` 参数,指定要运行的 npm 脚本名称,这里要运行的是 start 脚本
+
+根据代码库,我们可以看到这个命令最终会执行 @visactor/vchart 包中 package.json 定义的 start 脚本:
+
+```bash
+ts-node __tests__/runtime/browser/scripts/initVite.ts && vite serve __tests__/runtime/browser
+
+```
+这个命令前半部分是运行初始化脚本 `initVite.ts`,它的主要作用是生成 local 版本的 `vite.config.local.ts` 和 `index.page.local.ts` 文件,这两个文件是被 git 忽略的,用于本地开发的配置,后面会详细讲到。
+
+后半部分的脚本 `vite serve __tests__/runtime/browser`是启动 demo 网页。
+
+## 0.1.5 如何使用 `index.page.local.ts`
+
+该文件的默认内容为
+
+```xml
+import './test-page/area';
+
+```
+笼统的来说,它可以用来指定启动不同的 chart 页面。实际上它就是会运行不同文件的 VChart 表格生成代码,来达到网页启动不同的 chart 页面的效果。所以你只要 import 不同的文件,就可以启动不同的 chart 页面。
+
+## 0.1.6 如何使用 `vite.config.local.ts`
+
+这个文件主要用来配置端口和本地包。比如下面的配置:
+
+```xml
+export default {
+ *// 启动端口*port: 4000,
+ resolve: {
+ alias: {
+ '@visactor/vgrammar-core': '/path/to/visactor/VGrammar/packages/vgrammar-core/src/index.ts',
+ '@visactor/vgrammar-util': '/path/to/visactor/VGrammar/packages/vgrammar-util/src/index.ts',
+ '@visactor/vgrammar-wordcloud': '/path/to/visactor/VGrammar/packages/vgrammar-wordcloud/src/index.ts',
+ '@visactor/vgrammar-wordcloud-shape': '/path/to/visactor/VGrammar/packages/vgrammar-wordcloud-shape/src/index.ts',
+ '@visactor/vgrammar-sankey': '/path/to/visactor/VGrammar/packages/vgrammar-sankey/src/index.ts',
+ '@visactor/vgrammar-hierarchy': '/path/to/visactor/VGrammar/packages/vgrammar-hierarchy/src/index.ts',
+ '@visactor/vgrammar-projection': '/path/to/visactor/VGrammar/packages/vgrammar-projection/src/index.ts',
+ '@visactor/vgrammar-coordinate': '/path/to/visactor/VGrammar/packages/vgrammar-coordinate/src/index.ts',
+ '@visactor/vgrammar-venn': '/path/to/visactor/VGrammar/packages/vgrammar-venn/src/index.ts',
+ '@visactor/vscale': '/path/to/visactor/VUtil/packages/vscale/src/index.ts',
+ '@visactor/vdataset': '/path/to/visactor/VUtil/packages/vdataset/src/index.ts',
+ '@visactor/vutils': '/path/to/visactor/VUtil/packages/vutils/src/index.ts',
+ '@visactor/vrender-core': '/path/to/visactor/VRender/packages/vrender-core/src/index.ts',
+ '@visactor/vrender-kits': '/path/to/visactor/VRender/packages/vrender-kits/src/index.ts',
+ '@visactor/vrender-components': '/path/to/visactor/VRender/packages/vrender-components/src/index.ts'
+ }
+ }
+};
+
+```
+它把启动端口配置为 4000,并且配置了一系列的本地包,这样你的 VChart 在调试时会依赖这些本地包,你对上游本地包的改动会实时生效,方便调试一些和上游有关的 bug,如果你不需要这个功能,去掉这些配置即可。
+
+# 0.2 VChart 工程化详解
+
+## 0.2.1 项目结构
+
+VChart 是一个使用 Rush 管理的 monorepo 项目,主要包含以下几个部分:
+
+核心包:
+
+1. @visactor/vchart - 核心图表库
+
+1. @visactor/react-vchart - React 封装
+
+1. @visactor/openinula-vchart - OpenInula 封装
+
+1. @visactor/taro-vchart - Taro 封装
+
+1. @visactor/lark-vchart - 飞书封装
+
+1. @visactor/wx-vchart - 微信小程序封装
+
+1. @visactor/vchart-schema - 图表配置 Schema
+
+1. @visactor/vchart-types - TypeScript 类型定义
+
+1. @visactor/vutils-extension - 工具函数扩展
+
+1. @visactor/tt-vchart - 字节小程序封装
+
+工具包:
+
+1. @internal/bundler - 打包工具
+
+1. @internal/typescript-json-schema - TypeScript 类型定义生成工具
+
+1. @internal/story-player - 故事播放器
+
+1. @internal/bugserver-trigger - Bug 服务触发器
+
+## 0.2.2 文档系统
+
+文档的内容都存储在 `docs/assets` 文件夹下,比如包含:
+
+* API 文档
+
+* 示例代码
+
+* 教程文档
+
+* 配置项文档
+
+* 主题文档
+
+## 0.2.3 开发命令
+
+* rush update - 安装依赖
+
+* rush start - 启动 vchart 开发服务
+
+* rush react - 启动 react-vchart 开发服务
+
+* rush docs - 启动文档开发服务
+
+
+
+ # 本文档由以下人员修正整理
+ [玄魂](https://github.com/xuanhun)
\ No newline at end of file
diff --git a/docs/assets/contributing/zh/sourcesode/1-vchart-basic-principles.md b/docs/assets/contributing/zh/sourcesode/1-vchart-basic-principles.md
new file mode 100644
index 0000000000..3bc83ef03b
--- /dev/null
+++ b/docs/assets/contributing/zh/sourcesode/1-vchart-basic-principles.md
@@ -0,0 +1,437 @@
+---
+title: 1 VChart 基本原理
+
+key words: VisActor,VChart,VTable,VStrory,VMind,VGrammar,VRender,Visualization,Chart,Data,Table,Graph,Gis,LLM
+---
+# 1.1 图表组成
+
+## 术语
+
+1. Mark:基本图形元素(基本图元),如线、点、矩形等
+
+1. Series:负责特定类型数据的可视化表达,包含一组图元及其对应的图表逻辑,比如折线图中的一系列线
+
+1. Region:定义图表的空间区域,关联一组或多组 series,处理交互和动画,提供坐标系统
+
+1. Component:组件,帮助图表阅读和交互的元素,如图例、坐标轴、提示等
+
+1. Layout:管理图表的布局,包括 region 和 component 的位置和大小
+
+1. Chart:整个图表的抽象概念,包含视图上的元素比如 layout,component 和 region,也包含数据等所有构成一个表格需要的元素
+
+## 结构关系
+
+
+
+## 简单图表例子
+
+
+
+## 组合图表例子
+
+### 同一个 Region
+
+
+
+上图是一个组合图,简单来说就是有多组 series,上面是 bar 和 line 这两组 series。
+
+1. 如果我们没有特别配置,所有 series 都会关联在一个 region,所以他们会重叠在一起,并且共享某些坐标
+
+1. 每个系列可以有自己的数据源,也可以直接将数据源配置在 chart 上,series 中通过 `fromDataId` 或者 `fromDataIndex` 来关联,当前的例子我们选择配置在 chart 上
+
+### 不同 Region
+
+
+
+在这个例子中,也是一个组合图,但是他的两组 series 出现在了不同的 region。如上文所说,我们用 layout 管理 region 的布局,在这个例子中,我们使用了如下代码:
+
+```Typescript
+ layout: {
+ type: 'grid',
+ col: 4,
+ row: 3,
+ elements: [
+ {
+ modelId: 'legend',
+ col: 0,
+ colSpan: 4,
+ row: 0
+ },
+ {
+ modelId: 'pie-region',
+ col: 0,
+ colSpan: 2,
+ row: 1
+ },
+ {
+ modelId: 'axis-left',
+ col: 2,
+ row: 1
+ },
+ {
+ modelId: 'bar-region',
+ col: 3,
+ row: 1
+ },
+ {
+ modelId: 'axis-bottom',
+ col: 3,
+ row: 2
+ }
+ ]
+ },
+
+```
+上面通过了类似于 grid 的方式来管理 region 和 component 的布局。我们使用这些 `modelId` 来关联对应 region 和 component 的配置:
+
+```Typescript
+ region: [
+ {
+ id: 'pie-region'
+ },
+ {
+ id: 'bar-region'
+ }
+ ],
+ axes: [
+ {
+ id: 'axis-left',
+ regionId: 'bar-region',
+ orient: 'left'
+ },
+ {
+ id: 'axis-bottom',
+ regionId: 'bar-region',
+ orient: 'bottom'
+ }
+ ]
+
+```
+# 1.2 VChart 架构与源码结构
+
+## 1.2.1 VChart, VGrammar 和 VRender 的关系
+
+这三者是 VisActor 可视化系统中的三个核心组件,它们的关系是层次化的,从底层到上层分别是:
+
+### VRender(底层)
+
+VRender 是一个底层的可视化渲染引擎,负责最基本的图形绘制和渲染工作:
+
+* 它提供了丰富的可视化渲染功能,包括自定义动画、元素组合和叙事排列
+
+* 它是 VisActor 可视化系统的基础,为上层库提供渲染能力
+
+* VRender 提供插件系统,可以灵活扩展
+
+* 它可以在 2D/3D 效果之间无缝切换
+
+* 它负责底层的 Canvas 操作、图形绘制、场景管理等
+
+### VGrammar(中层)
+
+VGrammar 是基于 VRender 的可视化语法库:
+
+* 它使用声明式语法来描述数据可视化
+
+* VGrammar 将数据与视觉元素映射起来,处理数据变换、标记、比例尺等
+
+* 它提供了更加高级的 API,简化了创建复杂可视化的过程
+
+* VGrammar 负责图表的语法定义、数据映射、自动布局等
+
+* 它相当于是对 VRender 的进一步封装,增加了更多的可视化语法概念
+
+### VChart(上层)
+
+VChart 是最上层的图表组件库:
+
+* 它基于 VGrammar 构建,封装了常见的图表类型(柱状图、饼图、折线图等)
+
+* VChart 提供了开箱即用的图表组件,用户不需要了解底层的图形语法
+
+* 它具有跨平台特性,能自动适配桌面、H5 和多种小程序环境
+
+* VChart 提供了完整的数据叙事能力,包括全面的注释、动画、流程控制和叙事模板
+
+* 它面向最终用户,提供了最友好的可视化界面和 API
+
+### 总结关系
+
+这三者的架构关系可以理解为:
+
+```Typescript
+VChart (图表组件库)
+ ↓
+VGrammar (可视化语法)
+ ↓
+VRender (渲染引擎)
+ ↓
+浏览器/Canvas/WebGL
+
+```
+从代码实现上看:
+
+* VChart 使用 VGrammar 来定义和构建图表
+
+* VGrammar 使用 VRender 来进行实际的绘制和渲染
+
+* 最终,VRender 控制底层的 Canvas/WebGL 绘制图形
+
+这种分层架构使得开发者可以根据需要选择不同层次的工具:如果需要高度自定义的可视化,可以直接使用 VRender 或 VGrammar;如果需要快速创建标准图表,则可以使用 VChart。
+
+## 1.2.2 VChart 内部组件之间关系与源码结构
+
+整体架构采用了模块化设计,核心分为以下几个主要部分:
+
+1. 核心引擎 (Core): VChart 的中心控制器,负责组织各模块协同工作
+
+1. 图表 (Chart): 各种图表类型的具体实现
+
+1. 系列 (Series): 负责图表中数据到图形的映射
+
+1. 标记 (Mark): 基础图形元素
+
+1. 区域 (Region): 定义图表渲染的区域
+
+1. 组件 (Component): 如坐标轴、图例等附加组件
+
+1. 布局 (Layout): 处理图表各元素的位置计算
+
+1. 事件 (Event): 处理用户交互
+
+1. 缩放 (Scale): 数据映射和比例尺相关
+
+1. 数据处理 (Data): 数据转换和处理
+
+### 核心模块
+
+#### VChart 核心类
+
+VChart 类是整个图表库的入口,它负责实例化和管理整个图表的生命周期。
+
+```Typescript
+// packages/vchart/src/core/vchart.ts
+export class VChart implements IVChart {
+ readonly id = createID();
+
+ // 用于注册图表、组件、系列等
+ static useRegisters(comps: (() => void)[]) { ... }
+ static useChart(charts: IChartConstructor[]) { ... }
+ static useSeries(series: ISeriesConstructor[]) { ... }
+
+ // 核心渲染流程
+ renderSync(morphConfig?: IMorphConfig) { ... }
+ async renderAsync(morphConfig?: IMorphConfig) { ... }
+
+ // 数据更新方法
+ updateData(id: StringOrNumber, data: DataView | Datum[] | string, ...) { ... }
+ updateSpec(spec: ISpec, forceMerge: boolean = false, ...) { ... }
+
+ // 状态管理
+ setSelected(datum: MaybeArray
+
+## 动画的分类
+
+#### 生命周期示范
+
+
+
+
+
+### 按执行时机分类
+
+图表动画在 VChart 中根据状态场景(执行时机)会被区分为:**图表入场动画**、**数据更新动画**和**图表退场动画**。
+
+1. **图表入场动画:**是指图表创建时的动画效果。
+
+1. **数据更新动画:**当我们更新图表数据时,图元发生的属性动画则称为数据更新动画。分为:**新增图元动画**、**图元更新动画**和**退场图元动画、状态变更动画、任意时机触发的动画**。通常情况下,你不需要考虑如何控制这三种更新动画,因为 VChart 会在数据更新时,识别出新数据与上一次数据间的关联,从而正确执行更新动画。
+
+1. **图表退场动画**:在某些场景下,我们可能需要移除图表。此时,我们可以为图表设置退场动画,让图表在除之前有一个平滑过渡的动画效果。
+
+
+
+https://visactor.io/vchart/guide/tutorial_docs/Animation/Animation_Types 动画教程文档
+
+https://www.visactor.io/vchart/option/barChart#animationState 动画配置文档
+
+#### 图表**入场动画 (**`**animationAppear**`**)**:
+
+* 在图表首次渲染时,元素从无到有的过渡效果。
+
+* 示例代码:`animationAppear` 配置项用于定义图表入场动画。
+
+
+
+```html
+
+
+
+
+
+```
+```xml
+animationAppear?: boolean | IStateAnimateSpec
+
+```html
+
+
+
+
+
+
+```
+> 如何创建一个基础VChart可以参考以下文档
+> https://www.visactor.io/vchart/guide/tutorial_docs/Getting_Started 快速上手
+> https://www.visactor.io/vchart/guide/tutorial_docs/Basic/How_to_Import_VChart 导入VChart
+> https://www.visactor.io/vchart/guide/tutorial_docs/Basic/A_Basic_Spec 基础配置
+> https://www.visactor.io/vchart/guide/tutorial_docs/Basic/DeepSeek_With_Cursor DeepSeek+Cursor助力
+
+
+
+在 `VChart` 类中,`spec`(图表配置)中的 `animation` 配置项用于控制图表的动画行为。具体来说,`animation` 配置项可以定义图表在不同状态下的动画效果,例如入场动画、更新动画、退出动画等。
+
+#### `animation` 配置的作用
+
+1. **定义动画行为**:
+
+* `animation` 配置项可以包含多个子属性,如 `appear`、`enter`、`update`、`exit` 和 `disappear`,分别对应不同的动画场景。
+
+* 每个子属性可以进一步配置动画的持续时间 (`duration`)、缓动函数 (`easing`)、是否逐个执行 (`oneByOne`) 等参数。
+
+1. **控制动画开关**:
+
+* 如果将 `animation` 设置为 `false`,则禁用所有动画效果。
+
+* 如果设置为 `true` 或者提供具体的配置对象,则启用相应的动画效果。
+
+1. **传递给底层组件**:
+
+* `VChart` 类会将 `animation` 配置传递给内部的 `Compiler` 和 `Chart` 实例,这些实例会根据配置来决定是否应用动画以及如何应用动画。
+
+### 柱状图执行动画示例说明
+
+
+
+#### 示例代码
+```xml
+import { isMobile } from 'react-device-detect';
+import { default as VChart } from '../../../../src/index';
+
+// 1. 创建图表配置项与数据
+const initialSpec = {
+ type: 'bar',
+ data: [
+ {
+ id: 'barData',
+ values: [
+ { month: 'January', sales: 22 },
+ { month: 'February', sales: 13 },
+ { month: 'March', sales: 25 },
+ { month: 'April', sales: 29 },
+ { month: 'May', sales: 38 }
+ ]
+ }
+ ],
+ xField: 'month',
+ yField: 'sales',
+ crosshair: {
+ xField: { visible: true }
+ },
+ animation: true // 开启动画
+};
+
+// 2. 创建 VChart 实例
+const vchart = new VChart(initialSpec, { dom: 'chart' });
+
+// 3. 渲染图表
+vchart.renderAsync().then(() => {
+ console.log('图表渲染完成');
+});
+
+// 4. 动画入场
+setTimeout(() => {
+ console.log('动画入场');
+}, 1000);
+
+// 5. 数据更新(新增图元)
+setTimeout(() => {
+ const newData = [
+ { month: 'June', sales: 45 },
+ { month: 'July', sales: 50 }
+ ];
+ vchart.updateDataSync('barData', newData, undefined, { reAnimate: true });
+ console.log('新增图元');
+}, 3000);
+
+// 6. 数据更新(图元更新)
+setTimeout(() => {
+ const updatedData = [
+ { month: 'January', sales: 30 },
+ { month: 'February', sales: 20 },
+ { month: 'March', sales: 35 },
+ { month: 'April', sales: 39 },
+ { month: 'May', sales: 48 },
+ { month: 'June', sales: 55 },
+ { month: 'July', sales: 60 }
+ ];
+ vchart.updateDataSync('barData', updatedData, undefined, { reAnimate: true });
+ console.log('图元更新');
+}, 6000);
+
+// 7. 数据更新(图元退出)
+setTimeout(() => {
+ const remainingData = [
+ { month: 'January', sales: 30 },
+ { month: 'February', sales: 20 },
+ { month: 'March', sales: 35 },
+ { month: 'April', sales: 39 },
+ { month: 'May', sales: 48 }
+ ];
+ vchart.updateDataSync('barData', remainingData, undefined, { reAnimate: true });
+ console.log('图元退出');
+}, 9000);
+
+// 8. 图元状态(state)的使用
+setTimeout(() => {
+ vchart.updateState(
+ {
+ selected: {
+ style: {
+ fill: 'red'
+ }
+ }
+ },
+ (series, mark, stateKey) => {
+ return mark.datum.sales > 40;
+ }
+ );
+ console.log('图元状态更新');
+}, 12000);
+
+// 9. 图表退场
+setTimeout(() => {
+ vchart.release();
+ console.log('图表退场');
+}, 15000);
+
+```
#### 创建逻辑说明
+1. **创建图表配置项与数据**:
+1. **创建 VChart 实例**:
+1. **渲染图表**:
+1. **动画入场**:
+1. **数据更新(新增图元)**:
+1. **数据更新(图元更新)**:
+1. **数据更新(图元退出)**:
+1. **图元状态(state)的使用**:
+1. **图表退场**:
+
+
#### 动画流程图
+
#### 流程说明
+1. **创建图表配置项与数据**:定义初始图表配置和数据。
+1. **创建 VChart 实例**:使用配置和DOM容器创建VChart实例。
+1. **渲染图表**:调用`renderAsync`方法渲染图表,触发动画入场效果。
+1. **动画入场**:图表渲染完成后,自动触发入场动画。
+1. **数据更新(新增图元)**:通过`updateDataSync`方法新增数据,触发新增动画。
+1. **数据更新(图元更新)**:通过`updateDataSync`方法更新数据,触发更新动画。
+1. **数据更新(图元退出)**:通过`updateDataSync`方法移除数据,触发退出动画。
+1. **图元状态(state)的使用**:通过`updateState`方法更新图元状态,设置特定条件下的样式。
+1. **图表退场**:通过`release`方法销毁图表实例,图表退场。
+
+
+
+
+
+```xml
+/**
+ * 自1.12.0后,全局形变动画需要手动注册才能生效
+ *
+ * import { registerMorph } from '@visactor/vchart';
+ *
+ * registerMorph();
+ */
+
+VCHART_MODULE.registerMorph();
+
+const pieSpec = {
+ type: 'pie',
+ data: [
+ {
+ values: [
+ { type: '1', value: Math.random() },
+ { type: '2', value: Math.random() },
+ { type: '3', value: Math.random() }
+ ]
+ }
+ ],
+ outerRadius: 0.8,
+ innerRadius: 0.6,
+ valueField: 'value',
+ categoryField: 'type',
+ tooltip: false
+};
+
+const barSpec = Object.assign({}, pieSpec, {
+ type: 'bar',
+ xField: 'type',
+ yField: 'value',
+ seriesField: 'type'
+});
+
+const specs = [pieSpec, barSpec];
+
+const vchart = new VChart(specs[0], { dom: CONTAINER_ID });
+
+vchart.renderSync();
+let count = 1;
+setInterval(() => {
+ vchart.updateSpec(specs[count % 2]);
+ count++;
+}, 2000);
+
+
+```
+
+#### 一对多动画
+
+一对多动画是指一个图形元素向多个图形元素过渡的动画。例如在下面这个例子中,展示了我们在柱状图和散点图之间切换时的全局动画,其中,将一个大的柱子拆分为多个散点的动画就是一对多动画。
+
+
+
+
+```javascript
+/**
+ * 自1.12.0后,全局形变动画需要手动注册才能生效
+ *
+ * import { registerMorph } from '@visactor/vchart';
+ *
+ * registerMorph();
+ */
+
+VCHART_MODULE.registerMorph();
+
+function calculateAverage(data, dim) {
+ let total = 0;
+ for (let i = 0; i < data.length; i++) {
+ total += data[i][dim];
+ }
+ return (total /= data.length);
+}
+
+function generateData(type) {
+ const data = [];
+ for (let i = 0; i < 10; i++) {
+ data.push({ x: i, y: Math.random(), type });
+ }
+ return data;
+}
+const DataA = generateData('A');
+
+const DataB = generateData('B');
+
+const barSpec = {
+ type: 'common',
+ series: [
+ {
+ type: 'bar',
+ data: { values: [{ value: calculateAverage(DataA, 'y'), type: 'A' }] },
+ xField: 'type',
+ yField: 'value',
+ morph: {
+ morphKey: 'A'
+ }
+ },
+ {
+ type: 'bar',
+ data: { values: [{ value: calculateAverage(DataB, 'y'), type: 'B' }] },
+ xField: 'type',
+ yField: 'value',
+ morph: {
+ morphKey: 'B'
+ }
+ }
+ ],
+ axes: [
+ { orient: 'left', type: 'linear', max: 1 },
+ { orient: 'bottom', type: 'band' }
+ ]
+};
+
+const scatterSpec = {
+ type: 'common',
+ series: [
+ {
+ type: 'scatter',
+ data: { values: DataA },
+ xField: 'x',
+ yField: 'y',
+ seriesField: 'type',
+ morph: {
+ morphKey: 'A',
+ morphElementKey: 'type'
+ }
+ },
+ {
+ type: 'scatter',
+ data: { values: DataB },
+ xField: 'x',
+ yField: 'y',
+ seriesField: 'type',
+ morph: {
+ morphKey: 'B',
+ morphElementKey: 'type'
+ }
+ }
+ ],
+ axes: [
+ { orient: 'left', type: 'linear', zero: false, max: 1 },
+ { orient: 'bottom', type: 'band' }
+ ]
+};
+
+const specs = [barSpec, scatterSpec];
+
+const vchart = new VChart(specs[0], { dom: CONTAINER_ID });
+
+vchart.renderSync();
+let count = 1;
+setInterval(() => {
+ vchart.updateSpec(specs[count % 2]);
+ count++;
+}, 3000);
+
+
+```
+#### 多对一动画
+
+多对一动画是指多个图形元素过渡到一个元素。例如,在上面的例子中,我们可以让散点系列的多个点合并为一个大的柱子。
+
+### 效果实现的源码执行过程解读
+
+通过配置可以说明不同图表的切换是通过更新配置来实现的,并且在形变动画开启的情况下会自动识别系列图元的切换过渡效果,下面对默认效果的设置做一个说明。
+
+
+
+
+
+### 草稿 全局动画的实现解读x
+
+
+
+全局动画是指那些作用于整个图表级别的动画效果,它们可以应用于图表加载时的整体入场动画、数据更新时的统一变化动画,以及图表销毁前的整体退场动画。在VChart中,全局动画的设计和实现依赖于几个核心组件和机制,包括`Factory`类、`AnimateManager`类、`IAnimationSpec`接口等。
+
+
+
+#### 1. 动画注册与管理
+
+
+
+**Factory 类**
+
+
+
+`Factory`类是动画系统中的一个关键角色,它负责管理和注册各种类型的动画。通过静态方法`registerAnimation`,我们可以将特定的动画逻辑与名称关联起来,以便后续使用。
+
+
+
+```xml
+class Factory {
+ static registerAnimation(key: string, animation: (params?: any, preset?: any) => MarkAnimationSpec) {
+ Factory._animations[key] = animation;
+ }
+}
+
+```
+
+
+当需要为某个图表元素添加动画时,可以通过`Factory.getAnimationInKey`获取已注册的动画,并将其应用到对应的图元或图形元素上。
+
+
+
+#### 2. 动画配置结构
+
+
+
+**IAnimationSpec 接口**
+
+
+
+`IAnimationSpec`接口定义了动画配置的基本结构,涵盖了从入场(`animationAppear`)到退场(`animationDisappear`)的各种状态。每个状态都可以接受布尔值(启用/禁用)、预设配置对象或自定义配置对象作为参数。
+
+
+
+```xml
+interface IAnimationSpecRGB 转 HSL 算法:
+1. 将 RGB 值归一化到 [0,1]
+1. 找出 R、G、B 中的最大值和最小值
+1. 计算亮度 L = (max + min) / 2
+1. 计算饱和度 S
+1. 计算色相 H
+HSL 转 RGB 算法:
+1. 将 H 分成 6 个区间
+1. 根据 S 和 L 计算中间变量
+1. 通过不同公式计算 R、G、B 值
+1. 将结果映射到 [0,255]
+
+* 如果 max == min,S = 0
+
+* 否则 S = (max - min) / (1 - |2L - 1|)
+
+* 根据哪个颜色分量最大,用不同公式计算
+
+* 范围 0-360 度
+
+2. **设置颜色的透明度**
+
+ **透明度调整核心代码**
+
+```javascript
+if (isValid(colorKey.a)) {
+ c.setOpacity(colorKey.a);
+}
+
+```
+#### **queryToken Token 语义化**
+
+```xml
+export function queryToken通过 `VChart` 类的方法定义,实现图表的核心渲染和更新逻辑,`ThemeManager` 和 `InstanceManager` 分别负责主题和实例的全局管理,形成了一个解耦、灵活且可扩展的图表库架构;
+其中 `VChart` 提供统一的更新入口,实现了绝大部分的更新操作逻辑;而`ThemeManager` 和 `InstanceManager` 通过实例注册和遍历机制,实现了全局主题更新的能力。
+
+# 深入分析主题更新流程
+
+VChart 官网把主题更新分为了两个维度,即
+
+* 单独更新**某个图表实例**的主题
+
+* 通过 `ThemeManager`更新**全局所有图表**的主题。
+
+
+
+具体做法可以访问[🎁 VisActor Data Visualization Competition](https://www.visactor.io/vchart/guide/tutorial_docs/Theme/Customize_Theme)查看。两种做法都是通过同样的方法`setCurrentTheme`调用来切换主题,前者是使用VChart对象生成的实例调用,更新的是单个图表;后者通过`ThemeManager`调用,更新了全局图表主题。所以,我阅读源码的思路是基于`setCurrentTheme`这个方法的声明、定义来层层深入的。
+
+## 示例:
+
+单个实例的更新:
+
+```xml
+const vchart = new VChart(spec, { dom: CONTAINER_ID });
+//单个theme实例的更新
+vchart.setCurrentTheme('userTheme');
+
+```
+全局主题的更新:
+
+```xml
+// 注册主题
+VChart.ThemeManager.registerTheme('userTheme', theme);
+//全局主题更新
+VChart.ThemeManager.setCurrentTheme('userTheme');
+
+```
+## 主题更新执行者:VChart.ts
+
+分析更新行为,重点是阅读这一条调用链:
+
+`setCurrentTheme()`→ `setCurrentThemeSync()`&`updateCustomConfigAndRerender()`→ `_setCurrentTheme()`的执行过程
+
+### `_setCurrentTheme() `
+
+```xml
+ protected _setCurrentTheme(name?: string): IUpdateSpecResult {
+ this._updateCurrentTheme(name);
+ this._initChartSpec(this._getSpecFromOriginalSpec(), 'setCurrentTheme');
+ this._chart?.setCurrentTheme();
+ return { change: true, reMake: false };
+ }
+
+```
+首先分析内部私有方法_setCurrentTheme,先触发`_updateCurrentTheme`,进入11-1讲解的主题的合并,解析流程,接下来重新初始化图表规格(spec),`chart` 是图表的核心渲染实例,负责具体的渲染和交互逻辑,这里调用了`setCurrentTheme`这个方法,下面会重点解析。
+
+最后返回的{ change: true, reMake: false },change表示:表示配置已发生变更,触发重新渲染,告诉渲染引擎需要更新,reMake表示不需要完全重建图表,只需要局部更新即可。返回这个结构是为了在后续的`setCurrentThemeSync `中的 `updateCustomConfigAndRerender`中触发图表的更新行为。
+
+
+
+### `setCurrentThemeSync()` & `updateCustomConfigAndRerender()`
+
+```xml
+ /**
+ * **同步方法** 设置当前主题。
+ * **注意,如果在 spec 上配置了 theme,则 spec 上的 theme 优先级更高。**
+ * @param name 主题名称
+ * @returns
+ */
+ setCurrentThemeSync(name: string) {
+ if (!ThemeManager.themeExist(name)) {
+ return this as unknown as IVChart;
+ }
+ const result = this._setCurrentTheme(name);
+ this._setFontFamilyTheme(this._currentTheme?.fontFamily as string);
+ this.updateCustomConfigAndRerender(result, true, {
+ transformSpec: false,
+ actionSource: 'setCurrentTheme'
+ });
+ return this as unknown as IVChart;
+ }
+
+```
+判空后,首先拿到了{ change: true, reMake: false }这个约定好的对象,意为主题更新,必须触发重新渲染,但是不需要完全重建表格,只是局部更新即可。
+
+
+
+#### `updateCustomConfigAndRerender()`
+
+```xml
+ //result: { change: true, reMake: false };
+
+ //调用updateCustomConfigAndRerender
+ this.updateCustomConfigAndRerender(result, true, {
+ transformSpec: false,
+ actionSource: 'setCurrentTheme'
+ });
+
+ //updateCustomConfigAndRerender具体实现
+ updateCustomConfigAndRerender(
+ updateSpecResult: IUpdateSpecResult | (() => IUpdateSpecResult),
+ sync?: boolean,
+ option: IVChartRenderOption = {}
+ ) {
+ if (this._isReleased || !updateSpecResult) {
+ return undefined;
+ }
+ if (isFunction(updateSpecResult)) {
+ updateSpecResult = updateSpecResult();
+ }
+
+ if (updateSpecResult.reAnimate) {
+ this.stopAnimation();
+ this._updateAnimateState(true);
+ }
+
+ this._reCompile(updateSpecResult);
+ if (sync) {
+ return this._renderSync(option);
+ }
+ return this._renderAsync(option);
+ }
+
+
+```
+`updateCustomConfigAndRerender` 是主题重渲染的核心逻辑,也是任何主题配置更改(数据模型、图表spec等发生更改时)重渲染的核心。在主题更新里的逻辑并不复杂,因为传入的`updateSpecResult`:{ change: true, reMake: false } 并不包括动画处理、也不是函数类型,只执行了`_reCompile()`和`_renderSync()`;
+
+##### `recompile()`
+
+```xml
+ protected _reCompile(updateResult: IUpdateSpecResult, morphConfig?: IMorphConfig) {
+ if (updateResult.reMake) {
+ this._releaseData();
+ this._initDataSet();
+ this._chart?.release();
+ this._chart = null as unknown as IChart;
+ }
+
+ if (updateResult.reTransformSpec) {
+ // 释放图表等等
+ this._chartSpecTransformer = null;
+ }
+
+ // 卸载了chart之后再设置主题 避免多余的reInit
+ if (updateResult.changeTheme) {
+ this._setCurrentTheme();
+ this._setFontFamilyTheme(this._currentTheme?.fontFamily as string);
+ } else if (updateResult.changeBackground) {
+ this._compiler?.setBackground(this._getBackground());
+ }
+
+ if (updateResult.reMake) {
+ // 如果不需要动画,那么释放item,避免元素残留
+ this._compiler?.releaseGrammar(this._option?.animation === false || this._spec?.animation === false);
+ // chart 内部事件 模块自己必须删除
+ // 内部模块删除事件时,调用了event Dispatcher.release() 导致用户事件被一起删除
+ // 外部事件现在需要重新添加
+ this._userEvents.forEach(e => this._event?.on(e.eType as any, e.query as any, e.handler as any));
+
+ if (updateResult.reSize) {
+ this._doResize();
+ }
+ } else {
+ if (updateResult.reCompile) {
+ // recompile
+ // 清除之前的所有 compile 内容
+ this._compiler?.clear(
+ { chart: this._chart, vChart: this },
+ this._option?.animation === false || this._spec?.animation === false
+ );
+ // TODO: 释放事件? vgrammar 的 view 应该不需要释放,响应的stage也没有释放,所以事件可以不绑定
+ // 重新绑定事件
+ // TODO: 释放XX?
+ // 重新compile
+ this._compiler?.compile({ chart: this._chart, vChart: this }, {});
+ }
+ if (updateResult.reSize) {
+ const { width, height } = this.getCurrentSize();
+ this._chart.onResize(width, height, false);
+ this._compiler.resize(width, height, false);
+ }
+ }
+ }
+
+```
+* reMake为true时会通过`_releaseData`、`_initDataSet`、`release`彻底重置图表,释放所有相关资源,为重新渲染做准备。当然前面提到了,主题更新并不会完全重置图表。
+
+* reMake为false时,会根据`reCompile`和`reSize`的值分别执行重新compile 和 图表的尺寸重置,操作例如`_chart`、`_compiler`等实例上的方法实现。
+
+
+
+阅读源码后得知,主题更新时其实也不会触发reCompile操作,一般是图形有增减,才需要reCompile。
+
+##### `_renderSync()`
+
+```xml
+ protected _renderSync = (option: IVChartRenderOption = {}) => {
+ const self = this as unknown as IVChart;
+ if (!this._beforeRender(option)) {
+ return self;
+ }
+ // 填充数据绘图
+ this._compiler?.render(option.morphConfig);
+ this._afterRender();
+ return self;
+ };
+
+
+```
+这是一个同步渲染方法,通过 `_beforeRender` 进行渲染前的准备和检查,确保渲染条件满足;调用 `_compiler` 的 `render` 方法执行实际的图表绘制,可以传入变形配置;完成绘制 `_afterRender` 进行渲染后的清理和状态更新,并返回当前实例。
+
+## 实现全局更新的原理
+
+### 主题调度中心 theme-manager
+
+前面提到VChart实例更新主题是针对一个图表来更新的,而themeManager是更新全局的主题
+
+https://www.visactor.io/vchart/guide/tutorial_docs/Theme/Customize_Theme
+在`ThemeManager`注册主题后,可以用 `ThemeManager.setCurrentTheme` 通过主题名称来热更新已注册的主题。注意:这个方法将影响页面上的所有图表实例。
+
+```xml
+ static setCurrentTheme(name: string) {
+ if (!ThemeManager.themeExist(name)) {
+ return;
+ }
+ ThemeManager._currentThemeName = name;
+ InstanceManager.forEach((instance: IVChart) => instance?.setCurrentTheme(name));
+ }
+
+```
+不难看出 这个方法全局设置当前主题名,然后遍历所有已注册的图表实例(instance)并对每个实例调用 `setCurrentTheme`,从而实现了全局实例的主题更新。
+
+### 主题实例操作的原因 instance-manager
+
+instance对图表的操作,其实是因为在VChart类的构造函数内,将当前 VChart 实例注册到 `InstanceManager.instances` 中,从而支持全局操作,如统一更新主题。
+
+```xml
+ export class VChart implements IVChart {
+ constructor(spec: ISpec, options: IInitOption) {
+ //......其他
+ InstanceManager.registerInstance(this);
+ }
+ }
+
+```
+
+
+# 结语
+
+总之,vchart.ts里在VChart类里实现了更新的绝大部分操作,不仅仅是主题更新,也涉及到其余需要更新的情况。主题更新只是其中的一部分;theme-manager和instance-manager通过对于实例的注册,遍历,让开发者可以通过ThemeManager来管理全局更新主题,实现了主题的单个实例更新和全局更新。
+
+---
+# 本文档由以下人员提供
+
+吨吨(https://github.com/Shabi-x)
+
+
+
+ # 本文档由以下人员修正整理
+ [玄魂](https://github.com/xuanhun)
\ No newline at end of file
diff --git a/docs/assets/contributing/zh/sourcesode/12.1-vchart-plugin-mechanism.md b/docs/assets/contributing/zh/sourcesode/12.1-vchart-plugin-mechanism.md
new file mode 100644
index 0000000000..4631742052
--- /dev/null
+++ b/docs/assets/contributing/zh/sourcesode/12.1-vchart-plugin-mechanism.md
@@ -0,0 +1,135 @@
+---
+title: 12.1 VChart 插件机制
+
+key words: VisActor,VChart,VTable,VStrory,VMind,VGrammar,VRender,Visualization,Chart,Data,Table,Graph,Gis,LLM
+---
+> ## 12.1 VChart 插件机制
+> 分数:5
+> ## 12.2 VChart 插件功能源码详解
+> 分数:5
+> 1. 代码入口:` packages/vchart/src/plugin`
+> 1. 解读重点:
+
+1. 插件的不同类型
+
+1. 插件机制与实现原理
+
+
+
+# 插件系统概念
+
+在VChart中提供了一系列插件扩展支持,本文只讲述插件系统的概念和简单用法示例,深入源码探索放在12.2章节分析并介绍;
+
+## VChart的插件不同类型
+
+### 格式化插件
+
+VChart中的格式化插件支持使用formatter更新数据展示样式,通过简单的配置丰富数据展示风格:
+
+```xml
+ const spec = {
+ data: [
+ {
+ id: "barData",
+ values: [
+ { month: "Monday", sales: 22.324 },
+ { month: "Tuesday", sales: 13.663 },
+ { month: "Wednesday", sales: 25.342 },
+ { month: "Thursday", sales: 29.3257 },
+ { month: "Friday", sales: 12.999 },
+ ],
+ },
+ ],
+ type: "bar",
+ xField: "month",
+ yField: "sales",
+ label: {
+ visible: true,
+ position: "top",
+ formatter: "¥{sales:.2t}",
+ **//格式化:销售额指定保留两位小数但不四舍五入**
+ },
+ legends: {
+ visible: true,
+ },
+ };
+
+```
+
+
+>
+> 格式化效果如图
+
+
+
+### media-query
+
+media-query插件模块实现了媒体查询功能,为了方便理解,可以借助官网的一个demo来解释:
+
+```Typescript
+const getSpec = () => ({
+ type: 'pie',
+ data: [
+ //...
+ ],
+ //query-media配置流程
+ media: [
+ {
+ query: {
+ maxHeight: 200
+ },
+ action: [
+ {
+ filterType: 'legends',
+ filter: [{ orient: 'top' }, { orient: 'bottom' }],
+ spec: { orient: 'left', padding: 0 }
+ },
+ {
+ filterType: 'title',
+ spec: { visible: false }
+ },
+ {
+ filterType: 'chart',
+ spec: { padding: 10 }
+ }
+ ]
+ }
+ ]
+});
+
+```
+
+
+
+
+
+
+
+
+观察这个实例不难发现,在媒体查询的作用下,通过声明媒体查询逻辑,实现了图表在不同高度下动态的布局的样式变化:
+
+* 当图表高度 ≤ 200px 时:
+
+* 图例方向改为左侧,内边距为 0。
+
+* 标题隐藏。
+
+* 图表内边距为 10。
+
+* 当图表高度 > 200px 时:
+
+* 恢复默认样式。
+
+
+
+简单的说,VChart的media-query插件支持我们触发动作(action)的情况下,执行对图表布局的重新排布,实现了图表的响应式设计,提升了用户体验和开发效率。
+
+
+
+
+
+下一章节我将围绕插件的具体实现机制,做更深入的解读:
+
+
+ # 本文档由以下人员修正整理
+ [玄魂](https://github.com/xuanhun)
\ No newline at end of file
diff --git a/docs/assets/contributing/zh/sourcesode/12.2-vchart-plugin-feature-source-code-analysis.md b/docs/assets/contributing/zh/sourcesode/12.2-vchart-plugin-feature-source-code-analysis.md
new file mode 100644
index 0000000000..c0853f63b2
--- /dev/null
+++ b/docs/assets/contributing/zh/sourcesode/12.2-vchart-plugin-feature-source-code-analysis.md
@@ -0,0 +1,101 @@
+---
+title: 12.2 VChart 插件功能源码详解
+
+key words: VisActor,VChart,VTable,VStrory,VMind,VGrammar,VRender,Visualization,Chart,Data,Table,Graph,Gis,LLM
+---
+上文(#12.1 VChart 插件机制 )介绍了VChart中插件的基本使用,这一节我将深入源码重点探索各类插件的实现逻辑;
+
+## 相关源码位置
+
+* ` packages/vchart/src/plugin/chart/formatter/` :格式化插件的核心实现
+
+* ` packages/vchart/src/plugin/chart/media-query/` :媒体查询插件的核心实现
+
+## 格式化插件
+
+### 数值文本格式化
+
+```xml
+ protected _formatSingleText(text: string | number, formatter: string): string | number {
+ const isNumeric = numberSpecifierReg.test(formatter);
+ if (isNumeric && this._numericFormatter) {
+ // 内置的 formatter 逻辑,可以进行缓存性能优化
+ let numericFormat;
+ if (this._numericFormatterCache && this._numericSpecifier) {
+ if (this._numericFormatterCache.get(formatter)) {
+ numericFormat = this._numericFormatterCache.get(formatter);
+ } else {
+ numericFormat = this._numericSpecifier(formatter) as any;
+ this._numericFormatterCache.set(formatter, numericFormat);
+ }
+ return numericFormat(Number(text));
+ }
+ return this._numericFormatter(formatter, Number(text));
+ } else if (formatter.includes('%') && this._timeFormatter) {
+ return this._timeFormatter(formatter, text);
+ }
+ return text;
+ }
+
+
+```
+### 时间文本格式化
+
+VChart对于时间格式的转换在
+
+```xml
+private readonly _timeModeFormat = {
+ utc: TimeUtil.getInstance().timeUTCFormat,
+ local: TimeUtil.getInstance().timeFormat
+};
+
+// 在 onInit 中设置时间格式化器
+onInit(service: IChartPluginService, chartSpec: any) {
+ const { timeMode, timeFormatter } = this._spec;
+
+ if (isFunction(timeFormatter)) {
+ // 使用自定义时间格式化函数
+ this._timeFormatter = timeFormatter;
+ } else if (timeMode && this._timeModeFormat[timeMode]) {
+ // 使用内置的 UTC 或本地时间格式化
+ this._timeFormatter = this._timeModeFormat[timeMode];
+ }
+}
+
+// 在 _formatSingleText 中处理时间格式化
+protected _formatSingleText(text: string | number, formatter: string): string | number {
+ // 数值格式化逻辑...
+
+ // 时间格式化逻辑
+ else if (formatter.includes('%') && this._timeFormatter) {
+ return this._timeFormatter(formatter, text);
+ }
+
+ return text;
+}
+
+```
+### 数据变量替换
+
+1. **模板解析**:
+
+* 使用正则表达式`/\{([^}]+)\}/g`匹配大括号模板
+
+* 支持嵌套格式定义(如`{field:format}`)
+
+1. **字段提取**:
+
+* 通过冒号分割字段名和格式说明(`field:format`)
+
+1. **动态替换**:
+
+* 从数据对象`datum`中提取对应字段值
+
+* 递归应用格式说明进行二次格式化
+
+## Media-query插件
+
+
+
+ # 本文档由以下人员修正整理
+ [玄魂](https://github.com/xuanhun)
\ No newline at end of file
diff --git a/docs/assets/contributing/zh/sourcesode/13.1-vchart-on-demand-loading-mechanism.md b/docs/assets/contributing/zh/sourcesode/13.1-vchart-on-demand-loading-mechanism.md
new file mode 100644
index 0000000000..06ec2e9c04
--- /dev/null
+++ b/docs/assets/contributing/zh/sourcesode/13.1-vchart-on-demand-loading-mechanism.md
@@ -0,0 +1,145 @@
+---
+title: 13.1 VChart 按需加载机制
+
+key words: VisActor,VChart,VTable,VStrory,VMind,VGrammar,VRender,Visualization,Chart,Data,Table,Graph,Gis,LLM
+---
+VChart是一款开箱即用的图表库,默认提供了20+的图表类型,随着图表类型的增加,功能的丰富,包体积也是大家非常关注的一个点,所以VChart通过按需加载机制来满足各种场景对vchart的不同需要;在介绍具体设计之前,我们需要了解两个前置概念:
+
+* vchart图表构成
+
+* 什么是tree-shaking
+
+本文将从这两个角度介绍vchart按需加载的原理
+
+## VChart 图表组成
+
+### 术语定义
+
+在深入了解VChart图表组成之前,我们需要了解以下术语:
+
+* `series` - 图表主体,也称系列,包含一组图元及其对应的图表逻辑。
+
+* `mark` - 基本图形元素,也称基础图元,如点、线条形等。
+
+* `region` - 空间信息元素,关联一组或多组 series,帮助定位空间。
+
+* `component` - 组件,帮助图表阅读和交互的元素,如图例、坐标轴、提示等。
+
+* `layout` - 布局,管理图表元素的空间分布。
+
+* `chart` - 图表抽象概念,整合、管理数据、图元、组件、布局各种元素的管理者。
+
+### 图表定义
+
+#### 逻辑层图表元素
+
+我们将图表的逻辑层元素拆解为以下四个部分:
+
+* series 是图表主体,含一组图元和对应类型的图表逻辑。例如线图中,series 指点和线的集合以及线图所有的逻辑等。
+
+* component 提供辅助能力,帮助图表阅读和交互的组件,比如图例,坐标轴,tooltip,dataZoom 等。
+
+* region 是一个空间信息元素,它可以关联一组或多组 series,帮助 series 进行空间定位,同时 region 还是一个最小组合单元。
+
+* chart 是一个抽象概念,它是对图表的各种元素进行整合、管理布局的管理者,是图表逻辑层的核心上下文。
+
+##### 简单图表
+
+简单图表是由一个 region、一个确定类型的 series、component 和一个管理图表逻辑的 chart 构成。以一个常见的折线图为例,其组成如下
+
+
+
+##### 组合图表
+
+我们将组合图定义为由多个 region、多个确定类型的 series、component 和一个管理图表逻辑的 chart 构成,这里的 chart 我们将其封装为 `type: 'common'` 的组合图表。
+
+在组合图中可以定义若干不同类型的子图。每个子图可以独立配置自己的数据和组件,所有子图默认关联在同一个 region。此时各个子图在 region 上是重叠的。我们以常见的柱线双轴图为例来详细介绍组合图表:
+
+* 首先如果我们需要创建组合图,我们需要声明 `type: 'common'`,表示我们需要创建的图表类型为组合图
+
+* 在上面我们提到,chart 是整合、管理数据、图元、组件、布局各种元素的管理者,从逻辑层组成上他是由 region + series + layout 组成的,而柱线分别对应 'bar' 和 'line' 这两种系列类型,而默认所有的系列都是关联在同一个 region 的,所以这里我们不需要配置 region
+
+* 每个系列可以有自己的数据源,也可以直接将数据源配置在 chart 上,series 中通过 `fromDataId` 或者 `fromDataIndex` 来关联,当前的例子我们选择配置在 chart 上
+
+
+
+如前所述,region 是空间信息元素,可以结合布局利用多个不同定位的 region 对画布进行空间划分;同时,组件也可以指定与 region 关联的关系,当一个组件关联了多个 region 时,会默认收集所有 region 下子图的数据维度进行展示,如下示例所示:
+
+
+
+### 图元 mark
+
+图元是图表视图层对图形的定义,VChart 定义图表中的图元包括基础图元和组合图元。
+
+基础图元包括:标记(symbol)、矩形(rect)、线条(line)、直线(rule)、弧形(arc)、面积(area)、文本(text)、路径(path)、图片(image)、3D 矩形(rect3d)、3D 弧线(arc3d)、多边形(polygon)等。
+
+由多个基础图元进行组合就构成了组合图元,我们把基础图元和组合图元统称为图元。
+
+逻辑层元素(如 series 系列)是由若干图元构成的,如面积图(`'area'`)系列,包括点、线、面积组成,对应的基础图元分别为:标记(Symbol)、线条(line)、面积(area)
+
+
+
+## 什么是tree-shaking
+
+
+
+Tree Shaking 是一种代码优化技术,用于移除 JavaScript 中未使用的代码(dead code)。这个概念最早由 Rollup 提出,后来被 Webpack 等构建工具广泛采用。
+
+
+
+Tree Shaking 的实现主要依赖于 ES Module 的这些特性:
+
+* 导入导出语句只能在模块顶层
+
+* 导入导出的模块名字不能是动态的
+
+* 导入的模块是不可变的
+
+
+
+```javascript
+// 1. 导入导出语句只能在模块顶层
+import { foo } from './foo';
+export const bar = () => {};
+
+// 2. 导入导出的模块名字不能是动态的
+import { 'f' + 'oo' }; // 错误
+
+// 3. 导入的模块是不可变的
+import { foo } from './foo';
+foo = 'bar'; // 错误
+
+```
+打包工具根据文件之间的依赖关系,在标记阶段构建模块依赖图,分析导入导出关系,在打包阶段移除未使用的导出,仅保留使用的代码
+
+
+
+```javascript
+// 1. 标记阶段
+// module.js
+export const foo = () => console.log('foo');
+export const bar = () => console.log('bar');
+
+// main.js
+import { foo } from './module';
+foo(); // foo被标记为使用
+// bar未被使用,标记为dead code
+
+// 2. 删除阶段
+// 打包后,bar函数被删除
+const foo = () => console.log('foo');
+foo();
+
+```
+在使用 Tree Shaking 时,`sideEffects` 配置在确保未使用代码被正确移除方面起着关键作用。在项目的 `package.json` 文件中,`sideEffects` 字段用于告知打包工具哪些文件或模块具有副作用,即除了导出值之外还会执行其他操作(例如修改全局状态、执行初始化代码等)。如果一个模块没有副作用,打包工具可以安全地移除未被引用的部分。
+
+## VChart 按需加载的原理
+
+基于上述对 VChart 图表组成和 Tree Shaking 概念的了解,VChart 按需加载的核心思路就是利用 Tree Shaking 技术,只打包用户实际使用到的图表类型、组件、图元等代码,从而减小包体积。再下一章节,我们将详述一些实现细节。
+
+
+
+
+
+ # 本文档由以下人员修正整理
+ [玄魂](https://github.com/xuanhun)
\ No newline at end of file
diff --git a/docs/assets/contributing/zh/sourcesode/13.2-vchart-on-demand-loading-source-code-analysis.md b/docs/assets/contributing/zh/sourcesode/13.2-vchart-on-demand-loading-source-code-analysis.md
new file mode 100644
index 0000000000..2c917bc77a
--- /dev/null
+++ b/docs/assets/contributing/zh/sourcesode/13.2-vchart-on-demand-loading-source-code-analysis.md
@@ -0,0 +1,188 @@
+---
+title: 13.2 VChart 按需加载源码详解
+
+key words: VisActor,VChart,VTable,VStrory,VMind,VGrammar,VRender,Visualization,Chart,Data,Table,Graph,Gis,LLM
+---
+基于前文,我们已介绍了 VChart 图表组成和 Tree Shaking 概念。基于这两个前置概念,接下来将详细阐述 VChart 按需加载的具体实现。
+
+## VChart图表的核心创建流程
+
+
+
+
+
+## Factory
+
+VChart 的按需加载主要依托 `Factory` 类来达成。该类承担着重要职责,负责对各类图表、系列、组件、图元、Region、布局以及插件进行注册和创建。下面将从注册机制、创建机制以及图表的按需注册这几个方面展开深入分析。
+
+### 注册机制
+
+`Factory` 类提供了一系列静态方法,用于注册不同类型的模块。通过这些方法,模块被注册到 `Factory` 的静态属性中,进而形成一个注册表。具体代码如下:
+
+```xml
+static registerChart(key: string, chart: IChartConstructor) {
+ Factory._charts[key] = chart;
+}
+static registerSeries(key: string, series: ISeriesConstructor) {
+ Factory._series[key] = series;
+}
+static registerComponent(key: string, cmp: IComponentConstructor, alwaysCheck?: boolean) {
+ Factory._components[key] = { cmp, alwaysCheck };
+}
+// 其他注册方法...
+
+```
+### 创建机制
+
+`Factory` 类同样提供了一系列静态方法,用于按需创建模块实例。这些方法会依据类型从注册表中查找对应的构造函数,并创建实例。示例代码如下:
+
+```xml
+static createChart(chartType: string, spec: any, options: IChartOption): IChart | null {
+ if (!Factory._charts[chartType]) {
+ return null;
+ }
+ const ChartConstructor = Factory._charts[chartType];
+ return new ChartConstructor(spec, options);
+}
+static createSeries(seriesType: string, spec: any, options: ISeriesOption) {
+ if (!Factory._series[seriesType]) {
+ return null;
+ }
+ const SeriesConstructor = Factory._series[seriesType];
+ return new SeriesConstructor(spec, options);
+}
+// 其他创建方法...
+
+```
+### 图表的按需注册
+
+以线图为例,下面来看具体的按需注册实现。在 `packages/vchart/src/chart/line/line.ts` 中,有如下代码:
+
+```javascript
+export const registerLineChart = () => {
+ registerLineSeries();
+ Factory.registerChart(LineChart.type, LineChart);
+};
+
+```
+其中 `registerLineSeries` 在 `packages/vchart/src/series/line/line.ts` 中实现,代码如下:
+
+```javascript
+export const registerLineSeries = () => {
+ registerSampleTransform();
+ registerMarkOverlapTransform();
+ registerLineMark();
+ registerSymbolMark();
+ registerLineAnimation();
+ registerScaleInOutAnimation();
+ registerCartesianBandAxis();
+ registerCartesianLinearAxis();
+ Factory.registerSeries(LineSeries.type, LineSeries);
+};
+
+```
+通过上述代码实现,在使用 VChart 时,若调用 `registerLineChart` 注册线图,就会将线图依赖的线的系列、线图元、点图元等必要元素默认注册。具体使用方式如下:
+
+```xml
+import { VChart } from './core';
+import { registerLineChart } from './chart/line';
+VChart.useRegisters([
+ registerLineChart,
+ // 其他需要的模块
+]);
+
+```
+而在 `packages/vchart/src/core/vchart.ts` 中,创建图表实例时并非直接通过路径引用,而是借助 `Factory.createChart` 来创建。如此一来,核心类 `vchart` 就能在不引用所有图表实现的情况下,依据用户注册的图表创建实例。相关代码如下:
+
+```xml
+private _initChart(spec: any) {
+ // ...
+ const chart = Factory.createChart(spec.type, spec, this._getChartOption(spec.type));
+ //...
+ }
+
+```
+## 核心类 VChart 的按需加载
+
+接下来探讨一个问题:以下两种引用 `VChart` 的方式是否存在差异?
+
+* 方法一:
+
+```javascript
+import VChart from '@visactor/vchart';
+
+```
+* 方法二:
+
+```javascript
+import { VChart } from '@visactor/vchart';
+
+```
+答案是肯定的,这两种引用方式所产生的效果不同。下面分析其差异原因。
+
+首先,在 vchart 代码库对应的 `package.json` 中,可看到如下配置:
+
+```xml
+{
+ "sideEffects": [
+ "./*/index-lark.js",
+ "./*/index-wx-simple.js",
+ "./*/index-wx.js",
+ "./*/vchart-all.js",
+ "./*/vchart-simple.js"
+ ],
+}
+
+```
+该配置明确声明了所有有副作用的文件。
+
+在 `packages/vchart/index.ts` 中,有以下导出内容:
+
+```xml
+import { VChart } from './vchart-all';
+export default VChart;
+export * from './core';
+
+```
+其中 `core/index.ts` 文件中又有如下导出:
+
+```javascript
+import { VChart } from './vchart';
+export { VChart, Factory };
+
+```
+所以方法一等价于如下引用,引用的 VChart 是 vchart - all 导出的 VChart 类,方法二引用的相当于从 `core/vchart.ts` 导出的 VChart 类。
+
+```json
+import { default as VChart } from '@visactor/vchart';
+
+```
+其中文件 `vchart-all.ts` 的主要作用是注册和导出 VChart 的所有功能模块:
+
+```json
+VChart.useRegisters([
+ // charts
+ registerLineChart,
+ registerAreaChart,
+ // ...其他图表
+ // components
+ registerCartesianLinearAxis,
+ registerCartesianBandAxis,
+ // ...其他组件
+ // layout
+ registerGridLayout,
+ registerLayout3d,
+ // mark
+ registerAllMarks,
+ // plugin
+ registerDomTooltipHandler,
+ registerCanvasTooltipHandler,
+ // ...其他插件
+]);
+export { VChart };
+
+```
+由于 vchart - all 是声明了有副作用的文件,所以当采用方案一引用 VChart 时,会将所有 `vchart-all` 中依赖的文件都进行打包;而使用方案二引用 VChart 时,仅会打包 `core/vchart.ts`。
+
+ # 本文档由以下人员修正整理
+ [玄魂](https://github.com/xuanhun)
\ No newline at end of file
diff --git a/docs/assets/contributing/zh/sourcesode/14.1.1-react-vchart-introduction.md b/docs/assets/contributing/zh/sourcesode/14.1.1-react-vchart-introduction.md
new file mode 100644
index 0000000000..a5583e1ecd
--- /dev/null
+++ b/docs/assets/contributing/zh/sourcesode/14.1.1-react-vchart-introduction.md
@@ -0,0 +1,133 @@
+---
+title: 14.1.1 React-VChart 简介
+
+key words: VisActor,VChart,VTable,VStrory,VMind,VGrammar,VRender,Visualization,Chart,Data,Table,Graph,Gis,LLM
+---
+## 概览
+
+react-vchart 是 VChart 的 React 封装版本,对外主要提供两种风格的组件:
+
+* `
+
+
+
+ );
+};
+export default App;
+
+```
+通过上述代码示例,可以更直观地理解两种组件在使用上的差异。
+
+
+
+## 核心代码实现
+
+
+
+从实现的角度,`