Abstract
Phenology of vegetation is a sensitive and valuable indicator of the dynamic responses of terrestrial ecosystems to climate change. Therefore, to better understand and predict ecosystems dynamics, it is important to reduce uncertainties in detecting phenological changes. Here, changes in phenology over the past several decades across the northern high-latitude region (≥60°N) were examined by calibrating and analyzing time series of the Moderate Resolution Imaging Spectroradiometer (MODIS) and the Advanced Very High Resolution Radiometer (AVHRR). Over the past decade (2000–10), an expanded length of the growing season (LOS) was detected by MODIS, largely due to an earlier start of the growing season (SOS) by 4.7 days per decade and a delayed end of the growing season (EOS) by 1.6 days per decade over the northern high latitudes. There were significant differences between North America and Eurasia in phenology from 2000 to 2010 based on MODIS data (SOS: df = 21, F = 49.02, p < 0.0001; EOS: df = 21, F = 49.25, p < 0.0001; LOS: df = 21, F = 79.40, p < 0.0001). In northern America, SOS advanced by 11.5 days per decade, and EOS was delayed by 2.2 days per decade. In Eurasia, SOS advanced by 2.7 days per decade, and EOS was delayed by 3.5 days per decade. SOS has likely advanced due to the warming Arctic during April and May. Our results suggest that in recent decades the longer vegetation growing seasons can be attributed to more advanced SOS rather than delayed EOS. AVHRR detected longer LOS over the past three decades, largely related to delayed EOS rather than advanced SOS. These two datasets are significantly different in key phenological parameters (SOS: df = 17, F = 14.63, p = 0.0015; EOS: df = 17, F = 38.69, p < 0.0001; LOS: df = 17, F = 16.47, p = 0.0009) from 2000 to 2008 over the northern high latitudes. Thus, further inter-calibration between the sensors is needed to resolve the inconsistency and to better understand long-term trends of vegetation growth in the Arctic.
1. Introduction
Over the past two decades, temperatures over the northern hemisphere have risen by about 1.1 °C in spring and 0.8 °C in autumn (Mitchell and Jones 2005). In addition, precipitation has changed substantially with some areas becoming wetter while others became drier (de Beurs and Henebry 2008). Phenology represents the seasonal dynamics of vegetation, and changes in phenology are likely indicators of local and regional climate change (Menzel et al 2006). A linear response of vegetation phenology to global warming has been reported (Parmesan and Yohe 2003). Moreover, vegetation phenology can affect water and energy exchange between the land and the atmosphere. Thus, an understanding of changes of phenology in response to climate can help us better predict future ecosystem dynamics.
Arctic tundra ecosystems are very sensitive to temperature shifts (Arft et al 1999, Chapin et al 2000, Hinzman et al 2005) and play an important role in ecosystem feedbacks to global climate (Levis et al 1999, Chapin et al 2005). Several previous studies have reported increased vegetation greenness over the northern high-latitude region over the past 20–30 years (Bunn et al 2007, Jia et al 2009, Bhatt et al 2010). Phenological changes on the north slope of Alaska could have substantial impacts on the regional climate system due to reduced albedo leading to warmer air temperatures (Chapin et al 2005). Warmer air temperatures in turn could lead to further changes in vegetation, snow and sea ice, and potential positive feedbacks for continued warming.
Vegetation phenology over the northern high latitudes during the 1980s and 1990s has been widely examined. Most studies found advanced start of season (SOS) and delayed end of season (EOS) either from field measurements (Menzel 2000, Ho et al 2006) or from satellite observations (Myneni et al 1997, Zhou et al 2001, Tucker et al 2001, Goetz et al 2005, Jia et al 2009). Previous studies indicated that SOS had advanced by 0.2–8 days per decade, and EOS had been delayed by 0.5–6.1 days per decade, and, therefore, the length of the growing season (LOS) increased by 0.6–14 days per decade over northern high latitudes (table 1). However, fewer articles focus on the trends of vegetation phenology after 1999. In addition, compared to the last decades of the twentieth century, the warming trends (Cane 2010) and greening trends (Buermann et al 2007) may have slowed down during 2000–10. Reduction of uncertainties in our knowledge of phenological trends over the last decade is therefore a crucial issue for understanding the trajectories for both climate and vegetation.
Table 1. Previously reported changes of vegetation phenology (days per decade) from long-term satellite data over northern high latitudes.
| Shift | ||||||
|---|---|---|---|---|---|---|
| Reference | Period | Data | Region | Start | End | Length |
| (Myneni et al 1997) | 1981–91 | AVHRR | ≥ 40°N | − 8 | 12 | |
| Zhou et al (2001) | 1981–99 | AVHRR | Eurasia | − 3.3 | 6.1 | 13.3 |
| Zhou et al (2001) | 1981–99 | AVHRR | North America | − 4.4 | 2.2 | 6.7 |
| Tucker et al (2001) | 1982–91 | AVHRR | 45°N–75°N | − 6.2 | 4.4 | |
| Tucker et al (2001) | 1992–9 | AVHRR | 45°N–75°N | − 2.4 | 0.6 | |
| Stockli and Vidale (2004) | 1982–2000 | AVHRR | Europe | − 6 | 4.7 | 10.7 |
| Chen et al (2005) | 1982–93 | AVHRR | China | 14 | ||
| de Beurs and Henebry (2005) | 1985–99 | AVHRR | North America | − 6.6 | ||
| de Beurs and Henebry (2005) | 1985–2000 | AVHRR | Eurasia | − 4.5 | ||
| Piao et al (2006) | 1982–99 | AVHRR | China | − 7.9 | 3.7 | 11.6 |
| Julien and Sobrino (2009) | 1982–2003 | AVHRR | Global | − 3 | 0.5 | 3.8 |
| Jeong et al (2011) | 1982–99 | AVHRR | Northern Hemisphere | − 3.1 | 2.5 | 5.6 |
| Jeong et al (2011) | 2000–8 | AVHRR | Northern Hemisphere | − 0.2 | 2.6 | 2.8 |
Optical sensors have been used to calculate vegetation indices to study phenology; one way has been by developing normalized difference vegetation index (NDVI) time series. Most previous studies on satellite derived phenology have been driven by time series of Advanced Very High Resolution Radiometer (AVHRR) data, while Moderate Resolution Imaging Spectroradiometer (MODIS) (de Beurs and Henebry 2008, Liang et al 2011) and Medium Resolution Imaging Spectrometer (MERIS) data (Pouliot et al 2011) have not been widely used, possibly due to the limit in the temporal coverage of the data, in analyzing vegetation phenology, especially over high latitudes. However, inter-calibration or validation using different data sources could be very helpful for reducing uncertainty. Recent advances in satellite remote sensing and accumulation of multi-sensor satellite time series have made it possible to get a much clearer picture of the recent trends of vegetation phenology, particularly in remote Arctic regions, where field measurements are rare due to logistical difficulties. Kawamura et al (2005) compared the MODIS-NDVI and AVHRR-NDVI time series and found that the MODIS-NDVI temporal profile had a higher accuracy in capturing seasonal changes in grassland areas. Gao et al (2003) compared MODIS composite NDVI values with single date NDVI values from several sensors and found good agreement with respect to phenology of the land covers examined. Thus, it is crucial to make use of data from different sensors and compare the differences for monitoring changes in vegetation phenology.
In this letter, we examine the temporal trends and spatial variability of growing season dynamics in the high-latitude region over the past three decades, with focus on the most recent decade (2000–10). We analyze the trends of vegetation phenology of the northern high-latitude region (≥60°N) based on a comparison of 27 years of AVHRR data (1982–2008) and 11 years of MODIS data (2000–10). The following key scientific questions arise. (1) How has vegetation phenology shifted in northern high-latitude regions? (2) What are the differences in phenological dynamics among different bioclimate subzones and data from different sensors? (3) Are there any differences in phenology between last two decades of the 20th century and the most recent decade?
2. Data and methods
2.1. Multiple satellite time series
MODIS and AVHRR satellite time series were used to detect key phenological parameters at relatively high temporal resolution and coarse-to-moderate spatial resolution. AVHRR data were acquired by the NOAA satellite series and processed by the NASA Global Inventory Monitoring and Modeling Systems (GIMMS) group with a spatial resolution of 8 km × 8 km and a temporal resolution of 15 day maximum value composites from 1982 to 2008 (Bhatt et al 2010). The data details on AVHRR GIMMS can be found in Tucker et al (2005) and Bhatt et al (2010). MODIS offers a shorter temporal extent but a more comprehensive data source for phenological study largely due to its higher resolution and improved onboard calibration. The MODIS sensors onboard NASA's Terra and Aqua satellites observe the entire Earth's surface twice per day, continuously providing information on land surface properties.
We selected a global MODIS product, MOD13C1 (collection 5), at a 0.05° spatial resolution and a 16 day temporal resolution from 2000 to 2010. The MODIS-NDVI product has been atmospherically corrected from bi-directional surface reflectance, and masked for water, clouds and shadows.
NDVI was calculated from visible (R: 0.58–0.68 μm) and near-infrared (NIR: 0.73–1.10 μm) wavelengths using the equation NDVI = (NIR − R)/(NIR + R). NDVI is considered to be directly related to the photosynthetic capacity and hence energy absorption of plant canopies, i.e., healthy vegetation, and sparsely vegetated and bare surfaces, absorb different amounts of visible light and reflect different amounts of NIR. Therefore, NDVI is considered to be an indicator of the quantity of green vegetation (Tucker 1979). Here, the time series of NDVI derived from satellite reflectance data were used to calculate key vegetation phenological variables.
2.2. Data quality control
The cloud filtering function of the maximum value composition (MVC) was applied to both the MODIS data and the AVHRR time series; however, there is still some cloud contamination existing in some cases (Jia et al 2006). To further eliminate errors caused by cloud contamination and sensor bias, we applied the TIMESAT algorithm for smoothing and reconstructing the NDVI time series. There are three smoothing functions available in TIMESAT software: adaptive Savitzky–Golay filtering, asymmetric Gaussian and double logistic. Both asymmetric Gaussian and double logistic approaches use semi-local methods and can make good descriptions of SOS and EOS. Both approaches in the TIMESAT program produced similar results (Gao et al 2008); we chose the double logistic function for data smoothing, since it performs slightly better in high latitudes than the other two approaches. This is a substantial advantage considering missing data or poor quality data due to snow contamination over the high latitudes.
2.3. Determination of phenological parameters
Generally, there are four methods for determining the dates of SOS, EOS and LOS from NDVI time series: thresholds, derivatives, smoothing functions and fitting models (de Beurs and Henebry 2010). In our study, we used thresholds, since they are considered the simplest and most effective method for phenological study (de Beurs and Henebry 2010). The thresholds of NDVI values for active vegetation growth vary from biome to biome (Reed et al 1994), however the threshold NDVI value 0.09 has been used to define SOS and EOS over the high-latitude region (Reed et al 1994, Jia et al 2004). Here we set NDVI = 0.09 as the threshold in TIMESAT to explore and extract seasonality parameters from remotely sensed time-series data. Phenology parameters including SOS, EOS LOS, MaxNDVI (peak NDVI in a given year) and peak-t (the date when NDVI reaches maximum in a given year) were analyzed in our study. We focused on the high-latitude region (≥60°N) and discarded problematic data (where the largest NDVI value for the year was very low (<0.1)) and replaced them with inter-annual mean values.
2.4. Statistical analysis
Various environmental factors, including air temperature, snow and soil moisture may control vegetation phenology. However, vegetation growth in northern high-latitude regions is considered primarily warmth limited and can respond to temperature change on a relatively short time scale (Arft et al 1999, Chapin et al 2000). Spring temperatures are important for early season vegetation growth and subsequent productivity, and can therefore control several phenological parameters (Chapin et al 2000, Piao et al 2006, Jeong et al 2011). Meanwhile, late season temperatures are likely the main controls over EOS. Thus, we chose mean preseason temperature data to evaluate the impacts of temperature on vegetation phenology. Correlation coefficients (r) between SOS and mean temperatures in March, April and May, and correlation coefficients between EOS and mean temperatures in August, September and October were calculated using spatial datasets of temperature derived from National Centers for Environmental Prediction/National Center for Atmospheric Sciences (NCEP/NCAR) (Kalnay et al 1996) reanalysis and MODIS land surface temperature.
Radiometric skin temperature may not well represent near-surface air temperature; therefore we used both land surface temperature data and near-surface air temperature data to evaluate the thermal conditions. Biweekly series of NDVI anomalies were correlated with both MODIS land surface temperature data (MOD11C2) and the NCEP air temperature reanalysis dataset. These data from NCEP/NCAR have been widely used to study phenology (Brown and de Beurs 2008, Prince et al 2009), based on their good agreement with in situ observations (Kalnay et al 1996, Adler et al 2003). Pixels with correlations of |r| > 0.5 were highlighted in our spatial datasets.
To evaluate the trends of phenology during a given period, least-squares linear regressions were applied in statistical analyses. One-way analysis of variance (ANOVA) was used to test differences in our study.
3. Results
3.1. Spatial patterns of key phenological parameters
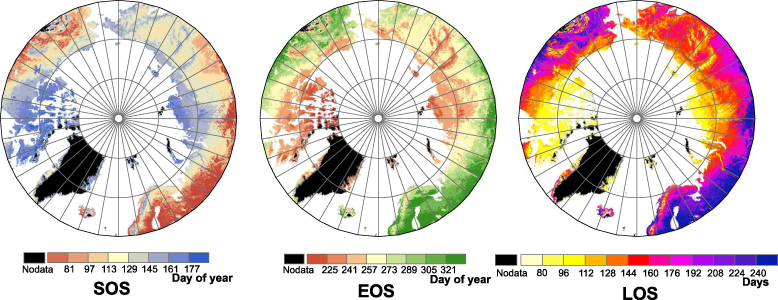
The spatial distributions of the phenological parameters SOS, EOS and LOS over northern high-latitude regions were summarized from 2000 to 2010 based on the MODIS data (figure 1). The SOS date ranged widely from approximately 22 March in the south to approximately 13 July in the north. Vegetation turned green much earlier in the southern low Arctic than in the high Arctic, following the patterns of spring temperatures. The SOS in western Eurasia was much earlier than in any other region of the same latitude. The EOS date ranged from approximately 12 August to approximately 17 November. The LOS value over the region ranged from 80 days to 240 days. Overall, there were very similar spatial patterns between SOS and EOS throughout the region. Compared to other areas in the region, East Asia and Europe had earlier SOS and later EOS, and thus a longer LOS.
Figure 1. Spatial distributions of the mean SOS, EOS, and LOS in the northern high latitudes during the period 2000–10. The results are based on averaging of 11 yr MODIS data. Non-vegetated pixels were marked as 'Nodata'.
Download figure:
Standard image3.2. Phenological changes over the northern high-latitude region
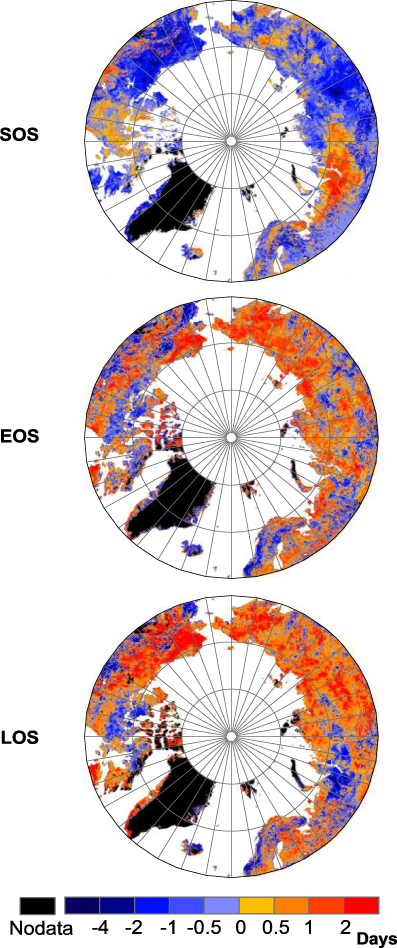
There were clear temporal variations of phenological parameters including SOS, EOS and LOS as seen from the MODIS data (figure 2). For the phenological parameters SOS and EOS, positive and negative trends refer to later and earlier dates, respectively, and longer LOS is considered a positive trend. From 2000 to 2010, most of the high-latitude regions experienced advanced SOS, with exceptions being northwestern Siberia and northeastern North America. Most of Asia and parts of western and central North America experienced obvious delayed EOS. Thus, western Eurasia and eastern North America had smaller increases, or even declines, in length of growing season compared to other areas.
Figure 2. Spatial patterns of the linear trends in SOS, EOS and LOS from 2000 to 2010 based on MODIS data. Positive values (warm colors) indicate later onset (SOS), later finish (EOS) and longer duration (LOS) of the growing season.
Download figure:
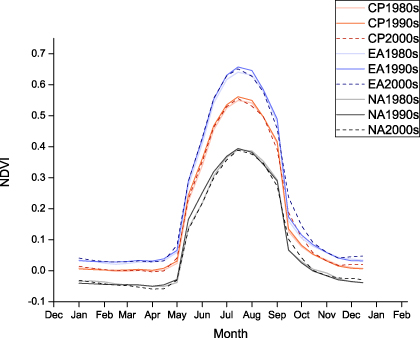
Standard imageTo further investigate the changes of phenological parameters over the last three decades, we analyzed and summarized decadal NDVI for the circumpolar Arctic, Eurasia and North America, based on AVHRR GIMMS3g time series (figure 3). Over the last three decades, Eurasia experienced earlier SOS, while a similar trend did not occur in North America. Delayed EOS and longer LOS were found across the northern high latitudes. MaxNDVI values in the 1990s were generally greater than those in the 1980s and 2000s.
Figure 3. Variations of area-averaged NDVI per decade over the circumpolar Arctic (CP: red lines), Eurasia (EA: blue lines) and North America (NA: black lines) from 1982 to 2010 based on AVHRR data. 1980s (thick lines) refers to 1982–9; 1990s (thin lines) refers to 1990–9; 2000s (dashed lines) refers to 2000–8.
Download figure:
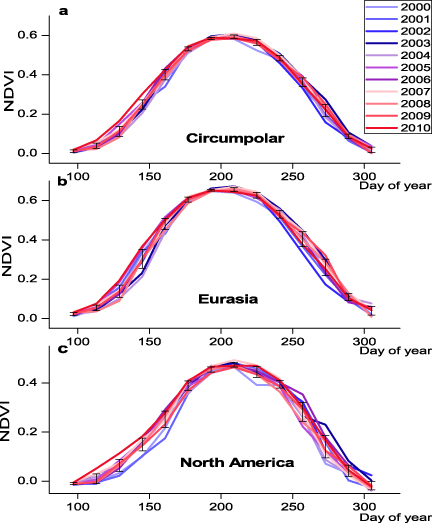
Standard imageTo analyze shifts in these phenological parameters over the entire region, we summarized inter-annual variations of the average SOS, EOS and LOS during 2000–10 based on the MODIS time series (figure 4). During this period, SOS advanced throughout most of the region (figure 4). Positive EOS and LOS anomalies indicated delayed senescence and a longer growing season since 2000. We analyzed the satellite time series over North America and Eurasia separately to examine variations in phenology related to disparate continental features (figure 4). There was generally a more rapid green-up in spring (about 15.2 days), a significantly later EOS in autumn (about 13.6 days) and a significantly greater MaxNDVI (about 0.2) over Eurasia than North America. Both North America and Eurasia experienced their earliest SOS in 2010, based on MODIS data from 2000 to 2010 (figure 4). NDVI has reached its peak earlier in Eurasia since 2000, while there were fewer shifts in North America (about 5.8 days).
Figure 4. Intra-seasonal variations of area-averaged NDVI based on MODIS data from 2000 to 2010 over the study area: (a) circumpolar, (b) Eurasia and (c) North America. Error bars represent 1 SEM.
Download figure:
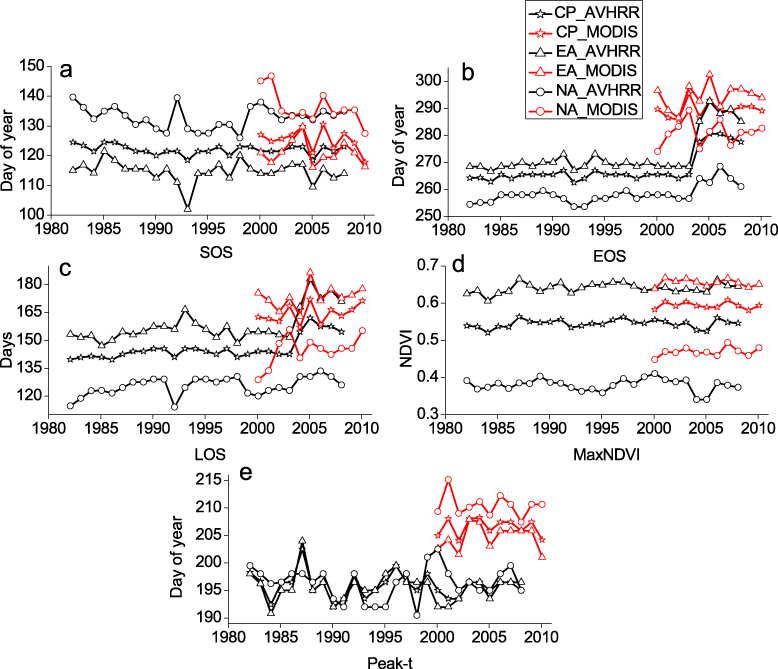
Standard imageWe compared the phenological parameters based on the AVHRR data with those derived from MODIS data to examine their agreement (figure 5). Based on AVHRR data from 1982 to 2008, SOS advanced across the northern high latitudes (table 2); EOS was sharply delayed by 4.9 days per decade and LOS became longer. Similar trends were observed over Eurasia and North America. North America experienced advanced SOS in the 1980s and 1990s; however, the trend of earlier SOS has ceased since 1999. Based on MODIS (table 2), the linear trends of SOS during 2000–10 were negative at 4.7 days per decade. A positive trend of EOS was observed, with a delay of 1.6 days per decade. Differences of the three phenological parameters between North America and Eurasia were all significant from 2000 to 2010 (SOS: d f = 21, F = 49.02, p < 0.0001; EOS: d f = 21, F = 49.25, p < 0.0001; LOS: d f = 21, F = 79.40, p < 0.0001). In North America, SOS advanced by 11.5 days per decade and EOS was delayed by 2.2 days per decade; in Eurasia, SOS advanced by 2.7 days per decade and EOS was delayed by 3.5 days per decade (table 2). Thus, the magnitudes of SOS and EOS shifts detected from different sensors were apparently quite different; however the general trends of phenological shifts were similar since 2000. And, we could find that there were significant differences in key phenological values (SOS: d f = 17, F = 14.63, p = 0.0015; EOS: d f = 17, F = 38.69, p < 0.0001; LOS: d f = 17, F = 16.47, p = 0.0009) from 2000 to 2008 between these two datasets over the northern high latitudes.
Figure 5. Inter-annual variations of area-averaged (a) SOS, (b) EOS, (c) LOS, (d) MaxNDVI (peak greenness) and (e) Peak-t (date of peak greenness) over circumpolar, Eurasian and North American high latitudes based on MODIS data (red lines, 2000–10) and AVHRR data (black lines, 1982–2008).
Download figure:
Standard imageTable 2. Shifts of phenology parameters (days per decade) based on AVHRR and MODIS. Asterisks indicate the significance levels of the correlations. (Note: *p < 0.05, ∗∗ p < 0.01.)
| MODIS | AVHRR | |||||||||||
|---|---|---|---|---|---|---|---|---|---|---|---|---|
| Arctic | Eurasia | America | Arctic | Eurasia | America | |||||||
| Phenological parameter | Shift | r2 | Shift | r2 | Shift | r2 | Shift | r2 | Shift | r2 | Shift | r2 |
| SOS | −4.7 | 0.17 | −2.7 | 0.04 | −11.5* | 0.45 | −0.5 | 0.06 | −0.8 | 0.03 | −0.3 | 0 |
| EOS | 1.6 | 0.03 | 3.5 | 0.07 | 2.2 | 0.03 | 4.9** | 0.47 | 6.4** | 0.44 | 2.7** | 0.39 |
| LOS | 6.3 | 0.17 | 6.2 | 0.09 | 13.6* | 0.31 | 5.4** | 0.50 | 7.2** | 0.40 | 2.9 ** | 0.23 |
| MaxNDVI | 0 | 0.01 | 0 | 0.02 | 0 | 0.14 | 0 | 0.03 | 0 | 0.09 | 0 | 0.01 |
| Peak_t | −0.3 | 0.01 | 0.5 | 0.01 | −0.3 | 0.01 | −0.4 | 0.02 | −0.2 | 0 | −0.1 | 0 |
3.3. Temperature control over phenology
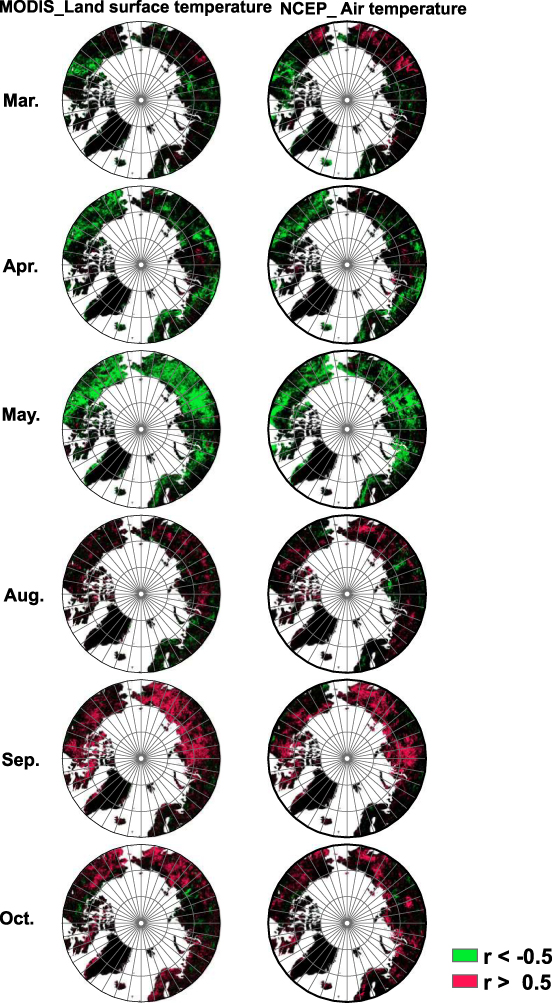
In order to understand pre-growing season shifts in temperature related to phenological variations, correlation coefficients were calculated over the region from 2000 to 2010 based on MODIS-NDVI, thermal infrared land surface temperature and NCEP reanalysis data (see figure 6). The correlation patterns based on temperature variables derived from the MODIS data and NCEP data were similar (figure 6). Temperatures in April had negative correlations with SOS over certain parts of the region. Temperatures were negatively correlated with SOS variations greatly in May, ahead of the time of SOS (figure 6), which might indicate that green-up of Arctic tundra is highly sensitive to changes in May temperature. Temperatures in September and October had strong positive correlations with EOS over large areas of the region (figure 6). However, the phenological parameters and temperatures in March and August were not strongly correlated. The phenological parameters in southwestern Eurasia showed very weak correlations with temperature, indicating potentially more complex controls over vegetation phenology.
Figure 6. Spatial distributions of statistical correlations between temperature and SOS in March, April and May, and between temperature and EOS in August, September and October. The temperature data were based on MODIS thermal infrared land surface temperature and NCEP reanalysis. Here, r > 0.5 (red areas) and r <− 0.5 were used to show relatively strong positive and negative correlations.
Download figure:
Standard image4. Discussion
4.1. Phenology trends as seen by different datasets
Multi-sensor data were used to analyze vegetation phenology in northern high latitudes from 1982 to 2010. SOS advanced in the 1980s and 1990s, but the advancing trends did not continue after 1999 as seen in the AVHRR GIMMS time series. Such patterns have been documented in AVHRR based studies (Jia et al 2009, Jeong et al 2011). However, the MODIS data suggest that SOS continuously advanced from 2000 to 2010. Delayed EOS since 2000 was detected by both the AVHRR and MODIS data; however, there was no obvious change of EOS before 1999 based on the AVHRR data (figure 5). Overall, there have been increases in LOS over the past 30 years in the region based on integration of AVHRR and MODIS data, as a result of long-term changes in SOS and EOS. From the AVHRR data, over the last three decades, the phenological parameters were similar between North America and Eurasia. In contrast, from the MODIS data, Eurasia had an earlier SOS, later EOS and greater NDVI values than North America in the most recent decade.
Almost all previous articles have reported earlier SOS and lengthening of the growing season in the region (Jia et al 2006, Julien and Sobrino 2009). Our study found similar trends but much more detail with multi-sensor datasets. Most previous studies have indicated trends of earlier SOS by 0.2–8 days per decade and later EOS by 0.5–6.1 days per decade with increasing LOS by 0.6–14 days per decade (table 1). However, the magnitudes of the phenological trends have differed dramatically, largely due to differences in datasets and scales (Walther et al 2002), and differing definitions of phenological parameters. Our results indicate that SOS advanced by 4.7 days per decade and EOS was delayed by 1.6 days per decade based on MODIS data since 2000. In our study, over the high-latitude region, the earlier SOS was detected from 2000 to 2010, whereas delayed EOS signals were not clear from the MODIS data. In contrast, our study and previous studies have shown that the earlier SOS signals from 1982 to 1999 were weakened in the 2000s, with delayed EOS, mainly from AVHRR data (Yu et al 2010, Jeong et al 2011).
The possible reasons for the different patterns and trends of phenological parameters between MODIS and AVHRR data may be the following. (1) MODIS and AVHRR have different bandwidths associated with the red and NIR bands used to compute NDVI. The MODIS red (620–670 nm) and NIR (841 to 876 nm) bands are much narrower than the AVHRR red (585–680 nm) and NIR (730–980 nm) bands, resulting in more sensitive values of NDVI. (2) Four different AVHRR sensors (NOAA-14, NOAA-16, NOAA-17 and NOAA-18) were used over the last decade with different equator passing times (morning and afternoon satellites are combined) and varying degrees of orbital drift (Tucker et al 2005), which may cause major inconsistency despite the post-calibration. (3) Compared with AVHRR, MODIS has improved onboard geometric and radiometric calibrations. Fontana et al (2008) investigated the phenology in alpine grasslands using AVHRR data, SPOT VEGETATION (VGT) data, and MODIS data, and found that the newer generation sensors VGT and MODIS performed better than AVHRR. MODIS data were considered an improvement over AVHRR, and these products in theory provided a possibility to evaluate NDVI time series for overlapping periods. Therefore, AVHRR data are considered as an important data source for temporal extents from 1981 to present, whereas MODIS data could help improve phenological studies for the most recent decade.
4.2. Climate controls over phenology
Cane (2010) found that the strong warming over the last two decades of the twentieth century had paused after 2000 at the global scale. In contrast, temperatures in the northern high-latitude region have still increased over the past several decades (Kaufman et al 2009). Bhatt et al (2010) found that North America has experienced more remarkable warming (+30% summer warmth index − sum of mean monthly temperatures >0 °C) than Eurasia ( + 16%) during 1982–2008. A warmer spring could easily trigger earlier snow melt, thaw of topsoil and germination of early spring plants, making the signal of spring vegetation visible from satellites earlier in the year (Parmesan and Yohe 2003, Richardson et al 2006, Jeong et al 2009, Yu et al 2010). Our study indicates that the warming in the period 2000–10 was associated with advanced SOS of an even larger magnitude than the SOS trends of the 1980s and 1990s. Furthermore, statistically significant positive correlations were found between September temperature and EOS (p < 0.05). The possible reason is that increases in late season temperature may delay senescence of many deciduous plant species and possibly snow fall. More importantly, higher temperatures during the vegetation growing season can cause greater peak greenness and possibly earlier peak.
A decrease by 1.8 ± 1.7 days per decade in snow cover has been found in tundra ecosystems based on satellite data (Smith et al 2004). A continuous decline of snow cover has been projected and could eventually result in 40–80% fewer days with snow in Europe by the end of this century (Jylha et al 2008), which would strongly influence the onset of vegetation greenness in the tundra biome and is generally expected to influence biomass production (Rustad et al 2001). Less snow cover and accelerated thaw of topsoil in the springtime will likely lead to earlier SOS and a greater fraction of green vegetation in contrast to white snow in a given pixel. Meanwhile, fractional snow fall can influence land surface phenology detected by satellite sensors. The satellite derived trends of advanced SOS would cease if there were major fluctuations in snow fall in spring and early summer in northern high latitudes, as the snow can cover vegetation and prevent it from being detected by satellites.
Winter processes have been documented to be important in determining plant productivity and performance in the forthcoming growing season in the Arctic and alpine ecosystems (Jonas et al 2008). Continued warming in the winter might lead to a later fulfilment of plant chilling requirements, which could result in delayed SOS (Yu et al 2010). Meanwhile, a brief extreme warming event in winter–spring can cause earlier melt of snow and expose ecosystems to cold air temperatures, thereby damaging buds and influencing leaf and flower phenology (Bokhorst et al 2008).
4.3. Implications of phenology change
The main results presented here could be used to evaluate inter-annual vegetation growth and carbon budget, especially over the most recent decade. Changes in the timing of SOS and EOS can change CO2 source/sink balance, resulting in amplitude changes in atmospheric CO2 concentrations (Schaffer et al 2005, Piao et al 2007). Temperature increases over the northern high latitudes can also potentially lead to a longer growing season, and, therefore, to an enhanced terrestrial carbon sink, and thus diminish the rate of atmospheric CO2 accumulation, which has been proposed as a mechanism to reduce the rate of further warming. Moreover, gross primary production (GPP) and net ecosystem production (NEP) are closely related to growing season dynamics and are key factors in the terrestrial carbon budget (Piao et al 2007). A positive relationship between LOS and NEP in a boreal deciduous forest has been reported (Black et al 2000). Richardson et al (2009) suggested that a one-day advance in spring onset could increase springtime NEP by 2–4 g C m−2 day−1. Baldocchi et al (2001) showed that, across a range of temperate deciduous sites, a one-day increase in growing season length may increase annual NEP by 5.7 g C m−2. Thus, phenological shifts can influence the carbon budget in ecosystems in the northern high latitudes (Nemani et al 2002, Piao et al 2007). However, the ecological mechanisms involved in the contribution of a longer growing season to NEP in northern ecosystems are far from clear.
Possible increases in the length of the vegetation growing season, either through earlier onset or later EOS, could have major impacts on the life of indigenous people and reindeer herding systems in the north, because reindeer could have more time grazing on tundra. Determination of the impact of phenological shifts in tundra vegetation on human society remains a challenge for further studies.
5. Conclusions
Over the past few years a range of studies have investigated phenological change with satellite imagery. However, a lack of multi-sensor dataset integration and comparison is likely one of the major sources of uncertainties in phenological study, especially in the northern high-latitude region.
Based on MODIS- and AVHRR-NDVI biweekly time-series data and MODIS temperature information, we estimated that LOS significantly lengthened during the past three decades over the high-latitude region, through earlier SOS and later EOS. The lengthening of the growing season was largely attributed to climate warming in recent decades at global and regional scales. The correlation coefficients between phenology parameters and temperature in preseason months were strong over many areas. Higher temperatures in May and September may bring about advanced SOS and delayed EOS, respectively. Phenological shifts also may feed back to the warming in various ways.
Over the last two decades of the twentieth century, the responses of vegetation growth to climate change seem straightforward, with increasing temperatures causing increased NDVI, earlier SOS and delayed EOS. Recently, however, a number of new studies indicate more complex trends of vegetation productivity due to increases in disturbances partly exacerbated by climate change, such as insect defoliation and fires (Westerling et al 2006, Kurz et al 2008). Also, previous studies have reported complex and even conflicting results on the trends of vegetation phenology in the north, i.e., whether or not the trends of earlier SOS and later EOS detected over the 1980s and 1990s still continued throughout the 2000s. Our results show that the opposite trends of phenology reported by various authors at continental scales were largely due to differences in data sources and scales. Complex changes in different areas are likely due to different climate regimes and disturbances. Clearly, a better understanding of decadal phenological changes of the northern high latitudes vegetation can only be achieved by integration of various reliable spatial datasets.
Acknowledgments
This study was supported by the National Basic Research Program of China (No. 2009CB723904), the Natural Science Foundation of China (NSFC No. 41176168) and the National Science Foundation of the US (ARC-0902152). We thank the NASA GIMMS team for providing the most up to date AVHRR GIMMS3g dataset.
