Abstract
A Landsat-based humid tropical forest disturbance alert was implemented for Peru, the Republic of Congo and Kalimantan, Indonesia. Alerts were mapped on a weekly basis as new terrain-corrected Landsat 7 and 8 images were made available; results are presented for all of 2014 and through September 2015. The three study areas represent different stages of the forest land use transition, with all featuring a variety of disturbance dynamics including logging, smallholder agriculture, and agroindustrial development. Results for Peru were formally validated and alerts found to have very high user's accuracies and moderately high producer's accuracies, indicating an appropriately conservative product suitable for supporting land management and enforcement activities. Complete pan-tropical coverage will be implemented during 2016 in support of the Global Forest Watch initiative. To date, Global Forest Watch produces annual global forest loss area estimates using a comparatively richer set of Landsat inputs. The alert product is presented as an interim update of forest disturbance events between comprehensive annual updates. Results from this study are available for viewing and download at http://glad.geog.umd.edu/forest-alerts and www.globalforestwatch.org.
Original content from this work may be used under the terms of the Creative Commons Attribution 3.0 licence. Any further distribution of this work must maintain attribution to the author(s) and the title of the work, journal citation and DOI.
Introduction
Research on remote sensing-based land change is focused on providing relevant and accurate information on dynamics impacting the functioning of human and natural land systems. To date, much of this research has concerned demonstrating accurate quantification of land change through improved algorithms and data inputs. As methods mature and are proven to work at scale, they can be implemented within operational monitoring programs. Operational land change mapping methods, in contrast to research, have additional objectives of systematic data set production within a fixed product delivery schedule. The standards for operational implementation of land monitoring products are high, as methods must be repeatable over time while maintaining high product fidelity. Operational monitoring is also typically implemented over large areas, such as national scales. Examples include the Brazilian Space Agency's (INPE) annual deforestation PRODES map product for the Amazon rainforest and the United States Department of Agriculture's Cropland Data Layer, an annual crop type map for the conterminous United States. Such products support national statistical reporting programs and their generation typically correlates with a seasonal dynamic, such as dry season burning or growing season cultivated area. Another operational application is near-real time alerts, which are employed in a variety of modes; examples include illegal deforestation monitoring in Brazil with the Real-Time System for Detection of Deforestation (DETER) (Shimabukuro et al 2012), tropical forest disturbance with FORest Monitoring for Action (FORMA) (Hammer et al 2014), near-real time global flood mapping (Brakenridge and Anderson 2006), and active fire monitoring with the Fire Information for Resource Management System (FIRMS) (Davies et al 2009). Vegetation indices are used in near-real time mode to monitor food security with the Famine Early Warning System (FEWS) (Ross et al 2009), and drought with the United States National Drought Monitor (Svoboda et al 2002). In some cases, such as with the official MODerate resolution Imaging Spectroradiometer (MODIS) active fire algorithm (Giglio et al 2003), national agencies are able to implement algorithms directly for local decision support activities. Another source of near-real time earth observation data concerns the coordinated tasking of international earth observing assets in response to a documented natural disaster or hazard, as with the International Charter on Space and Major Disasters initiative (Bessis et al 2004). Such systems are event-based with imagery as the deliverable and no associated derived land characterization product.
Operational alert systems can be signal or theme-based. Signal based means the use of a radiometric measure, such as greenness or brightness temperature, as the primary observational input to the alert system. Signal-based alerts have enhanced meaning when coupled with reference data, such as an anomalously low normalized difference vegetation index (NDVI) Tucker 1979) value over a core crop growing region, or an active fire brightness temperature within a forest. Theme-based means the characterization of a specific land cover change dynamic, such as forest cover loss, i.e. the removal of tree cover, or flooding, i.e. an increase in the expanse of surface water beyond the norm.
Most alert systems employ high temporal, coarse spatial resolution data sets such as MODIS or Visible Infrared Imaging Radiometer Suite (VIIRS) data. Such systems have near-daily coverage that fulfills the near-real time requirement for many monitoring applications, given good atmospheric conditions. The main limitation of MODIS and like sensors as a source of near-real time land change is its coarse spatial resolution. However, for many land applications, MODIS' spatial resolution is sufficient. For example, drought monitoring systems often employ a composite index that incorporates MODIS NDVI to quantify short-term and long-term impacts of regional-scale drought (Svoboda et al 2002). Conversely, applications such as forest loss detection are limited by MODIS' coarse spatial resolution, as many human-induced forest disturbances are fine-scaled. In annual mapping of forest loss, Hansen et al (2012) showed MODIS to detect only 50% of the area of forest disturbance detected by Landsat which has a 30 m spatial resolution.
Improving the cadence of medium or high spatial resolution data delivery would offer an improved capability for a number of alerting applications. Since the opening of the Landsat archive in 2008 (Woodcock et al 2008), medium spatial resolution data have been available for use in alert-based applications and several studies on dense time-series change analyses reported (Cohen et al 2010, Potapov et al 2012, Zue et al 2012, DeVries et al 2015). Since 2013, two Landsat sensors, the Enhanced Thematic Mapper Plus (ETM+) onboard Landsat 7, and the Operational Land Imager (OLI) onboard Landsat 8, have been systematically acquiring global multi-spectral observations at a 30 m spatial resolution. The orbits of the two spacecraft are coordinated to enable potential 8 day repeat coverage globally. Given this cadence, Landsat is a viable source for land change alerting systems. In this paper, we report on the use of Landsat ETM+ and OLI data in quantifying humid tropical forest disturbance using the most recent single land observation. The approach is theme-based, similar to that of DETER, but implemented at 30 m and quantifying all forest loss, not just loss within intact forests. We defined forest cover as 5 m tall trees with a canopy closure exceeding 60%. An alert is defined as any Landsat pixel that experiences a canopy loss in excess of 50% cover. The initial alert product, similar to the global forest cover loss product, does not distinguish human-induced from natural forest disturbances, nor deforestation from forestry land use dynamics.
This alerting system is meant to complement a current annual global forest cover loss product, implemented in collaboration with Google and World Resources Institute as part of Global Forest Watch. The annual product is based on a calendar year update, first prototyped using Landsat 7 data from 2000 through 2012 (Hansen et al 2013) and annually updated for 2013 and 2014 (http://globalforestwatch.org/ and http://earthenginepartners.appspot.com/science-2013-global-forest). An interim alert system would provide forest disturbance updates as observed, with the objective of providing a conservative change detection system absent of errors of commission. In other words, the alert system would not provide area estimates. This is similar to the complementary DETER and PRODES deforestation mapping products of INPE. The 250 m MODIS-derived DETER product's near-real time information is not used to calculate deforestation area, but is used as an enforcement tool in controlling illegal deforestation. The Landsat-derived PRODES product, produced on an annual basis, is the official area estimation of deforestation.
The potential uses of medium spatial resolution forest loss alerts range from enforcement to management applications. Monitoring road building, logging, clearing for agriculture and other dynamics can have added value if reported in near-real time. In particular, the humid tropical forest biome offers a valuable environment for implementing and assessing the value of such an alerting system. Humid tropical forests are under threats of conversion to higher order land uses, with deleterious impacts on climate, water and biodiversity (Foley et al 2005). Efforts to identify the last intact forest landscapes (Potapov et al 2008) and to systematically map protected areas (UNEP-WCMC 2015) can serve as references for forest disturbance alerting systems. The DETER alerts of Brazil have been critical to increasing the capacities of law enforcement and land management agencies in reducing illegal deforestation in the Brazilian Amazon (Nepstad et al 2014). The deployment of such a system pan-tropically, with significantly higher spatial detail, will offer such possibilities to other countries. We present here a prototype system, applied to humid tropical Peru, Republic of Congo and the portion of Borneo within Indonesia (Kalimantan). The application will be extended pan-tropically and eventually globally, given viable results and support for such a monitoring system within Global Forest Watch.
Study area
Our prototype alerts were implemented for humid tropical Peru, Republic of Congo, and Kalimantan (Indonesia). Indonesia is a high forest, high deforestation rate country. Kalimantan is second among Indonesian island groups in forest cover loss, with increasing conversion of wetlands to palm estates and a considerable tract of intact forest in the center of the island of Borneo. Kalimantan gross forest cover loss has increased by nearly 50% since 2000 with primary forest loss accounting for nearly 40% of overall forest loss (Margono et al 2014). Peru is a high forest, medium deforestation rate country to date, but with a trend towards increasingly high rates of forest conversion consisting of smallholder agriculture, artisanal gold mining and industrial agriculture, mainly palm oil. Since 2000, forest disturbance in Peru has increased by 70% to approximately 200 kha yr−1. Of this total, the area of primary forest loss is nearly double that of secondary forest loss (Potapov et al 2014). The Republic of Congo is a high forest, low deforestation rate country with selective logging and smallholder agriculture being the primary drivers of forest loss. Low demographic pressure and underdeveloped infrastructure limit deforestation to low annual rates compared to more rapidly developing economies. However, agroindustrial change in the form of palm oil estates is now expanding within the Congo and the gross forest disturbance rate has doubled since 2000 to over 60 kha yr−1, with 43% occurring within primary forests. All three study areas include logging, smallholder land uses, and agroindustrial conversions, occurring within different stages of the forest land use transition. By successfully demonstrating the method over these three areas, we believe a pan-humid tropical forest alert system may be readily implemented.
Data
We employed the following Landsat 7 ETM+ bands: bands 3 (red: 0.626–0.693 μm), 4 (near-infrared: 0.776–0.904 μm), 5 (shortwave infrared: 1.567–1.784 μm) and 7 (shortwave infrared: 2.097–2.349 μm); and corresponding bands from Landsat 8 OLI: bands 4 (red: 0.630–0.680 μm), 5 (near-infrared: 0.845–0.885 μm), 6 (shortwave infrared: 1.560–1.660 μm), and 7 (shortwave infrared: 2.100–2.300 μm). Shorter wavelength visible blue and green ETM+ bands 1 and 2 and OLI bands 2 and 3 were not used due to deleterious atmospheric effects on observation quality (Ouaidrari and Vermote 1999). ETM+ band 6 (brightness temperature: 10.40–12.50 μm) and TIRS band 10 (brightness temperature: 10.60–11.19 μm) were used for time-series metric creation (see below), but not as variables in mapping forest cover loss. NDVI (Tucker 1979), normalized burned ratio, NBR (Key and Benson 2006), and normalized difference water index, NDWI (Gao 1996) were also used in generating time-series metrics.
Three steps were implemented to radiometrically normalize all Landsat observations: (1) calculation of top-of-atmosphere reflectance, (2) MODIS-based bias adjustment, and (3) MODIS-based anisotropy adjustment. Each Landsat image was converted to top-of-atmosphere reflectance (Chander et al 2009) and then normalized to spectral reflectance using MODIS top-of-canopy reflectance data composite as a normalization target (Potapov et al 2012). The MODIS reference was made from all 16 day MODIS composites from 2000 through 2011. All composites were ranked by NDVI and an average reflectance value for red, near infrared, and shortwave infrared bands calculated from composites corresponding to 50th–90th percentile ranks. The next step of Landsat image normalization was to apply a Landsat to MODIS bias adjustment which largely accounted for atmospheric scattering. The final step was a cross-track adjustment to account for effects of surface anisotropy. To perform the cross-track adjustment, Landsat to MODIS bias-adjusted spectral reflectance was modeled as a function of sensor view angle per band and the derived relationship applied to all pixels within the image. Our per pixel quality assessment models were applied to the top-of-atmosphere corrected data. Cloud cover, haze, water and shadow were separately identified and used to create a pool of viable land observations which were put through the full radiometric normalization. Radiometric processing methods are outlined in Hansen et al (2008), Potapov et al (2012) and Hansen and Loveland (2012).
The latest observation was added to a four-year reference feature space of Landsat-derived time-series metrics. Metrics are statistical measures derived from a multi-temporal stack of good quality Landsat observations, and have been used to map large areas with AVHRR (Reed et al 1994, DeFries et al 1995), MODIS (Hansen et al 2002, 2005) and more recently Landsat data (Broich et al 2011, Potapov et al 2012, 2015, Hansen et al 2013). Their advantage is the creation of a standard feature space independent of specific time of year or number of input observations. These characteristics allow generic models to be built and applied to large areas, in this case the humid tropical forest biome. Because our prototype product was implemented over humid tropical broadleaf evergreen forests, no seasonal filters were employed.
Metrics used in this study consisted of individual ranks, means and regressions of red, near infrared, both shortwave infrared bands, as well as ranks of normalized ratios of near infrared and red (NDVI), near infrared and shortwave infrared (2.2 μm) (NBR), and near-infrared and shortwave infrared (1.65 μm) (NDWI). Each of these individual measures were also ranked by NDVI, NDWI, and thermal brightness temperature and corresponding ranks and means used as input metrics. Metrics consist primarily of measures derived from all input observations, for example the mean NDVI of all good observations during the study period. Metrics can also be calculated by interval quantile, for example the interquartile mean (mean of all observations between the 25th and 75th quartiles). Alternatively, metrics can be calculated for an individual band as a function of greenness or thermal rankings. For example, red reflectance is low at times of high greenness, and generally high for times of low greenness. A 90–100 interquantile mean of red reflectance ranked by NDVI typically yields a red reflectance value of <5% for forest cover for periods of one year or greater. A second type of metric is time-sequential, for example the change of reflectance over time (regression slope). A third type consists of composites where a compositing rule is applied to a defined interval in order to create a time-stamped, cloud-free image. For this study, example composite metrics include median of first three good observations and median of last three good observations. For the purpose of the forest disturbance alert algorithm, the metrics are used largely as a reference in identifying stable forest pixels within the preceding four-year period.
Methods
The first step in implementing an alert system is to define its meaning from a technical standpoint. For our purposes, an alert is something triggered based on a single observation, meaning the date of the latest observation is the date of the alert if triggered. While multiple alerts over the same location are used to build confidence, the alert itself is a function of the latest quality Landsat observation. In the presented method, the latest Landsat image is downloaded, all pixels are quality assessed, the image radiometrically normalized, and all viable land observations input to an algorithm for flagging forest disturbance. The Landsat metrics plus latest single-date Landsat image are our independent variables, related to forest cover loss, the dependent variable, through a classification tree algorithm. Classification trees have been used to classify land cover (Hansen et al 1996, Friedl and Brodley 1997) and are popular in characterizing global land cover (Friedl et al 2002, Hansen et al 2003). Training sites were derived using image interpretation and employed to create a generic model for characterizing forest loss based on the metric/single-date feature space. We employed 1268 single-date images compared with the 2010–2013 metric set to extract 953 k training pixels. All training pixels and corresponding spectral data from different dates were aggregated in a single training array from which we derived classification models. Training data were collected to characterize change within humid tropical forest pixels exhibiting high canopy loss (>50%) based on expert image interpretation in an active learning mode (Tuia et al 2009, Egorov et al 2015). In this approach, the algorithm is iterated until a stable model is achieved as determined by expert evaluation.
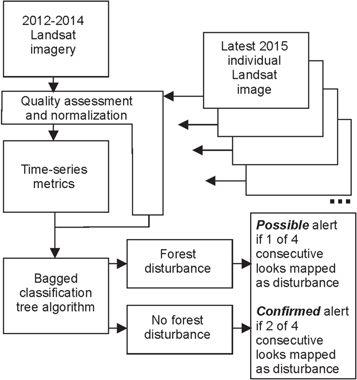
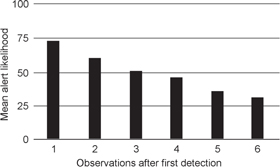
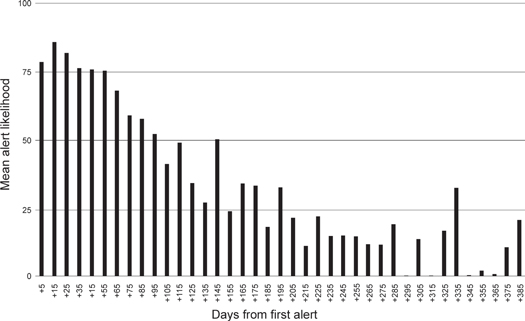
Figure 1 is a schematic of the general method. A set of bagged decision trees was applied to each new Landsat observation and antecedent Landsat metrics. Each tree output a per pixel likelihood of forest cover loss class membership. We employed three bagged tree models in order to reduce processing time, as the algorithm will be applied pan-tropically and eventually globally. The median likelihood was calculated from the three models and thresholded at >50% to identify forest disturbance alert pixels. Alerts were reported immediately and labeled as 'possible' forest disturbance if no antecedent alert for the same location existed. Subsequent observations were characterized and a rolling total out of four tracked in order to allow for errors of omission due to observation quality or other issues impacting algorithm sensitivity. If only one observation of the four was labeled as forest loss, the pixel remained as a 'possible' alert. If two or more out of four observations were flagged as alerts, then the alert was labeled as 'confirmed.' A four observation limit was applied in order to avoid observations of vegetation regrowth that are common in the humid tropics and can quickly obscure the disturbance signal. Figure 2 shows the attenuation of the disturbance signal for six total observations following a flagged disturbance alert. Figure 3 illustrates this same idea by days after initial alert. The four consecutive observation approach seeks to balance the value of repeated alerts with the likely attenuation of the disturbance signature. The method was applied to all 2014 Landsat images using a 2011–2013 metric feature space and was recently completed for 2015. A total of 1506, 898 and 2559 images for 2014 were processed in testing the method over humid tropical Peru, the Republic of Congo and Kalimantan, Indonesia. Through September 2015, totals of 987, 682, and 1768 images for the respective countries and province were processed in a pseudo-operational mode (lacking only posting for public access).
Figure 1. Flowchart of forest disturbance alert method.
Download figure:
Standard image High-resolution imageFigure 2. For confirmed alerts, mean forest cover loss likelihood of six subsequent observations.
Download figure:
Standard image High-resolution imageFigure 3. For confirmed alerts, mean forest cover loss likelihood of subsequent observations by days after initial alert.
Download figure:
Standard image High-resolution imageValidation—Peru example
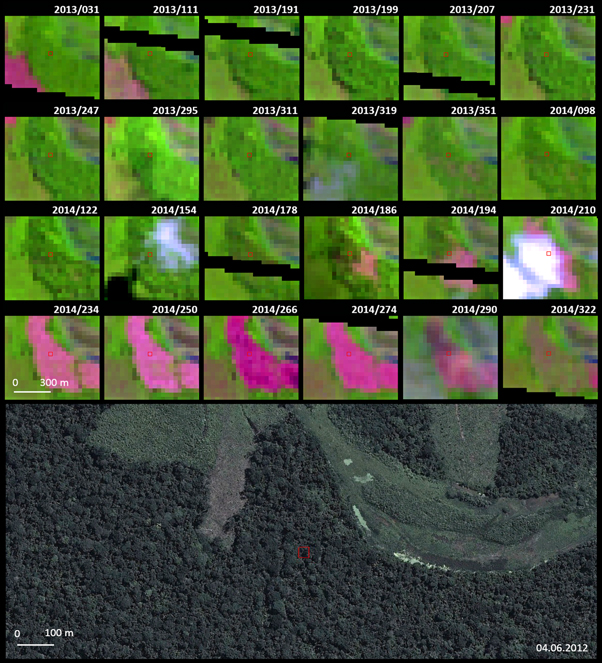
In order to evaluate our method, a test alert product was run for humid tropical Peru using 2014 Landsat 8 imagery. By running a historical year, we could readily exploit the full year of Landsat imagery and available high-spatial resolution data on GoogleEarth to perform a validation exercise. We could also avail the validation exercise by incorporating an existing annual loss product in constructing a probability-based stratified random sample. Specifically, we combined the alert product (both unconfirmed and confirmed alerts) and Peru data from the 2014 global tree cover loss map update to build a sampling stratification. We created 5 strata: 'no-global loss/yes-alert loss' (100 samples), 'yes-global loss/no-alert loss' (200 samples), 'yes-global loss/yes-alert loss' (200 samples), 'probable loss': pixels within a 10-pixel buffer around merged global loss and alert loss (400 samples), and 'no-global loss/no-alert loss': no loss pixels outside of the 10-pixel probable loss buffer (400 samples). The purpose of this stratification was to target likely areas of omission error in the alert product by creating 'yes- global loss/no-alert loss' and 'probable loss' strata. The sampling unit was our standard 0.000 25 × 0.000 25 degree pixel in a Geographic Coordinate System on a WGS-84 ellipsoid having an average area of 773 m2 within Peru. Reference 2014 tree cover loss values (loss/no loss) were recorded for each sample pixel by visually interpreting a time-series of individual Landsat images for 2013 and 2014 and available high resolution imagery from GoogleEarth (figure 4). Sample pixels, located on the boundaries of tree cover loss patches, were specifically marked as 'boundary pixels' in the process of validation in order to help understand the possible sources of differences between the sample-based validation and the map. Of the total 1300 interpreted samples, six did not have cloud-free reference data; thus, the final accuracy estimates were based on 1294 samples.
Figure 4. Validation sample pixel shown in red outline. Top panels—Landsat time series (2013 Julian day 31–2014 day 322), showing that sampled pixel experienced complete tree cover loss between days 194 and 210. Bottom panel—pre-disturbance high resolution image from Google Earth (04.06.2012).
Download figure:
Standard image High-resolution imageWe used a primary forest mask as a post-stratifier, to estimate alert accuracy separately within primary and secondary forests. A primary forest mask from Peru's Ministry of Environment (MINAM 2012) was used as a baseline, and all historic forest loss from 1990 to 2000 (Conservation International 2008) and 2000–2013 (Hansen et al 2013) change detection products were excluded from this primary forest mask. We estimated the alert product's user's and producer's accuracies from the error matrix of estimated area proportions using equations (6)–(8) from Olofsson et al (2013).
Results and discussion
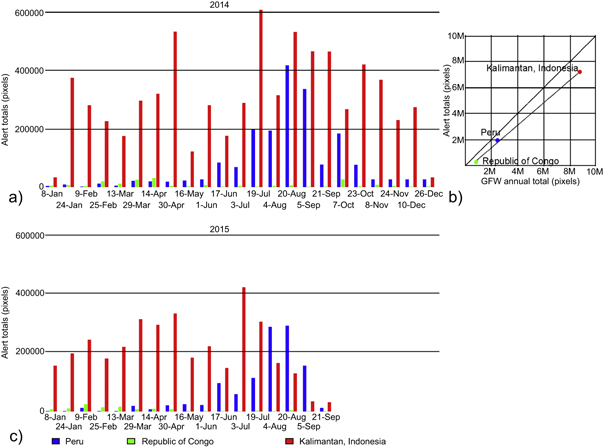
Annual 2014 alert totals in pixels equaled 1.85 M, 0.17 M and 7.15 M for Peru, Republic of Congo and Kalimantan, Indonesia, respectively. Through September of 2015 the respective alert totals were 1.13 M, 0.13 M and 3.56 M. Observational richness and alert counts largely followed local dry season conditions (figure 5(a)). The alert totals compared to the standard annual forest loss map estimates of Global Forest Watch illustrate that the confirmed alerts were comparatively and appropriately conservative (figure 5(b)), capturing the majority of the area identified by GFW as having experienced forest loss. Alerts totaled 74% of the annual mapped Peru forest disturbance and 80% of Kalimantan's. The exception was the Republic of Congo where small-scale disturbance predominates; here, the alert system depicted only 21% of the annual mapped loss in the GFW product. The 2015 results illustrated the application of forest disturbance tracking for decision support between annual GFW forest loss layer updates. Total 2015 alerts through September were down by 25% and 33% for Peru and Kalimantan, Indonesia, respectively. Congo's 2015 alerts were 95% of the 2014 total over the same period.
Figure 5. For Peru, Republic of Congo and Kalimantan, Indonesia, (a) temporal variation in Landsat forest disturbance alerts for the 2014 test period, (b) comparison of total pixel counts for Global Forest Watch (GFW) annual forest loss made on a calendar year basis versus alert pixel counts for 2014, and (c) alert totals through September 2015.
Download figure:
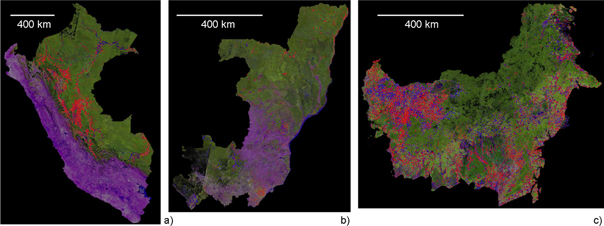
Standard image High-resolution imageFigure 6 illustrates the overall scheme for delivering alert data. The background consists of a Landsat 7 and 8-derived image composite consisting of the most recent cloud-free observation. On top of the composite are the alerts, color coded by confidence where red is confirmed and blue is possible. The composite image and alerts will have respective date layers. The alert date layer will relate the date of initial detection. All data will be updated weekly and be available for viewing and download at http://glad.geog.umd.edu/forest-alerts and www.globalforestwatch.org.
Figure 6. Spatial distribution of 2015 forest disturbance alerts for (a) Peru, (b) Republic of Congo and (c) Kalimantan, Indonesia. Red is confirmed alerts, blue possible alerts, both displayed on a latest good observation composite through 21 September 2015.
Download figure:
Standard image High-resolution imageMost alerts occur within zones of active land use change near existing settlements and transportation networks. However, the value of alerts will be in identifying new change dynamics and placing such alerts in the context of land use allocations. Figure 7 illustrates a first significant clearing within the Isconahua uncontacted indigenous reserve in east-central Peru. This reserve is east of Pucallpa and the Ucayali River. The detected alerts in figure 7(b) are mainly on the eastern periphery of Pucallpa (left edge of subset), with a second zone of forest clearing approaching and crossing into the reserve from the south along a tributary of the Ucayali River. The dramatic clearing shown in figure 7(c) within the reserve is not clearly connected to either of these landscapes and surpasses in extent any disturbances in the area of figure 7(b).
Figure 7. Peru forest disturbance alerts inside the primary forests of the Isconahua uncontacted indigenous reserve, a portion of which is shown as black outline of (b). The identified clearing within the reserve is from 15 June 2015 and covers more than 400 ha. Note clearings along river course south of the reserve. (a) is Peru overview, (b) a 70 km by 40 km subset centered at 8d 4.75''S, 74 1.75''W, and (c) a 2 km by 2 km subset centered at 8d 1.13''S, 73d 56.13''W.
Download figure:
Standard image High-resolution imageAvailability of observations—example of Peru
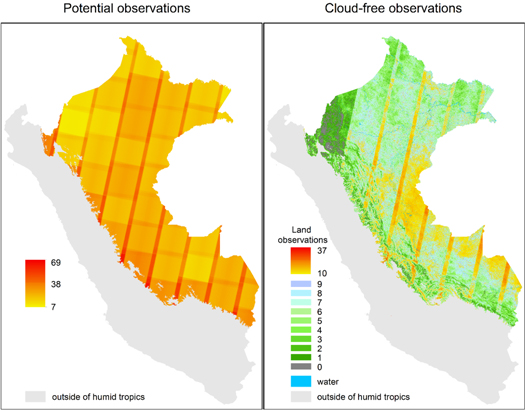
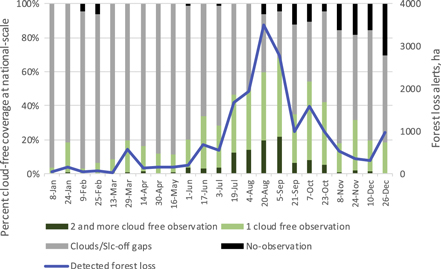
Observation availability is a limiting factor for Landsat-based alerts. Landsat 7 and 8 have a combined nominal 8 day revisit period. In practice, observation availability is limited by the respective Landsat acquisition strategies and cloud cover (figure 8). In 2014, an average of 1.54 images were available per path/pow (0.85 Landsat 7 and 0.70 Landsat 8) per 16 day interval. Cloud cover was a greater limiting factor than image acquisition strategy and corresponds to local dry and rainy seasons. Despite the fact that from January to May 2014 99% of path/rows had at least one image per 16 day period, cloud free observations from January to May covered less than 20% of humid tropical Peru per 16 day period (figure 9). From June to October, the local dry season, more cloud free data were available. For the 16 day period at the start of September, 67.5% of humid tropical Peru had at least one cloud free observation. From November to December as the rainy season returns, observation availability was again heavily affected by cloud cover. The forest cover loss detection dynamic corresponded to variations in cloud free observation and illustrates the higher frequency of cloud-free data within lowland humid tropical forests compared to the higher elevation Amazon-Andes transition zone, particularly in the northwest. The majority of forest loss alerts were detected from August to September, a period concurrent with the local dry season and a corresponding cloud-free observation window.
Figure 8. Potential versus cloud-free observations for Peru from combined Landsat 7 and 8 overpasses.
Download figure:
Standard image High-resolution imageFigure 9. Cloud free observations and forest loss detection by 16 day period for Peru in 2014.
Download figure:
Standard image High-resolution imageValidation results—example of Peru
When comparing validation sample reference and alert values, 91 samples were identified as having omission error, and 76 commission error from the total of 1294 samples. However, only 53 samples with omission error and 10 samples with commission error were identified as non-boundary. This means that the majority of commission in the alert product occurred on the boundaries of correctly mapped tree cover loss patches. Taking into consideration the ambiguity in the interpretation of boundary pixels, we have estimated user's and producer's accuracies separately for all samples (including boundary pixels) and for non-boundary samples only (table 1). Furthermore, we have reported accuracy metrics for the 'confirmed' alerts alone, for all pixels and less boundary pixels (table 1).
Table 1. Estimated user's and producer's accuracy in percent for all forests, and separately for primary and secondary forests with uncertainty expressed as standard error.
| All forests | Primary | Secondary | |
|---|---|---|---|
| User's accuracy | |||
| All samples (including boundary pixels) | 86.5 ± 2.0 | 86.1 ± 2.6 | 87.0 ± 3.0 |
| Without boundary pixels | 96.2 ± 1.3 | 95.5 ± 1.8 | 97.2 ± 1.7 |
| Without boundary pixels and unconfirmed alerts | 99.0 ± 0.7 | 99.1 ± 0.9 | 98.9 ± 1.2 |
| Producer's accuracy | |||
| All samples (including boundary pixels) | 67.0 ± 7.4 | 77.6 ± 16.2 | 56.4 ± 7.0 |
| Without boundary pixels | 69.8 ± 9.0 | 82.6 ± 21.5 | 57.5 ± 8.3 |
| Without boundary pixels and unconfirmed alerts | 69.7 ± 9.0 | 84.9 ± 22.0 | 54.5 ± 7.9 |
User's accuracies, representing commission errors (false alerts), ranged from 95.5% to 97.2% in primary and secondary forests, respectively, when discounting boundary alerts ('without boundary pixels', table 1). Closer examination of the 10 non-boundary samples with commission errors allowed us to identify the primary sources of commission error: late 2013 tree cover loss detected in 2014 (2 samples), non-forest dynamics (e.g. river valley inundation or cropland dynamics) identified as tree cover loss (3 samples), and samples with no readily visible tree cover loss dynamics in the Landsat time-series, possibly due to errors in the cloud-screening model (5 samples). Considering only confirmed alerts (table 1), user's accuracy increased to ~99% in all forest types.
Producer's accuracies, representing omission errors (missed alerts) were significantly higher in primary forests compared to secondary forests (table 1). Out of 53 non-boundary samples with omission error, 12 were omitted in primary forests, and 41 in secondary. This is not surprising as the algorithm has been tuned for older mature forest stands and young regrowth clearings are likely not well represented in the training data. A total of 39 out of 53 omitted samples were from tree cover loss patches <10 ha, indicating that the majority of tree cover loss omitted in the alert map was small-scale (less than 100 Landsat pixels).
Small forest loss patches dominated in the detected loss. Loss consisting of a single Landsat pixel totaled 4% of total detected loss (approximately 0.1 ha), 33% of detected loss patches were less than one hectare, and 85% less than 10 hectare. There is a clear advantage of 30 m Landsat-based alerts compared to alert systems that employ 250 m MODIS (Anderson et al 2005, Hammer et al 2014) or 375 m VIIRS daily coarse resolution data, and even more recent 56 m AWIFS (Diniz et al 2015) imagery.
Conclusion
An approach for mapping humid tropical forest disturbance alerts using Landsat data was presented for Peru, Republic of Congo and Kalimantan, Indonesia. Results indicate a robust method for conservatively identifying forest loss within humid tropical rainforests. Such a system can highlight the forest landscapes under immediate threat of conversion and provide a quantitative measure of the degree of such threats. While remote sensing is a de facto historical record, low latency data provide information in a timeframe suitable for interventions, if needed, as with the DETER system of Brazil. Producing medium spatial resolution alerts pan-tropically may enable other tropical forest countries to develop similar integrated policy, management and enforcement frameworks without first having to develop an end to end remote sensing processing and characterization system.
The method will eventually be applied across the humid tropics as part of the Global Forest Watch initiative with subscription services made available to forest land managers and other interested parties. Remote sensing's greatest asset is to provide data for areas where no ground observations exist. Clearing within protected areas is an obvious and useful application for such an alert system. However, the majority of remaining old growth rainforest does not have protected area status. The continued conversion of high conservation value forests lacking protected status will similarly be documented using the alert system. Existing high carbon stock, high biodiversity forests are key to multi-benefit policy initiatives such as REDD+. Jantz and Goetz et al (2014) illustrated the importance of such forests in establishing corridors which maximize combined carbon sequestration and biodiversity maintenance. Robust land use planning of tropical forest landscapes will require timely and accurate forest disturbance data. Figure 7 illustrates this point. The alert's value is not as an area estimation of the change, but as an indicator of forest exploitation within old growth forests of a recently established indigenous reserve. As such, it illustrates possible threats to a newly developed land use plan. We expect such information to lead to greater transparency of tropical forest management and improve information inputs to all stakeholders, including government, civil society and private industry.
The primary limitation of the method is cloud cover and a dearth of good quality land surface observations during local rainy seasons. Incorporating Sentinel-2 data (Drusch et al 2012) as well as improving the Landsat georectification algorithm for partly-cloudy Landsat scenes will increase data richness and improve detection of change within local rainy seasons. With two Landsats and eventually two Sentinel 2 s, image cadence would be on the order of 3–5 days. Radar is another option, but its operational application for forest monitoring has not yet been realized. An alert system operating at the scale presented here depends on systematic global acquisitions, robust pre-processing, and free and accessible data. Only Landsat has these criteria at medium spatial resolutions, with Sentinel aspiring to emulate Landsat.
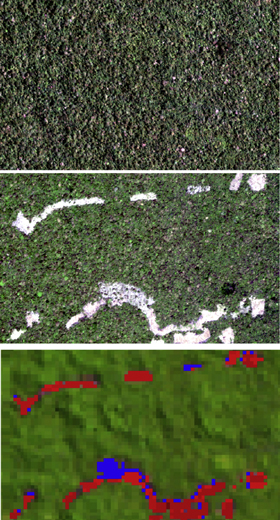
Finally, synergistic use of the alarm with new very high spatial resolution imaging capabilities should be pursued. Figure 10 illustrates 1 m Skybox data before and after Landsat alert detections. Allocation of very high spatial resolution image tasking could be facilitated through coordination with medium spatial resolution alerts from Landsat, enabling improved quantification of tropical forest change dynamics and associated drivers.
Figure 10. Ucayali, Peru, northwest of Pucallpa: (a) Skybox SkySat-2 true color image from 3 April 2015, (b) Skybox Skysat-1 true color image from 10 September 2015, (c) 2015 Landsat alerts with red = 'confirmed' and blue = 'possible' on latest observation composite image. Scene subset of 2.4 km by .7 km and centered at 75d 5.5''W and 8d 12.9''S.
Download figure:
Standard image High-resolution imageAcknowledgments
This study was made possible by support from Global Forest Watch through Norway's International Climate and Forest Initiative, the United States Interagency SilvaCarbon program, the Gordon and Betty Moore Foundation, and the United States Agency for International Development through the Central Africa Regional Program for the Environment. Skybox imagery courtesy of Skybox for Good program.
