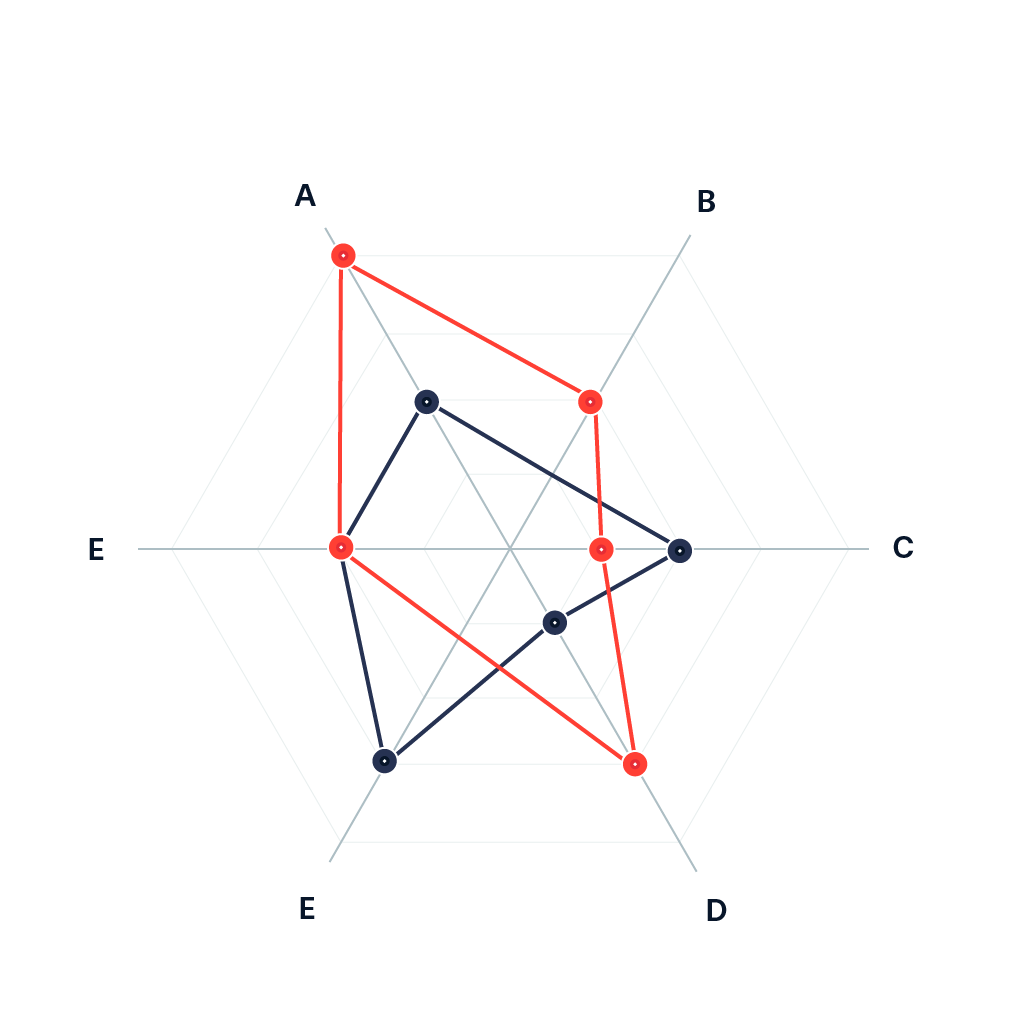
Radar Diagram
Also called: Web Chart, Spider Chart, Star Chart, Star Plot, Cobweb Chart

A radar chart is a graphical method of displaying multivariate data in the form of a two-dimensional chart of three or more quantitative variables represented on axes starting from the same point. The relative position and angle of the axes is typically uninformative.
Examples
-
https://www.behance.net/gallery/15083507/WIRED-ITA-Il-Dato-e-Oro">
-
https://www.flickr.com/photos/accurat/11052331736/">
-
http://www.fastcodesign.com/1671897/infographic-the-nbas-best-players-visualized-as-statistical-snowflakes">
-
http://www.queerideas.co.uk/.a/6a01053597f309970c012875880fd0970c-pi">
-
https://www.flickr.com/photos/densitydesign/8089715358/in/album-72157631774207511/">
-
https://www.flickr.com/photos/densitydesign/8100153188/in/album-72157631774207511/">
-
https://www.flickr.com/photos/densitydesign/">
-
http://www.visualcinnamon.com/2015/10/different-look-d3-radar-chart.html">
-
https://www.behance.net/gallery/27726193/Wired-Inside-the-music-of-Mika-visualization">
-
https://www.instagram.com/the.visual.agency/">
-
https://dribbble.com/shots/21613631-Radar-chart-widgets-Hyper-charts-UI-Kit">