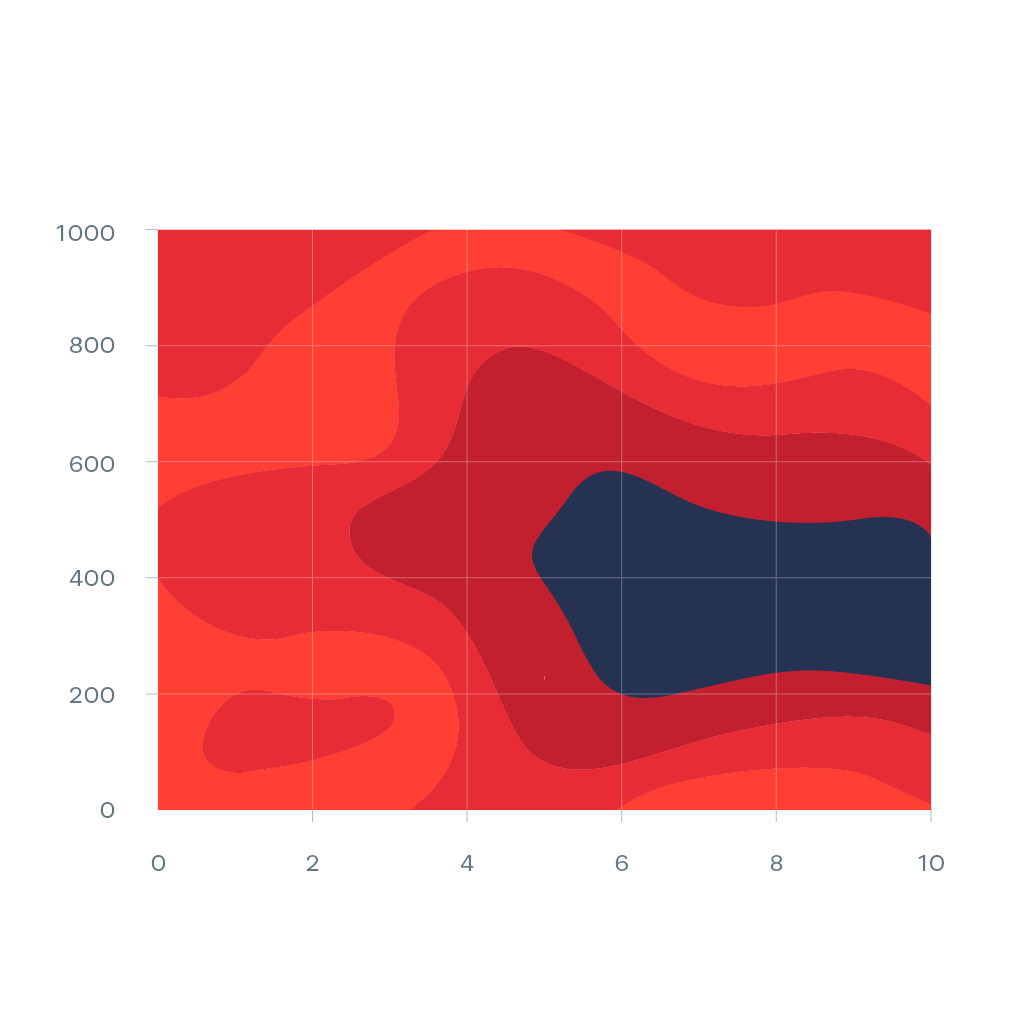
Contour Plot

A Contour Plot is a graphic representation of the relationships among three numeric variables in two dimensions. Two variables are for X and Y axes, and a third variable Z is for contour levels. The contour levels are plotted as curves; the area between curves can be color coded to indicate interpolated values.
The contour plot is an alternative to a 3-D surface plot.
Examples
-
http://help.plot.ly/excel/contour-plots">
-
http://www.zeyneporbay.com/#/iii/">
-
https://plot.ly/matlab/contour-plots/">
-
https://support.sas.com/documentation/cdl/en/statug/63033/HTML/default/viewer.htm#statug_kde_sect025.htm">
-
https://www.behance.net/gallery/57707/IDP06">
-
http://www.ncl.ucar.edu/Applications/overlay.shtml">
-
https://plot.ly/~empet/1737.embed">
-
https://www.instagram.com/the.visual.agency/">