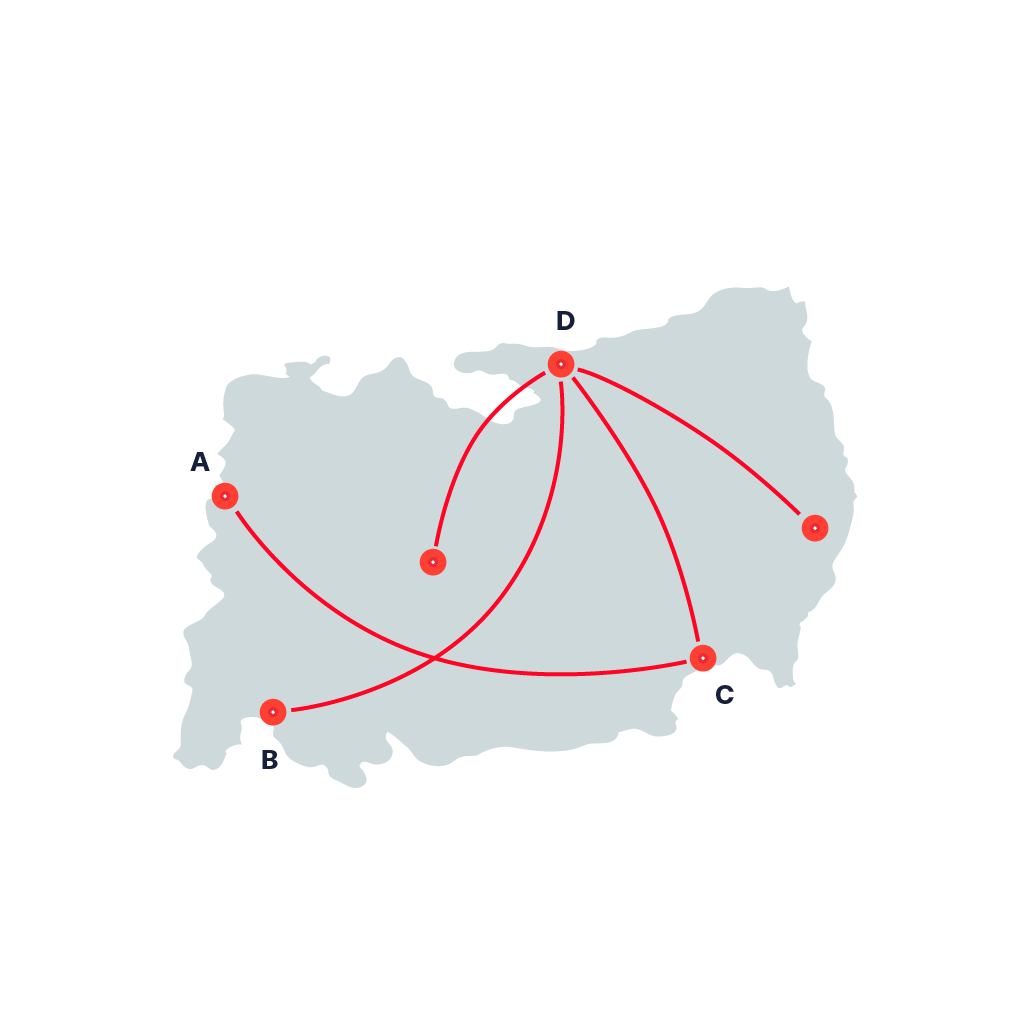
Connection Map

Connection Map is used to display network combined with geographical data. It can be used for visualising flight connections, flow of import/export or migration, any kind of connections between different locations. By combining thickness, colour, or pattern to the lines or adding another type of visualisation (for example, bar chart or dot plot), you can add numeric values to Connection Map. It is related to a Flow Map but display no quantitative values between the connections.
Examples
-
http://graphics.thomsonreuters.com/15/migrants/index.html#section-network">
-
https://www.behance.net/gallery/26934651/Map-Observatorium">
-
https://www.behance.net/gallery/11358305/Twitter-La-Lettura-Corriere-della-Sera">
-
https://nsa.gov1.info/surveillance/nsa-surveillance-map-lg.jpg">
-
http://tg.tripadvisor.jp/onboard/">
-
https://blog.zimbra.com/2014/03/zimbras-globetrotting-city-near-spring/">
-
http://feltron.tumblr.com/post/18485977985/philip-k-dick-claimed-that-a-persons-authentic">
-
http://instagram-engineering.tumblr.com/post/117889701472/emojineering-part-1-machine-learning-for-emoji">
-
https://www.behance.net/gallery/6578765/Infographics-Raconteur-The-Times">
-
https://www.behance.net/gallery/8857935/Transraysa-corporative-booklet">
-
https://dribbble.com/shots/2793458-Connecting-the-Dots">
-
https://dribbble.com/shots/1074201-World-carbon-map-draft">
-
https://www.designboom.com/technology/loci-customizes-3d-printed-sculptures-of-air-travel/?utm_campaign=daily&utm_medium=e-mail&utm_source=subscribers">
-
https://cybermap.kaspersky.com">