Arc Diagram

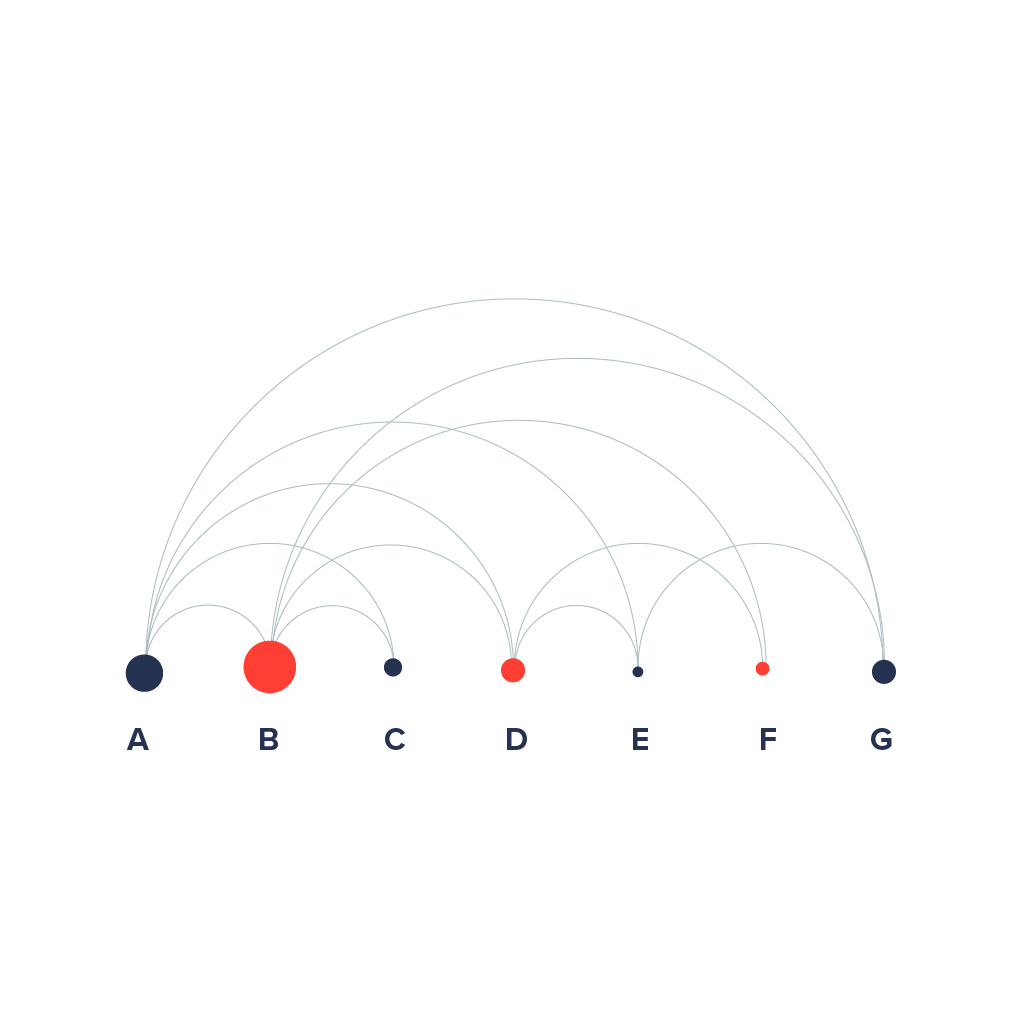
An Arc Diagram uses a one-dimensional layout of nodes with circular arcs to represent connections. Nodes are placed along a single line and arcs are used to display links between the nodes. The thickness of the lines can display frequency between the nodes.
The Arc Diagram can have a similar purpose as the Chord Diagram and the Network Visualisation. But it may not be as effective to show structure in two dimensions as it serves the purpose to easy identify correlation.
Examples
-
http://demo.trendviz.com/">
-
https://www.behance.net/gallery/716276/Nissan-Leaf">
-
http://www.theguardian.com/news/datablog/gallery/2013/sep/05/holy-infographics-bible-visualised">
-
http://www.theguardian.com/news/datablog/gallery/2013/sep/05/holy-infographics-bible-visualised">
-
http://www.r-bloggers.com/barug-talks-highlight-rs-diverse-applications/">
-
https://www.flickr.com/photos/twentyfoursides/3070020333/sizes/l/in/set-72157603905704682/">
-
http://visualoop.com/media/2015/01/image_62.png">
-
https://www.instagram.com/the.visual.agency/">