The data comes from the Chrome User Experience Report (CrUX) which contains field data of Chrome users who opted to share their data.
Mobile page experience and the included Core Web Vital metrics have officially been used for ranking pages since May 2021. Desktop signals have also been used as of February 2022.
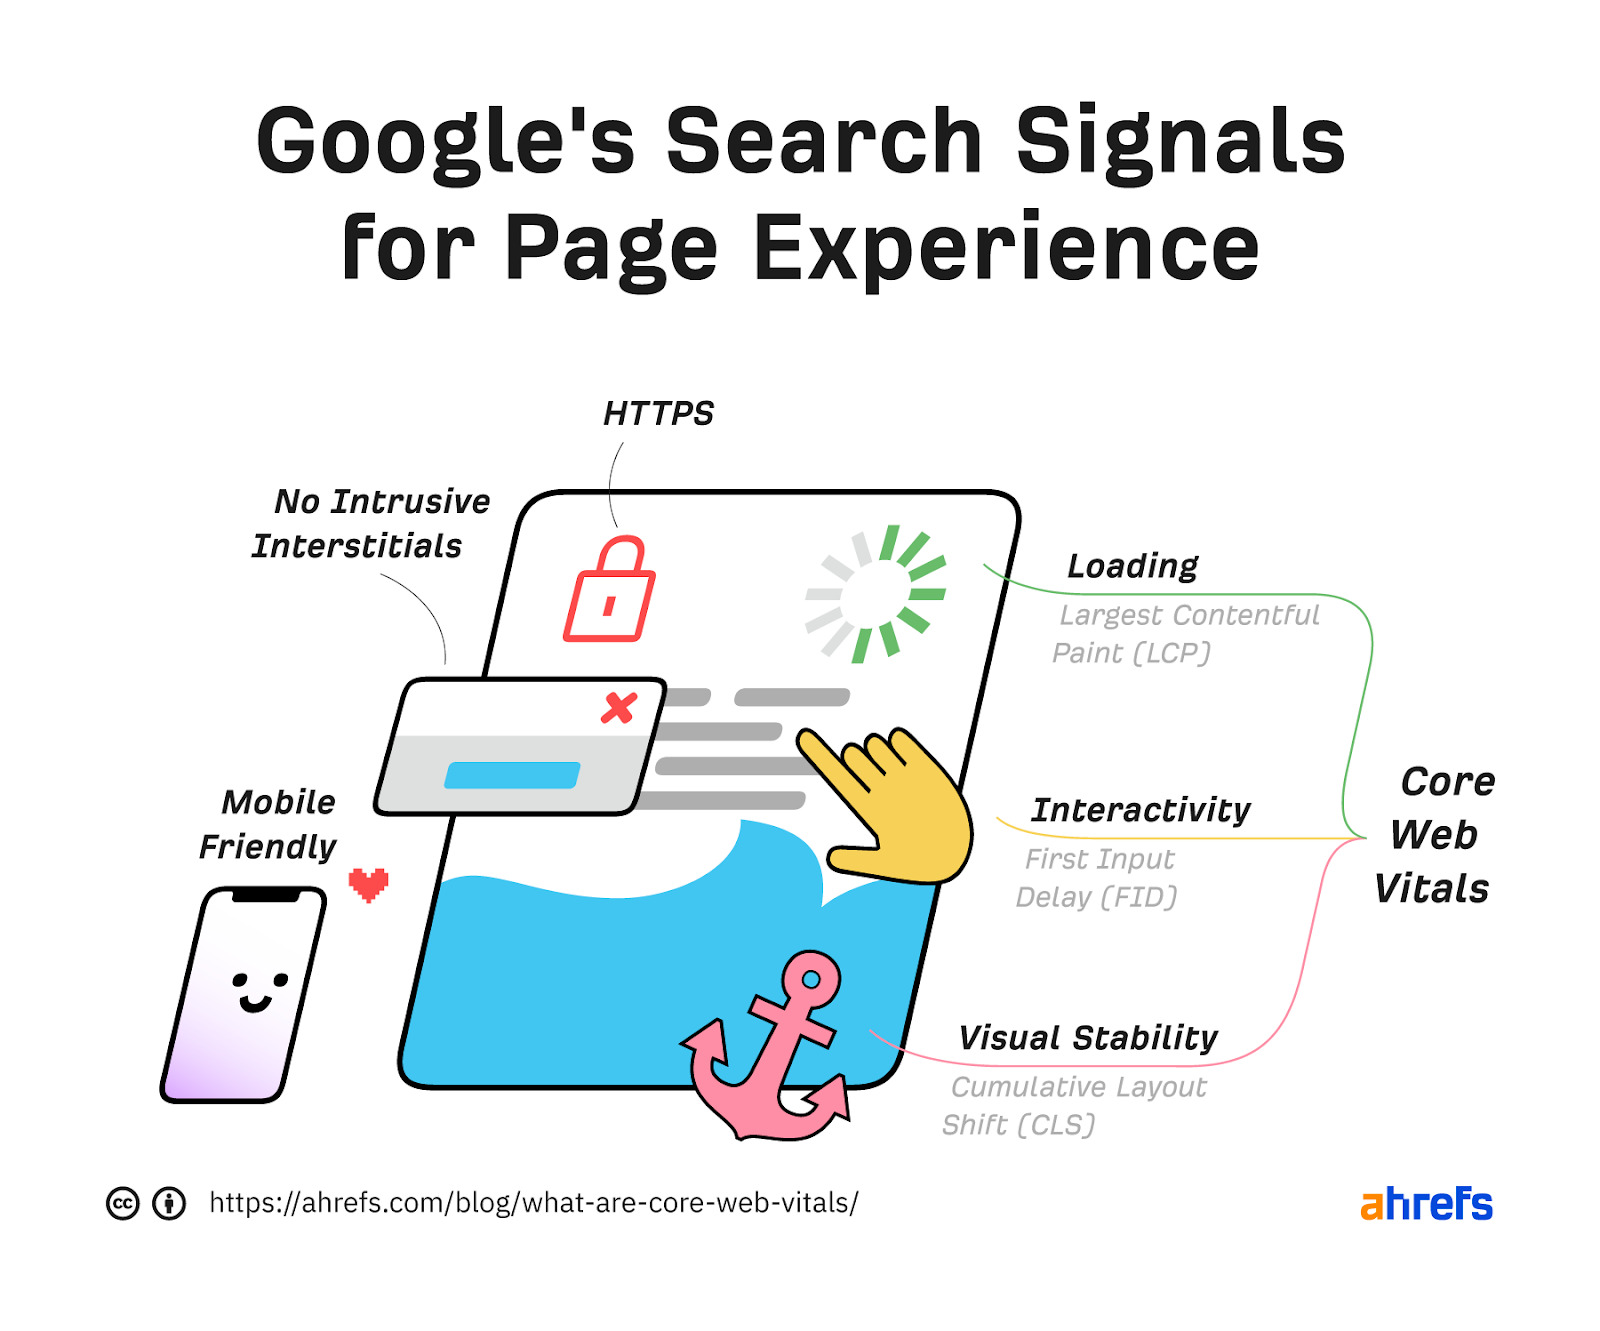
The benchmarks for each category are as follows:
| Good | Needs improvement | Poor | |
|---|---|---|---|
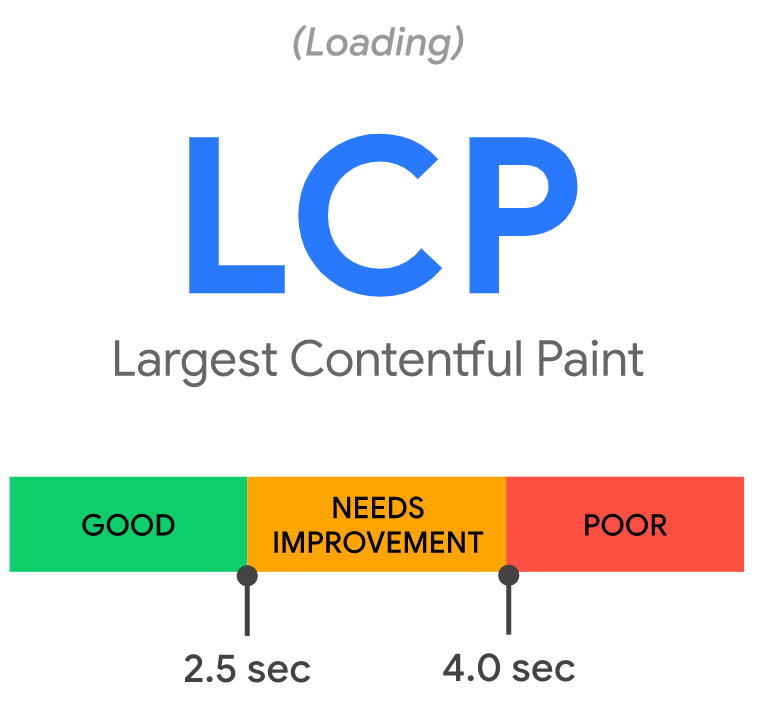
| LCP | <=2.5s | >2.5s - <=4s | >4s |
| INP | <=200ms | >200ms - <=500ms | >500ms |
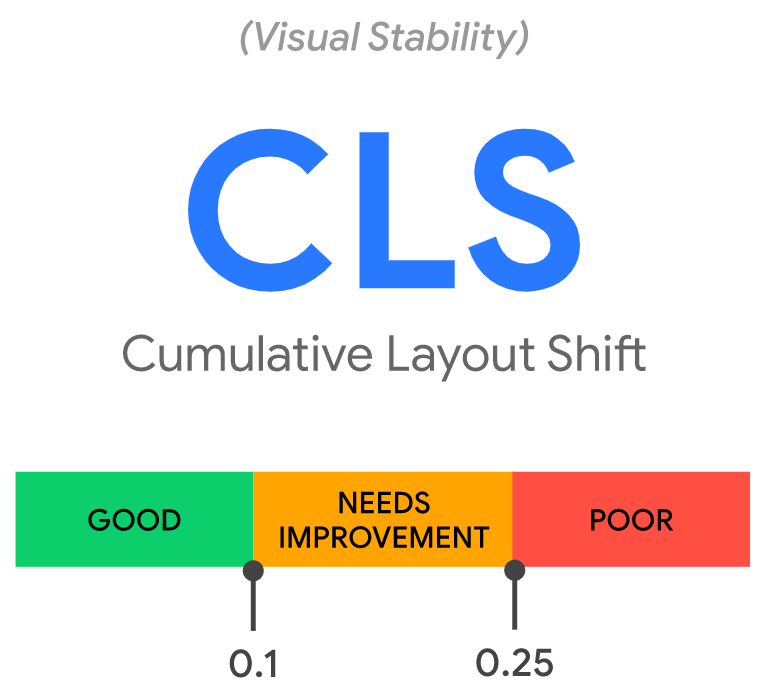
| CLS | <=0.1 | >0.1 - <=0.25 | >0.25 |
Let’s look at each Core Web Vital in more detail and how you can get your pages to pass the checks.
- Largest Contentful Paint (LCP)
- Cumulative Layout Shift (CLS)
- Interaction to Next Paint (INP)
- First Input Delay (FID)
- How to measure Core Web Vitals
- How to improve Core Web Vitals
- Are Core Web Vitals important for SEO?
- Quick facts about Core Web Vitals
Largest Contentful Paint (LCP) is the amount of time it takes to load the single largest visible element in the viewport. It represents the website being visually loaded.
The largest element is usually going to be a featured image or maybe the <h1> tag. But it could also be any of these:
- <img> element
- <image> element inside an <svg> element
- Image inside a <video> element
- Background image loaded with the url() function
- Blocks of text
<svg> and <video> may be added in the future.
How to see the LCP element
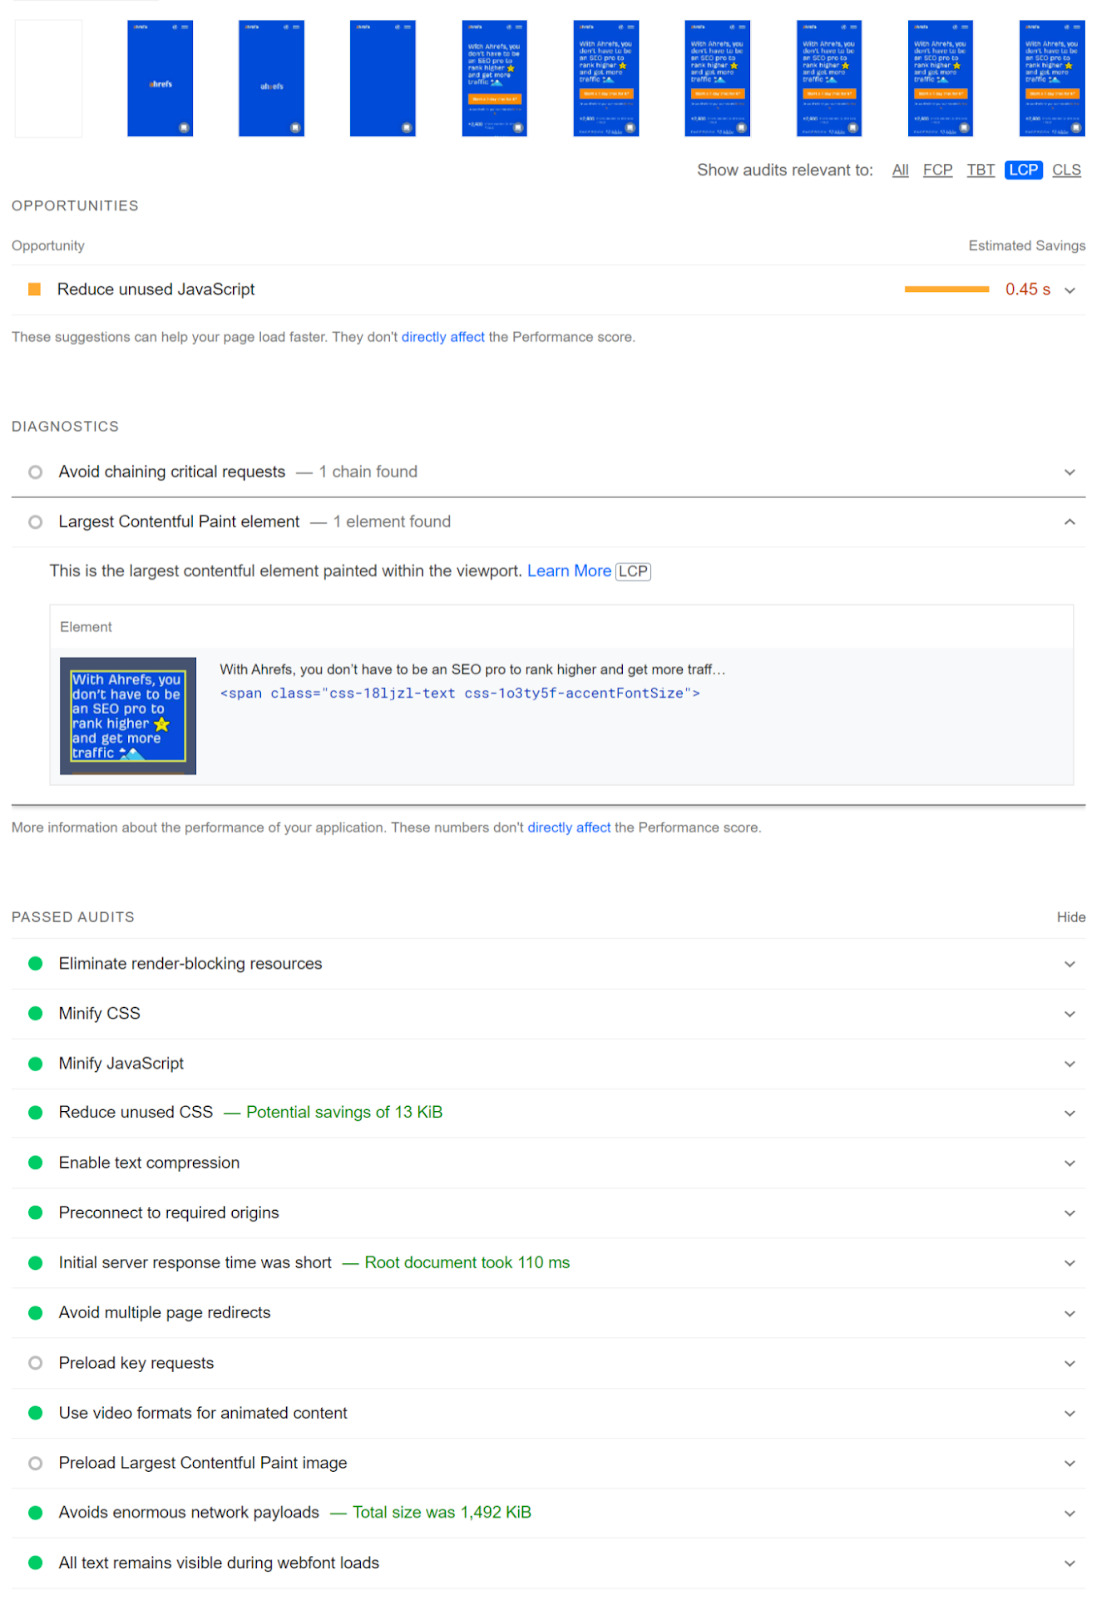
In PageSpeed Insights, the LCP element will be specified in the “Diagnostics” section. Also, notice there is a tab to select LCP that will only show issues related to LCP.
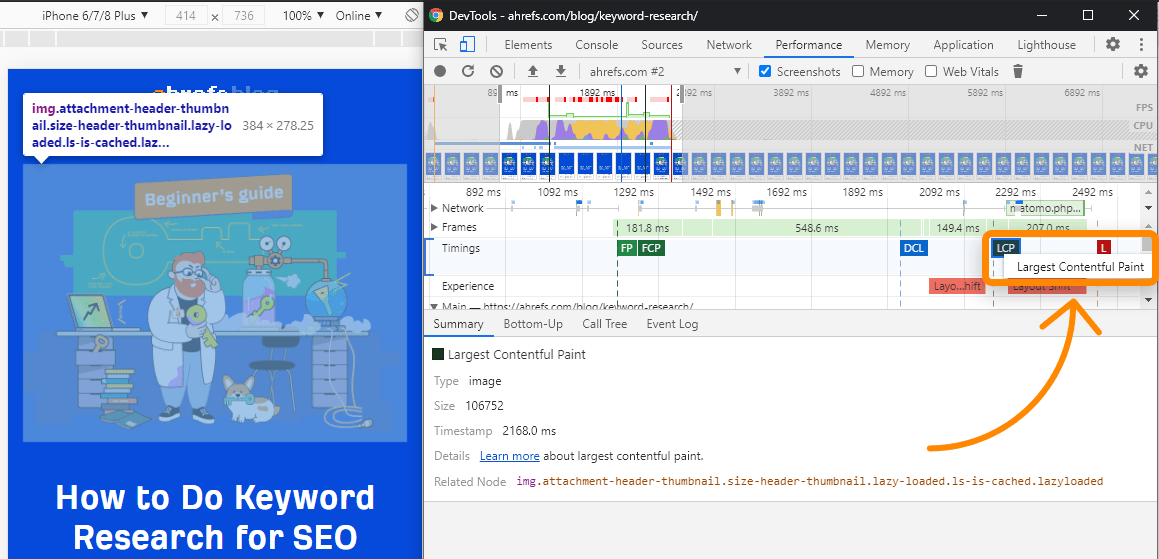
In Chrome DevTools, follow these steps:
- Performance > check “Screenshots”
- Click “Start profiling and reload page”
- LCP is on the timing graph
- Click the node; this is the element for LCP
Cumulative Layout Shift (CLS) measures the visual stability of a page as it loads. It does this by looking at how big elements are and how far they move.
Google has already updated how CLS is measured. Previously, it would continue to measure even after the initial page load. But now it’s restricted to a five-second time frame where the most shifting occurs.
It can be annoying if you try to click something on a page that shifts and you end up clicking on something you don’t intend to. It happens to me all the time. I click on one thing and, suddenly, I’m clicking on an ad and am now not even on the same website. As a user, I find that frustrating.
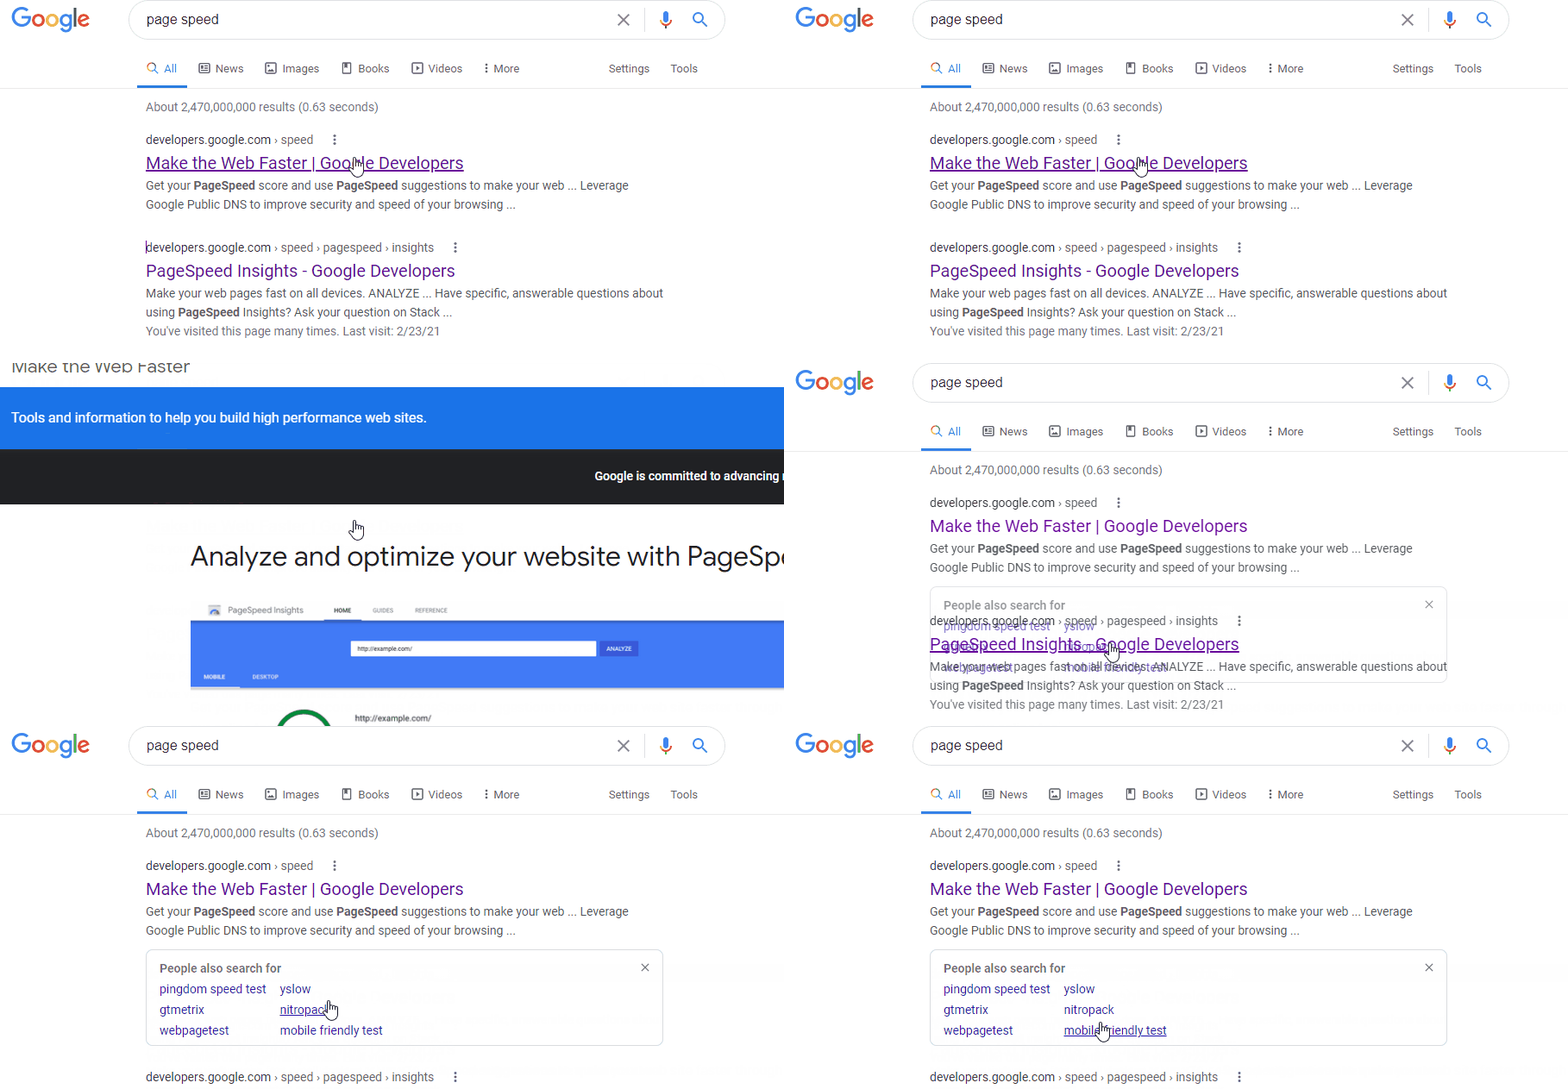
Common causes of CLS include:
- Images without dimensions.
- Ads, embeds, and iframes without dimensions.
- Injecting content with JavaScript.
- Applying fonts or styles late in the load.
How to see CLS
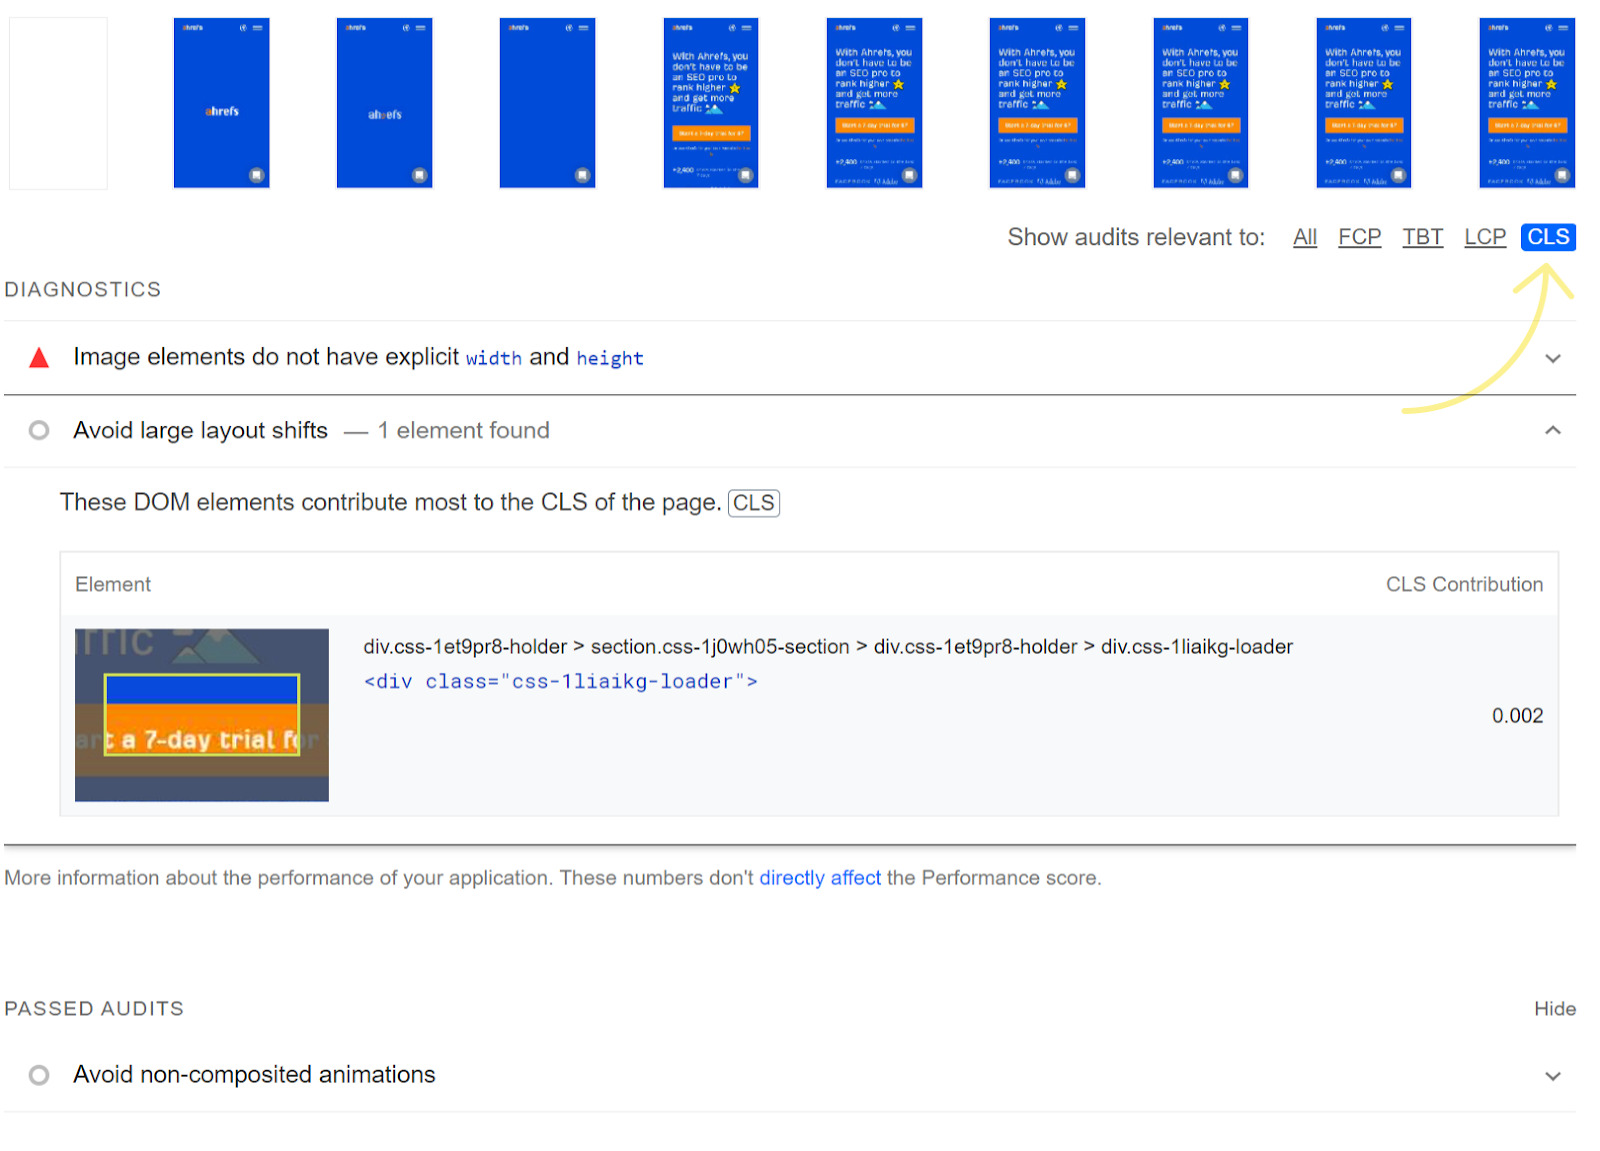
In PageSpeed Insights, if you select CLS, you can see all the related issues. The main one to pay attention to here is “Avoid large layout shifts.”
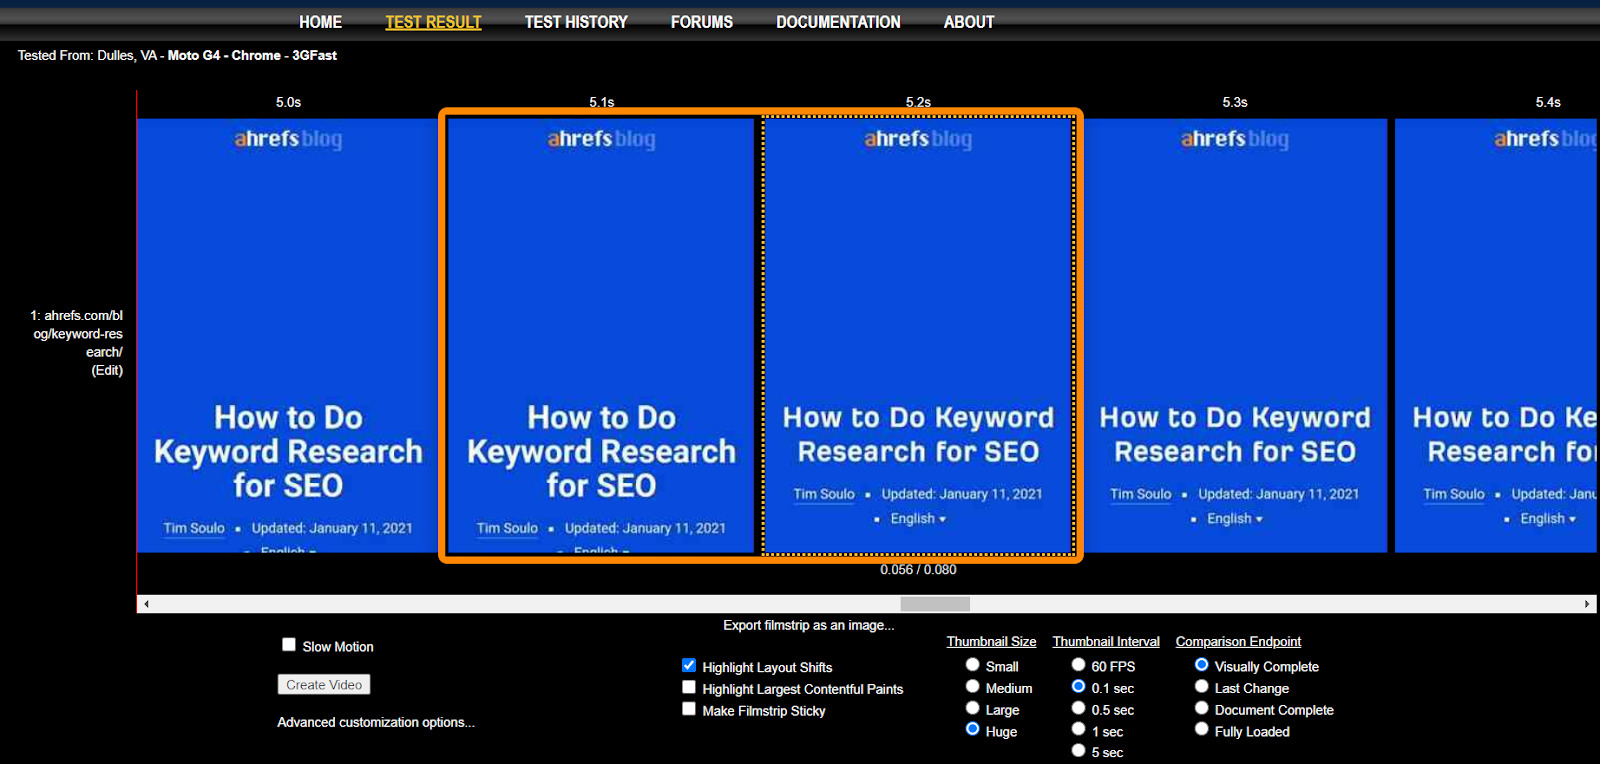
We’re using WebPageTest. In Filmstrip View, use the following options:
- Highlight Layout Shifts
- Thumbnail Size: Huge
- Thumbnail Interval: 0.1 secs
Notice how our font restyles between 5.1 secs and 5.2 secs, shifting the layout as our custom font is applied.
Smashing Magazine also had an interesting technique where it outlined everything with a 3px solid red line and recorded a video of the page loading to identify where layout shifts were happening.
Interaction to Next Paint (INP) measures how quickly a website responds to user interactions. It is one of the Core Web Vital metrics and uses data from the Event Timing API to observe the latency of all click, tap, and keyboard interactions with a page throughout its lifespan.
To have a good INP rating, INP needs to be less than or equal to 200 milliseconds. INP between 200 milliseconds and 500 milliseconds would be considered average, and below 500 milliseconds would indicate poor responsiveness.
INP replaced FID as a Core Web Vital in March 2024. It measures all user interactions instead of just the first one.
INP is more comprehensive than FID because it is sensitive to all user interactions, while FID is just concerned with the “first” interaction.
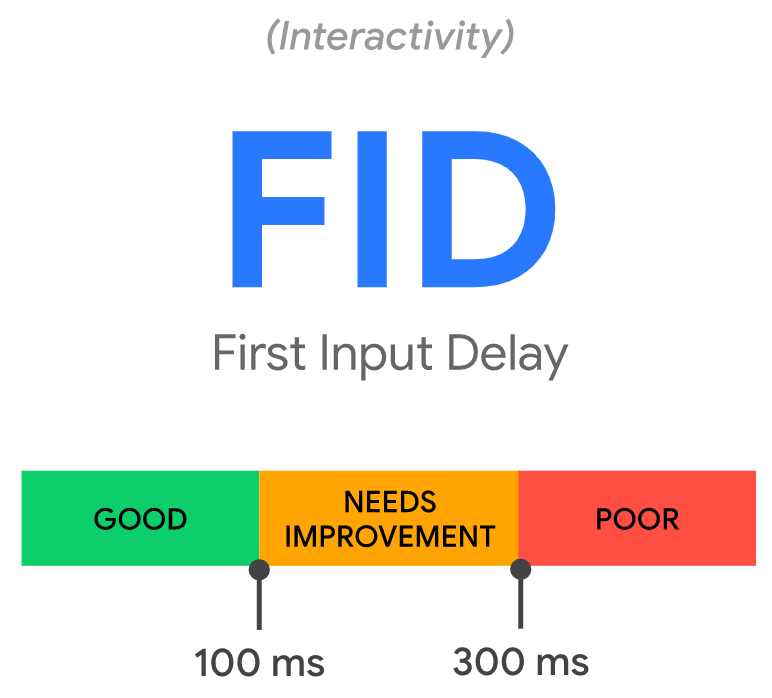
First Input Delay (FID) is the time from when a user first interacts with your page to when the page responds. It measures responsiveness.
FID was replaced as a Core Web Vital by Interaction to Next Paint (INP) on March 12th, 2024.
Example interactions:
- Clicking on a link or button
- Inputting text into a blank field
- Selecting a drop-down menu
- Clicking a checkbox
Some events like scrolling or zooming are not counted.
It can be frustrating trying to click something, and nothing happens on the page.
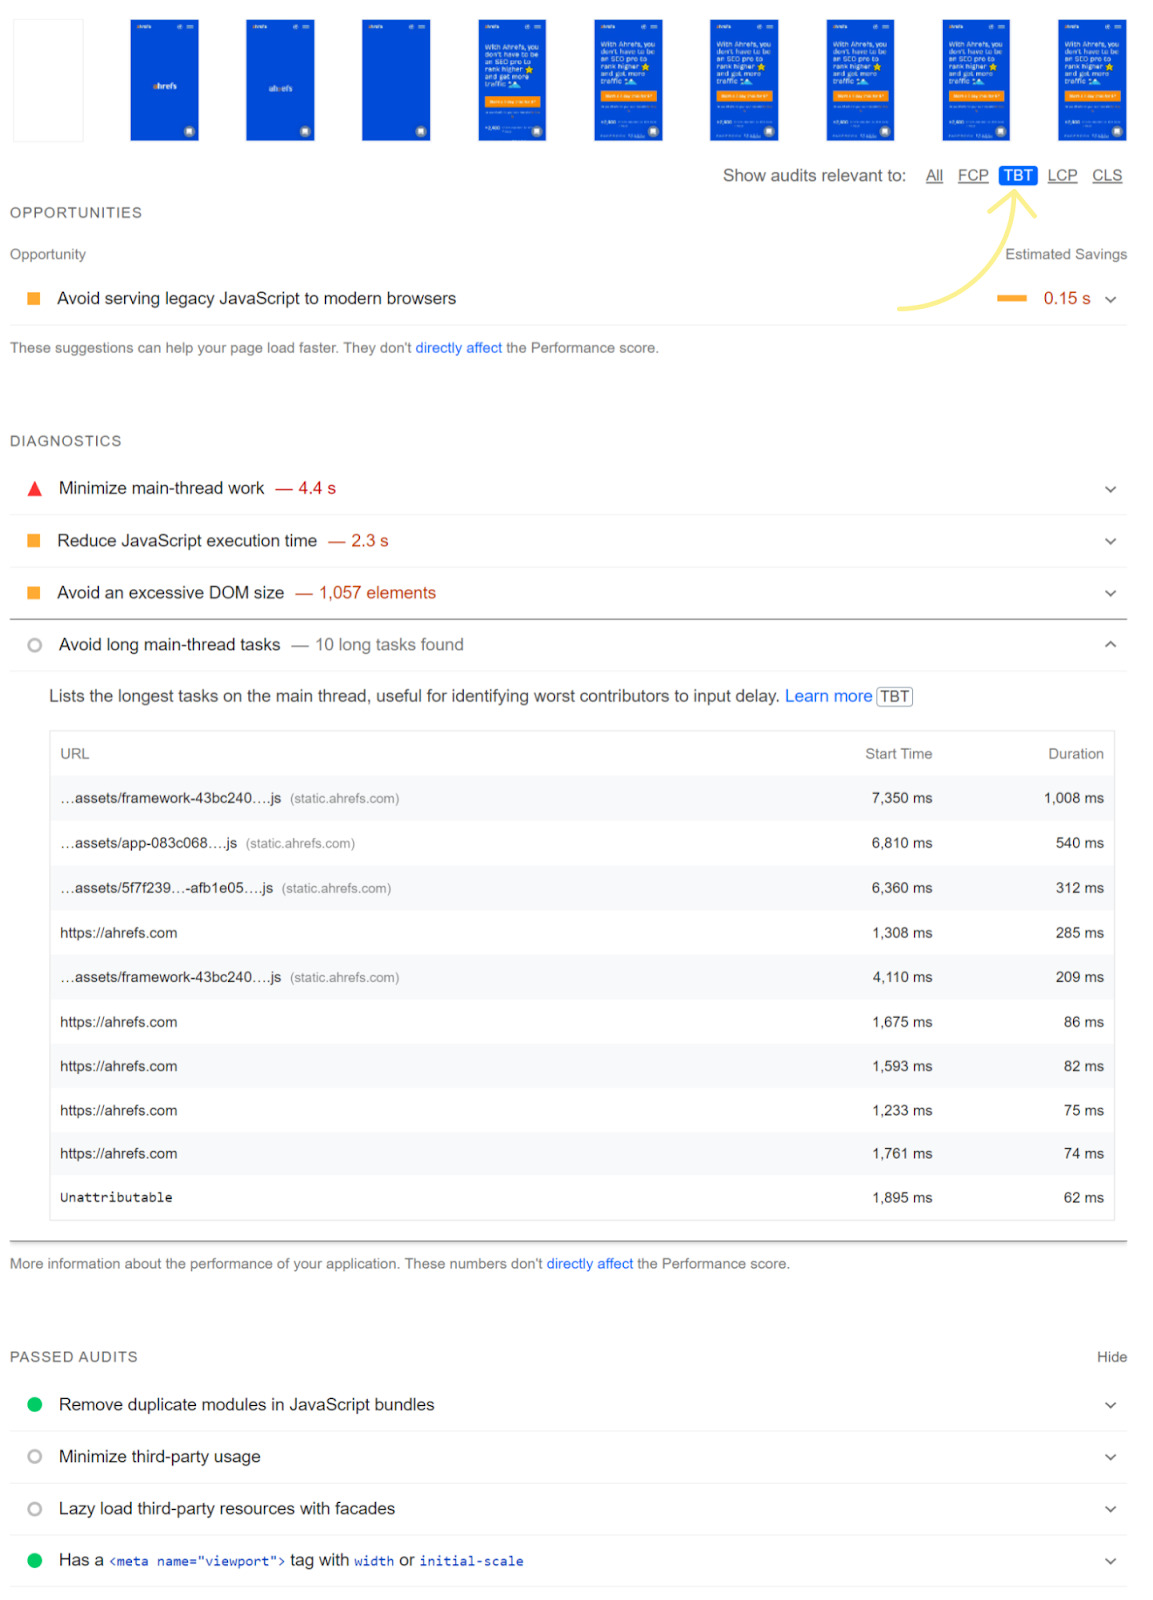
Not all users will interact with a page, so the page may not have an FID value. This is also why lab test tools won’t have the value because they’re not interacting with the page. What you may want to look at for lab tests is Total Blocking Time (TBT). In PageSpeed Insights, you can use the TBT tab to see related issues.
What causes the delay?
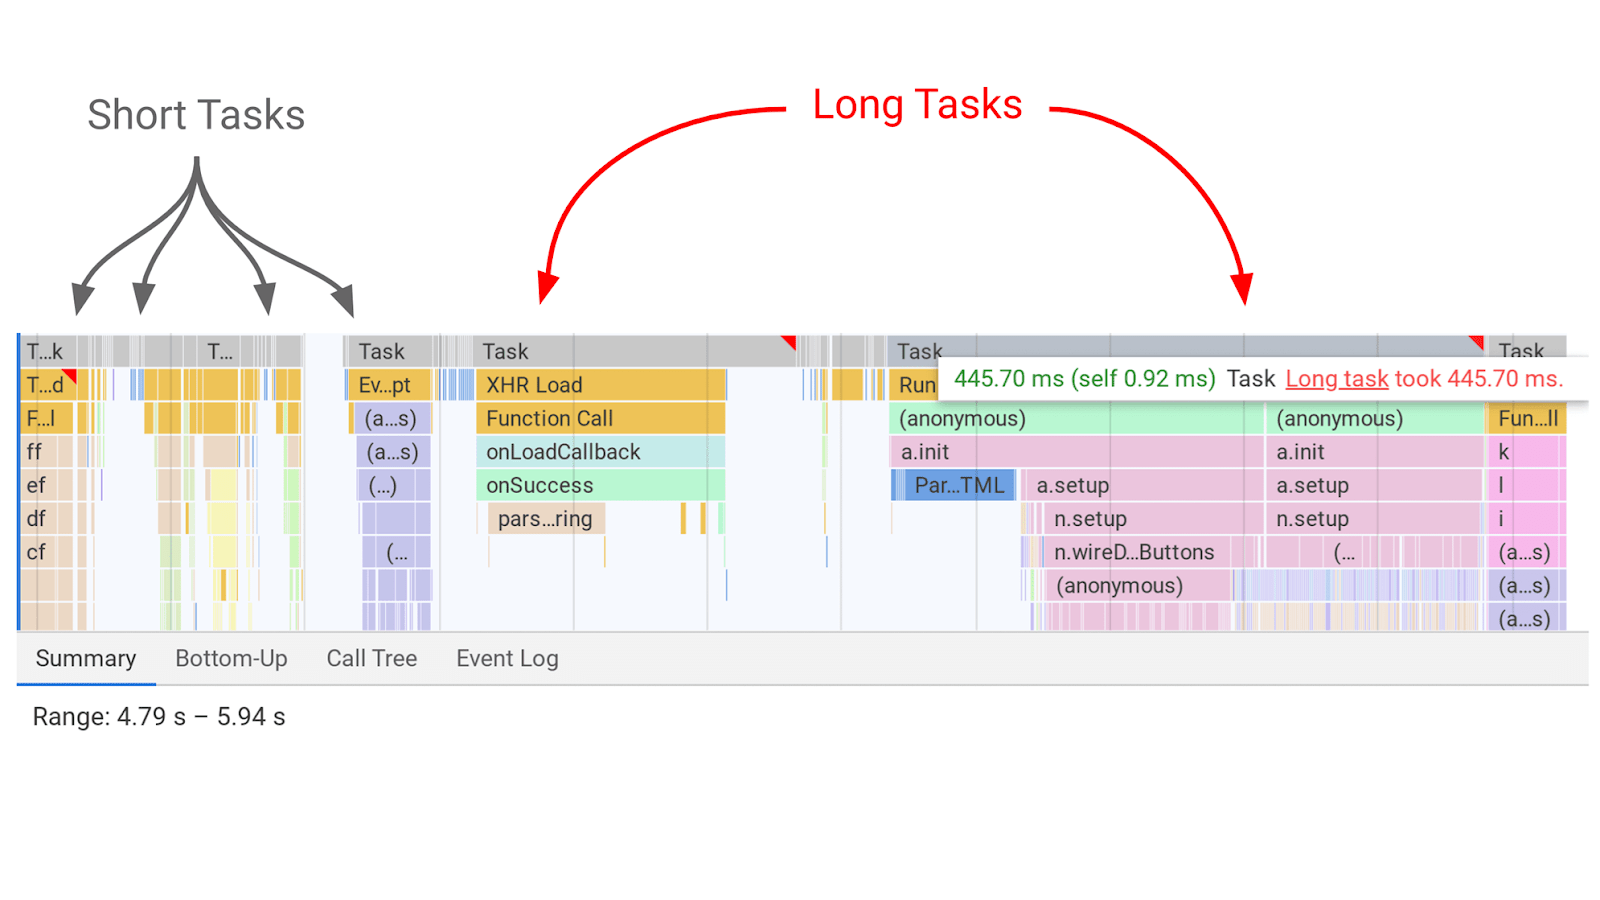
JavaScript competing for the main thread. There’s just one main thread, and JavaScript competes to run tasks on it. Think of it like JavaScript having to take turns to run.
While a task is running, a page can’t respond to user input. This is the delay that is felt. The longer the task, the longer the delay experienced by the user. The breaks between tasks are the opportunities that the page has to switch to the user input task and respond to what they wanted to do.
There are many tools you can use for testing and monitoring. Generally, you want to see the actual field data from the Chrome User Experience Report (CrUX), which is what you’ll be measured on. This data comes from real users of Chrome who opted to share their data. This dataset is accessible in a number of ways.
The numbers that really matter are the page-level numbers that you can only get from the API. These are the numbers Google will use if there’s enough data about a page, otherwise they may use the numbers from a group of similar pages for the scoring or from the whole domain. Every other tool that has page level data will be getting it from this source either directly or indirectly.
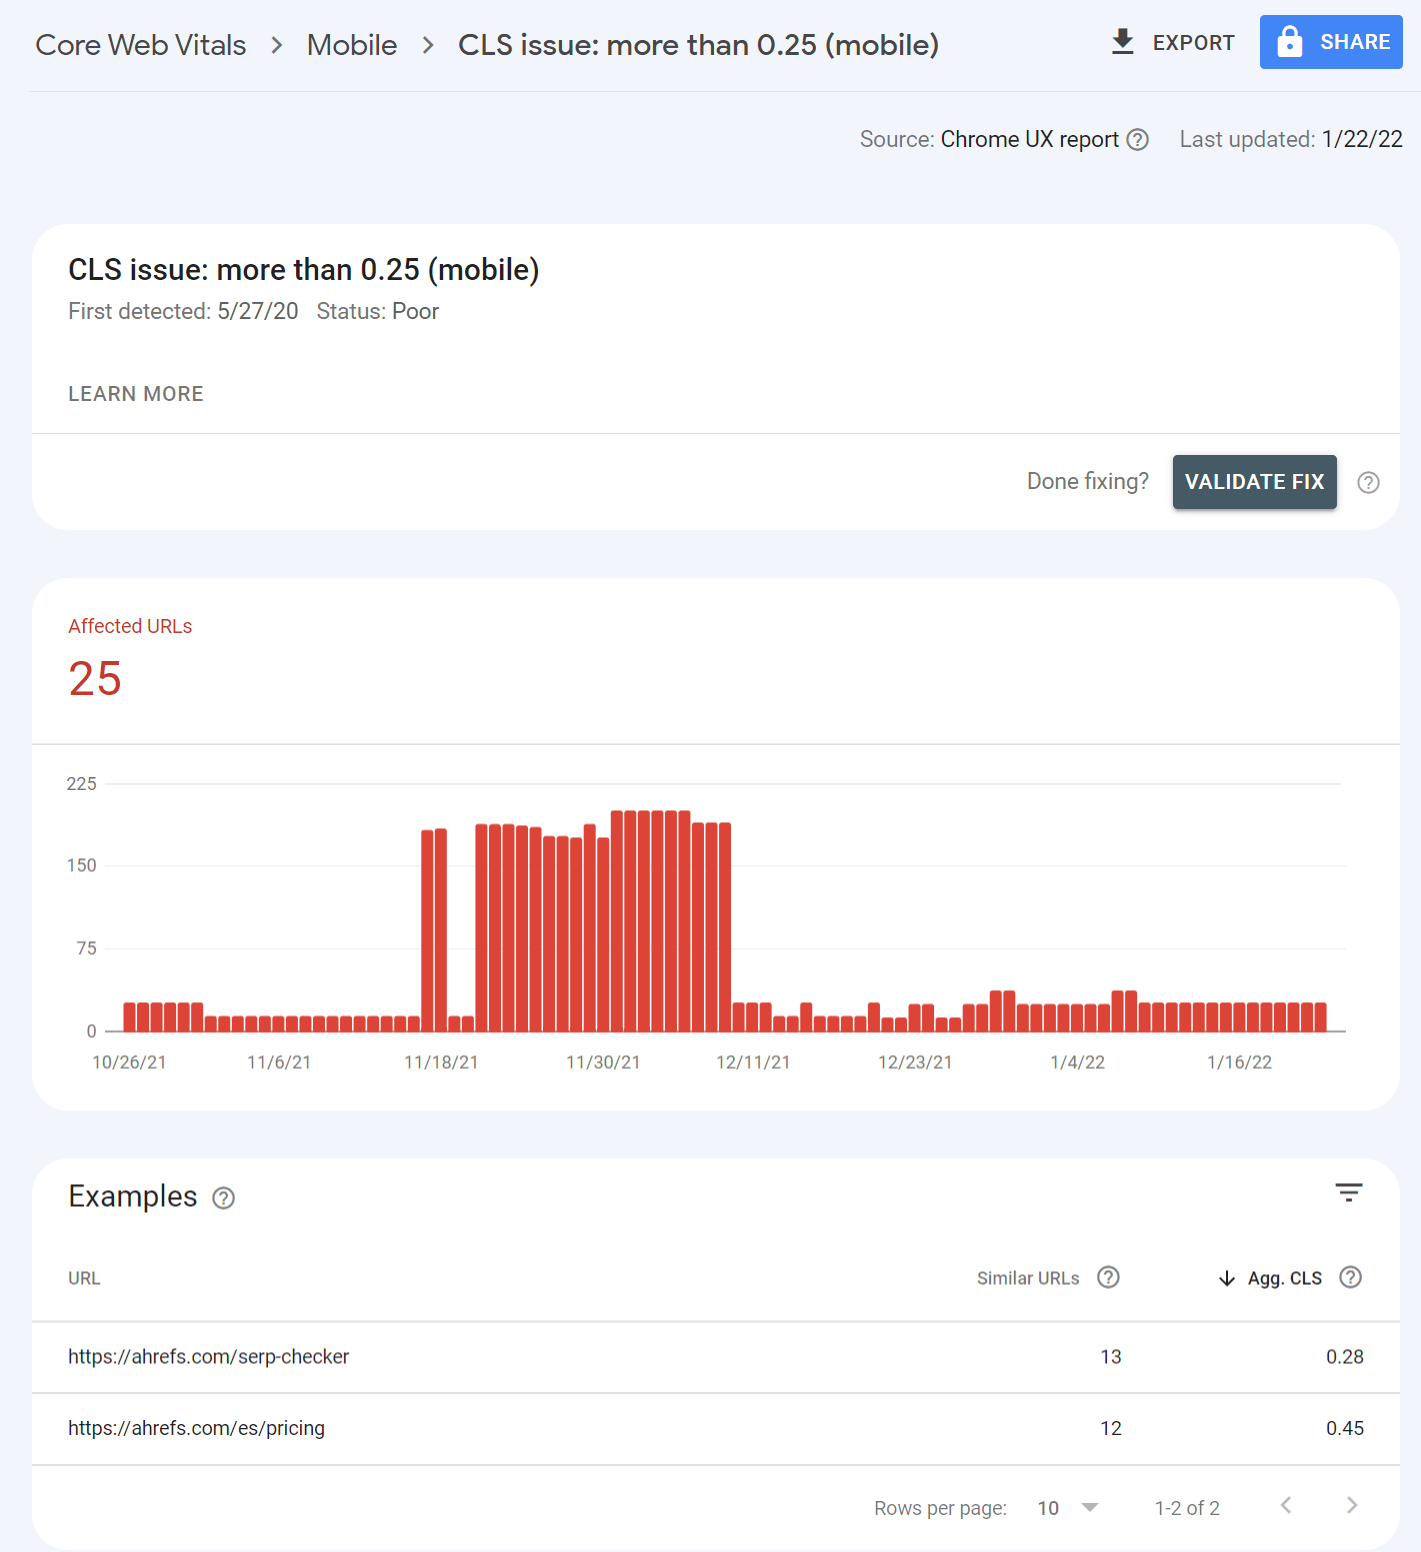
For example, Google Search Console pulls in the data and shows you how many URLs fall into each bucket.
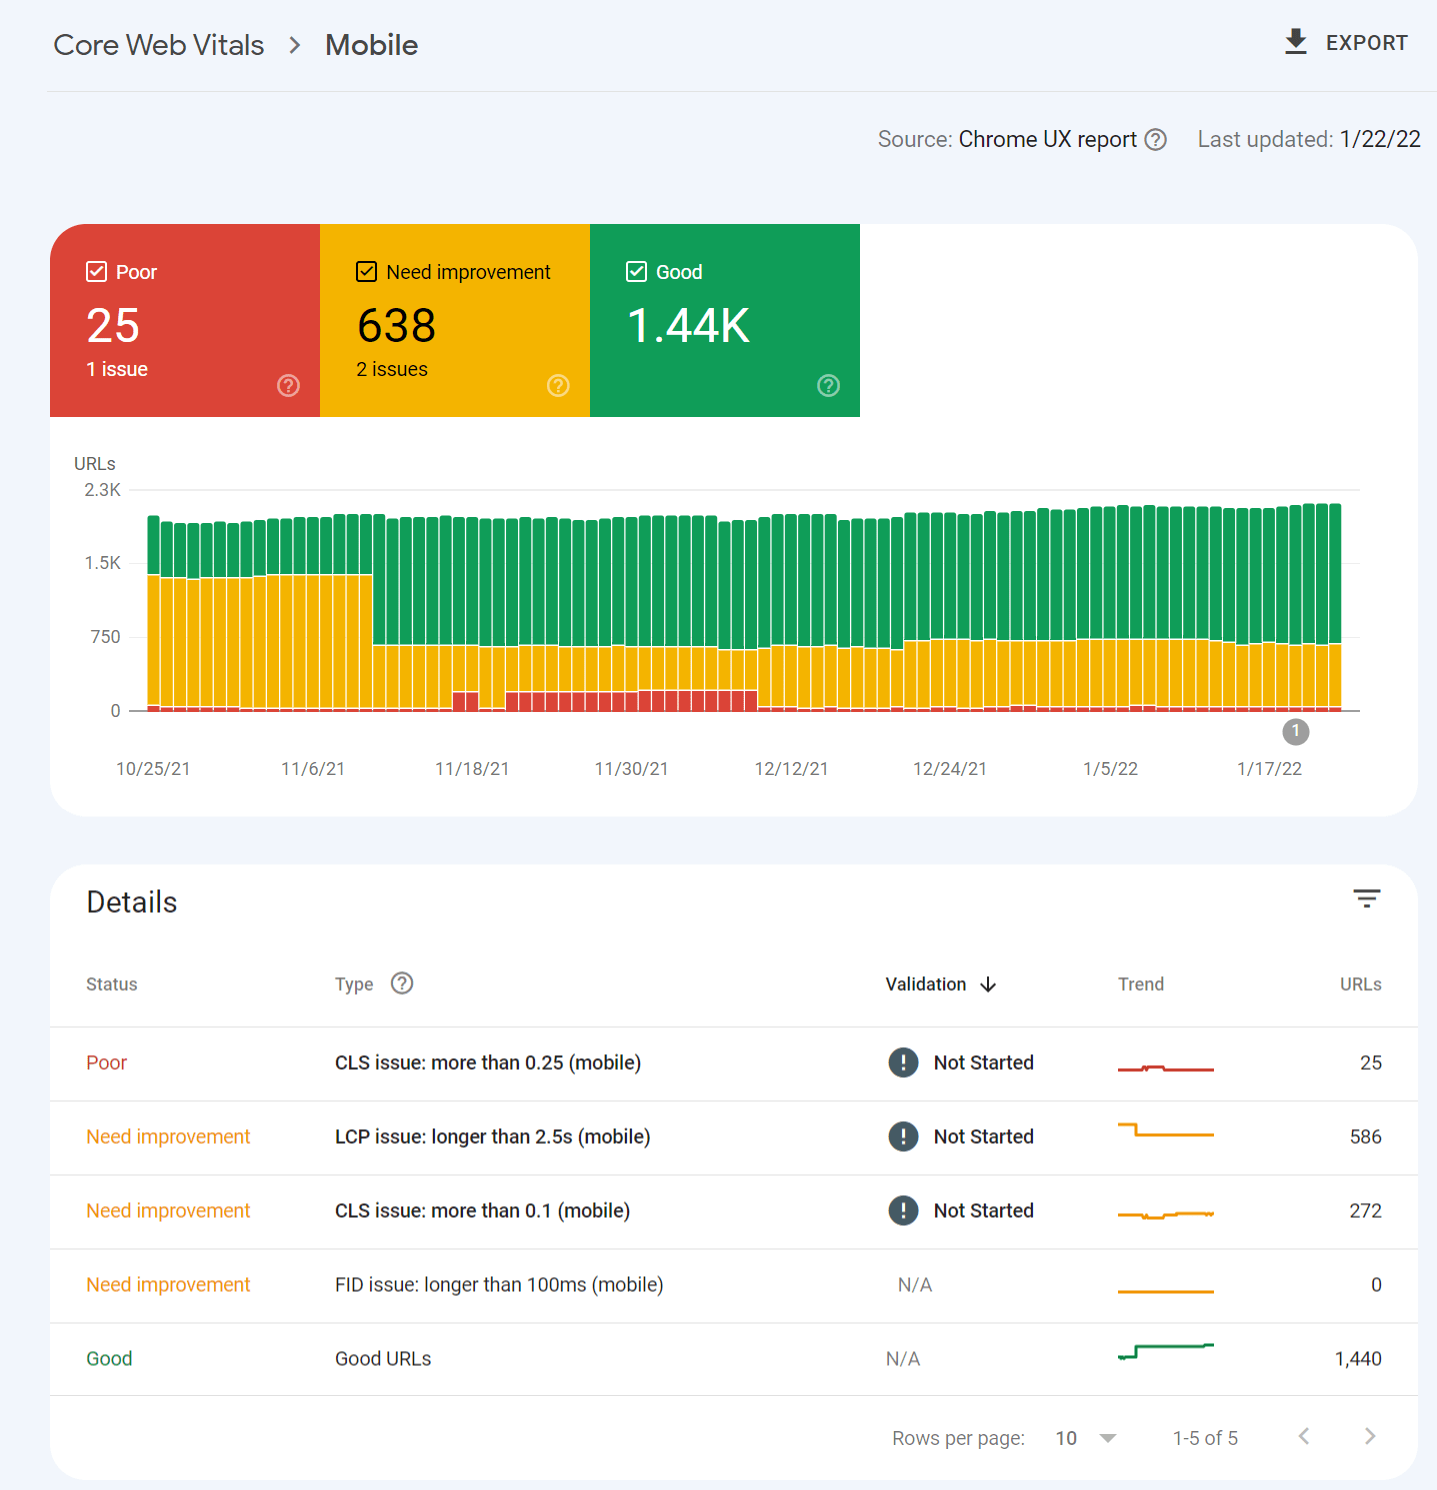
Clicking into one of the issues gives you a breakdown of page groups that are impacted. This grouping of pages makes a lot of sense. This is because most of the changes to improve Core Web Vitals are done for a particular page template that impacts many pages. You make the changes once in the template, and that will be fixed across the pages in the group.
PageSpeed Insights also pulls in the page level data, as well as origin data and lab test data which comes from Lighthouse. I’ll talk about the lab data in a minute.
PageSpeed Insights is great to check one page at a time. But if you want both lab data and field data at scale, the easiest way to get that is through their API. You can connect to it easily with Ahrefs Webmaster Tools (free) or Ahrefs’ Site Audit and get reports detailing your performance.
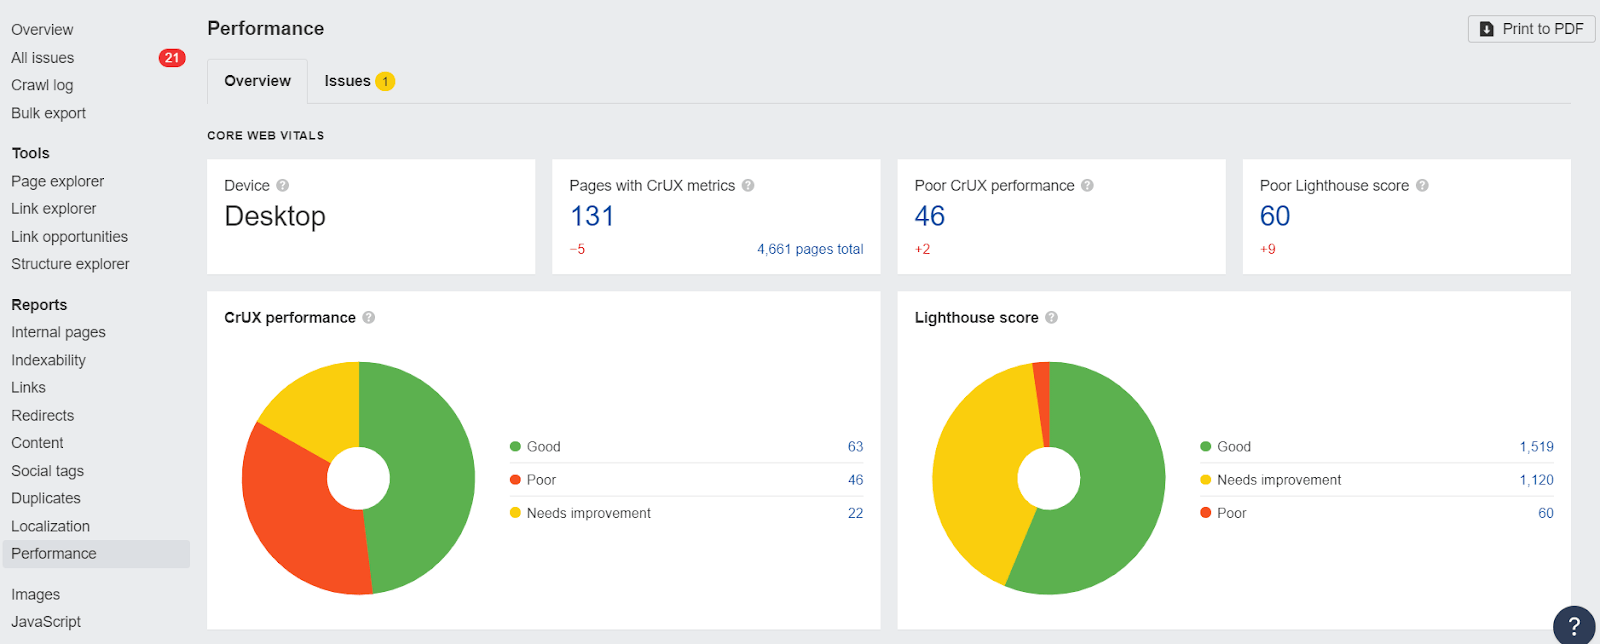
There are many tools you can use for testing and monitoring. Generally, you want to see the actual field data, which is what you’ll be measured on. But the lab data is more useful for testing.
The difference between lab and field data is that field data looks at real users, network conditions, devices, caching, etc. But lab data is consistently tested based on the same conditions to make the test results repeatable.
Many of these tools use Lighthouse as the base for their lab tests. The exception is WebPageTest, although you can also run Lighthouse tests with it as well. The field data comes from CrUX.
Note that the Core Web Vitals data shown will be determined by the user-agent you select for your crawl during the setup. If you crawl from mobile, you’ll get mobile CWV values.
Field Data vs Lab Data
The difference between lab and field data is that field data looks at real users, network conditions, devices, caching, etc. But lab data is consistently tested based on the same conditions to make the test results repeatable.
The lab test data is more useful for testing since the CWV data is on a 28 day rolling average. Any changes you make won’t be seen in the CWV data for a while but will be reflected in lab test data after the changes are made.
There are some additional tools you can use to gather your own Real User Monitoring (RUM) data. This is gathering your own field data from your own users. This kind of data can provide more immediate feedback on how speed improvements impact your actual users, rather than just relying on lab tests.
Each metric is going to take different optimizations in order to improve your overall Core Web Vitals.
How to improve LCP
As we saw in PageSpeed Insights, there are a lot of issues related to LCP. This makes LCP the hardest metric to improve. We cover a lot more details, including how to fix the issues in our Largest Contentful Paint article.
Some of the ways you can improve LCP include:
- Prioritize loading of resources
- Make files smaller
- Serve files closer to users
- Host resources on the same server
- Use caching
How to improve CLS
To optimize CLS you’re going to be working on issues related to images, fonts or, possibly, injected content. We cover a lot more details, including how to fix the issues in our Cumulative Layout Shift article.
Some of the ways you can improve CLS include:
- Reserve space for images, videos, iframes
- Optimize fonts
- Use animations that don’t trigger layout changes
- Make sure your pages are eligible for bfcache
How to improve FID
Most pages pass FID checks. But if you need to work on FID, our article on First Input Delay has more in-depth information including how to fix issues.
Some of the ways you can improve FID include:
- Reduce the amount of JavaScript
- Load JavaScript later if possible
- Break up long tasks
- Use web workers
- Use prerendering or server-side rendering (SSR)
Core Web Vitals are not a significant ranking factor. Google has over 200 ranking factors, many of which don’t carry much weight. When talking about Core Web Vitals, Google reps have referred to these as tiny ranking factors or even tiebreakers. I don’t expect much, if any, improvement in rankings from improving Core Web Vitals. Here’s what Google’s Gary Illyes had to say about them at Pubcon in September 2023.
I don’t think most sites will see a great benefit from working on Core Web Vitals (paraphrased a bit) @methode #pubcon
— Patrick Stox (@patrickstox) September 21, 2023
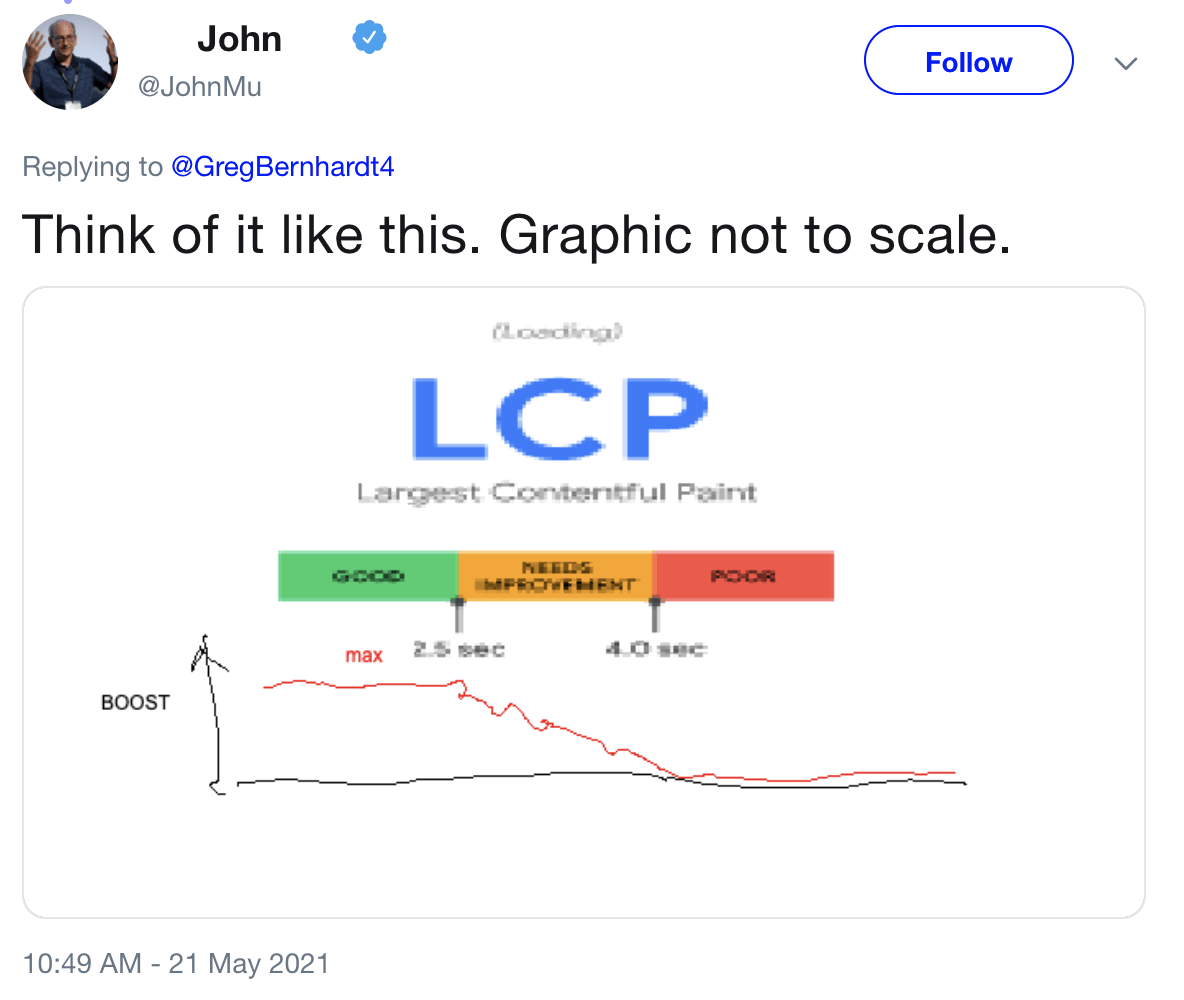
Still, they are a factor, and this tweet from Google’s John Mueller shows how the boost may work.
There have been ranking factors targeting speed metrics for many years. So I wasn’t expecting much, if any, impact to be visible when the mobile page experience update rolled out. Unfortunately, there were also a couple of Google core updates during the time frame for the Page Experience update, which makes determining the impact too messy to draw a conclusion.
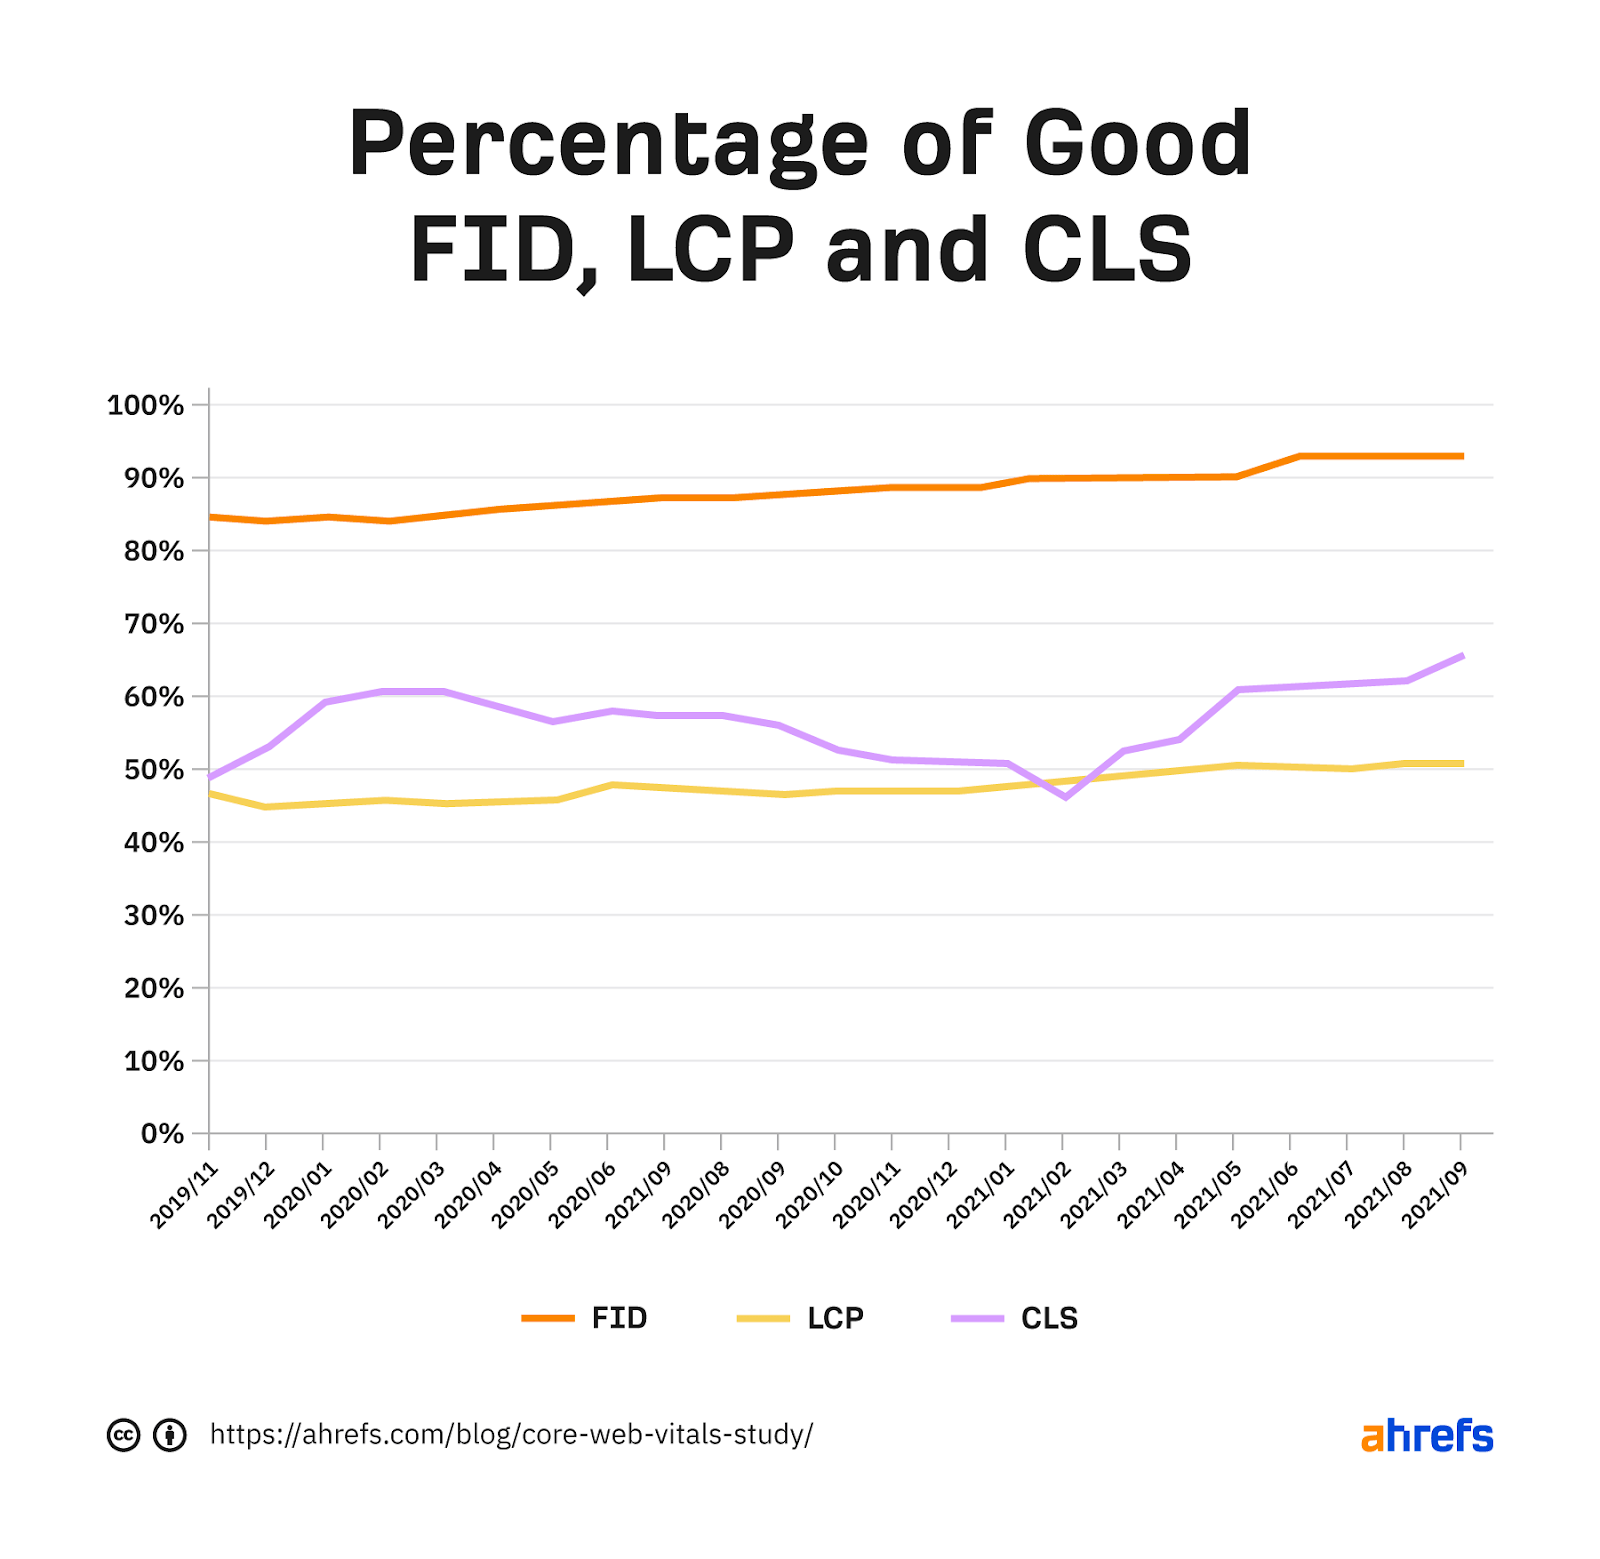
There are a couple of studies that found some positive correlation between passing Core Web Vitals and better rankings, but I personally look at these results with skepticism. It’s like saying a site that focuses on SEO tends to rank better. If a site is already working on Core Web Vitals, it likely has done a lot of other things right as well. And people did work on them, as you can see in the chart below from our data study.
Fact 1: The metrics are split between desktop and mobile. Mobile signals are used for mobile rankings, and desktop signals are used for desktop rankings.
Fact 2: The data comes from the Chrome User Experience Report (CrUX), which records data from opted-in Chrome users. The metrics are assessed at the 75th percentile of users. So if 70% of your users are in the “good” category and 5% are in the “need improvement” category, then your page will still be judged as “need improvement.”
Fact 3: The metrics are assessed for each page. But if there isn’t enough data, Google Webmaster Trends Analyst John Mueller states that signals from sections of a site or the overall site may be used. In our Core Web Vitals data study, we looked at over 42 million pages and found that only 11.4% of the pages had metrics associated with them.
Fact 4: With the addition of these new metrics, Accelerated Mobile Pages (AMP) was removed as a requirement from the Top Stories feature on mobile. Since new stories won’t actually have data on the speed metrics, it’s likely the metrics from a larger category of pages or even the entire domain may be used.
Fact 5: Single Page Applications don’t measure a couple of metrics, FID and LCP, through page transitions. There are a couple of proposed changes, including the App History API and potentially a change in the metric used to measure interactivity that would be called “Responsiveness.”
Fact 6: The metrics may change over time, and the thresholds may as well. Google has already changed the metrics used for measuring speed in its tools over the years, as well as its thresholds for what is considered fast or not.
Fact 7: There are additional Web Vitals that serve as proxy measures or supplemental metrics but are not used in the ranking calculations. The Web Vitals metrics for visual load include Time to First Byte (TTFB) and First Contentful Paint (FCP). Total Blocking Time (TBT) and Time to Interactive (TTI) help to measure interactivity.
Core Web Vitals have already changed, and there are more proposed changes to the metrics. I wouldn’t be surprised if page size was added. You can pass the current metrics by prioritizing assets and still have an extremely large page. It’s a pretty big miss, in my opinion.
Final thoughts
I don’t think Core Web Vitals have much impact on SEO and, unless you are extremely slow, I generally won’t prioritize fixing them. If you want to argue for Core Web Vitals improvements, I think that’s hard to do for SEO.
However, you can make a case for it for user experience. Improvements should help you record more data in your analytics, which “feels” like an increase. You may also be able to make a case for more conversions, as there are a lot of studies out there that show this (but it also may be a result of recording more data).
Here’s another key point: work with your developers; they are the experts here. Page speed can be extremely complex. If you’re on your own, you may need to rely on a plugin or service (e.g., WP Rocket or Autoptimize) to handle this.
Things will get easier as new technologies are rolled out and many of the platforms like your CMS, your CDN, or even your browser take on some of the optimization tasks. My prediction is that within a few years, most sites won’t even have to worry much because most of the optimizations will already be handled.
Many of the platforms are already rolling out or working on things that will help you.
Already, WordPress is preloading the first image and is putting together a team to work on Core Web Vitals. Cloudflare has already rolled out many things that will make your site faster, such as Early Hints, Signed Exchanges, and HTTP/3. I expect this trend to continue until site owners don’t even have to worry about working on this anymore.
As always, message me on Twitter if you have any questions.

