[go: up one dir, main page]
More Web Proxy on the site http://driver.im/
You seem to have javascript disabled. Please note that many of the page functionalities won't work as expected without javascript enabled.


Advances in Battery Energy Storage and Applications

Editors


E-Mail Website
Collection Editor
Institute of Sciences and Technologies for Sustainable Energy and Mobility (STEMS), National Research Council of Italy (CNR), 80125 Naples, Italy
Interests: electric vehicle; smart grid; sustainable mobility; power converters; storage systems
Special Issues, Collections and Topics in MDPI journals

grade E-Mail Website
Collection Editor
State Key Laboratory of Automotive Safety and Energy, Tsinghua University, Beijing 100084, China
Interests: safety; recycling; battery degradation

Topical Collection Information

Dear Colleagues,

Currently, the topic of battery energy storage and the applications of batteries is of great interest in the pursuit of a sustainable society. In fact, batteries and their applications are strictly interrelated: the design of new and improved batteries is stimulated by new and improved applications and vice versa. For some applications, batteries with new electrolytes or electrode materials have been specifically realized, while in others, improvements are derived from better energy storage engineering. The aim of this Topical Collection is to update the battery-powered applications and the improvements made through their batteries in terms of technological advancements.

This Topical Collection will include (but not be limited to) the following topics:

  1. Battery standards;
  2. Battery safety;
  3. Battery system design;
  4. Battery degradation;
  5. Battery fast charging;
  6. Battery manufacturing and recycling;
  7. Advanced battery characterization methods;
  8. Future batteries, i.e., solid-state batteries, lithium batteries, etc.

Dr. Ottorino Veneri
Dr. Xuning Feng
Collection Editors

Manuscript Submission Information

Manuscripts should be submitted online at www.mdpi.com by registering and logging in to this website. Once you are registered, click here to go to the submission form. Manuscripts can be submitted until the deadline. All submissions that pass pre-check are peer-reviewed. Accepted papers will be published continuously in the journal (as soon as accepted) and will be listed together on the collection website. Research articles, review articles as well as short communications are invited. For planned papers, a title and short abstract (about 100 words) can be sent to the Editorial Office for announcement on this website.

Submitted manuscripts should not have been published previously, nor be under consideration for publication elsewhere (except conference proceedings papers). All manuscripts are thoroughly refereed through a single-blind peer-review process. A guide for authors and other relevant information for submission of manuscripts is available on the Instructions for Authors page. Batteries is an international peer-reviewed open access monthly journal published by MDPI.

Please visit the Instructions for Authors page before submitting a manuscript. The Article Processing Charge (APC) for publication in this open access journal is 2700 CHF (Swiss Francs). Submitted papers should be well formatted and use good English. Authors may use MDPI's English editing service prior to publication or during author revisions.

Keywords

  • fast charging
  • degradation
  • safety
  • battery design
  • recycling
  • solid state batteries
  • electric vehicles
  • battery manager system

Published Papers (16 papers)

2025

Jump to: 2023, 2022

33 pages, 2675 KiB  
Article
Some Critical Thinking on Electric Vehicle Battery Reliability: From Enhancement to Optimization
by Jing Lin and Christofer Silfvenius
Batteries 2025, 11(2), 48; https://doi.org/10.3390/batteries11020048 - 25 Jan 2025
Viewed by 558
Abstract
Electric vehicle (EV) batteries play a crucial role in sustainable transportation, with reliability being pivotal to their performance, longevity, and environmental impact. This study explores battery reliability from micro (individual user), meso (industry), and macro (societal) perspectives, emphasizing interconnected factors and challenges across [...] Read more.
Electric vehicle (EV) batteries play a crucial role in sustainable transportation, with reliability being pivotal to their performance, longevity, and environmental impact. This study explores battery reliability from micro (individual user), meso (industry), and macro (societal) perspectives, emphasizing interconnected factors and challenges across the lifecycle. A novel lifecycle framework is proposed, introducing the concept of “Zero-Life” reliability to expand traditional evaluation methods. By integrating the reliability ecosystem with a dynamic system approach, this research offers comprehensive insights into the optimization of EV battery systems. Furthermore, an expansive Social–Industrial Large Knowledge Model (S-ILKM) is presented, bridging micro- and macro-level insights to enhance reliability across lifecycle stages. The findings provide a systematic pathway to advance EV battery reliability, aligning with global sustainability objectives and fostering innovation in sustainable mobility. Full article
Show Figures

Graphical abstract

Graphical abstract
Full article ">Figure 1
<p>The reliability ecosystem of EV batteries.</p>
Full article ">Figure 2
<p>General asset reliability lifecycle framework.</p>
Full article ">Figure 3
<p>EV battery reliability lifecycle framework with 1st, 2nd, and 3rd life added.</p>
Full article ">Figure 4
<p>EV battery reliability lifecycle framework with zero<sup>th</sup>, 1st, 2nd, and 3rd life added.</p>
Full article ">Figure 5
<p>EV battery reliability lifecycle framework including more details of a “Zero”-Life stage.</p>
Full article ">Figure 6
<p>Operational reliability: lifecycle framework of EV batteries.</p>
Full article ">Figure 7
<p>The reliability system of EV batteries: from point to System of Systems (SoS).</p>
Full article ">Figure 8
<p>Hyperplane projection and intrinsic optimization.</p>
Full article ">Figure 9
<p>Impacts of reliability inconsistency in EV batteries.</p>
Full article ">Figure 10
<p>An expansive Social–Industrial Large Knowledge Model (S-ILKM) [<a href="#B14-batteries-11-00048" class="html-bibr">14</a>].</p>
Full article ">
17 pages, 2437 KiB  
Article
A State-of-Health Estimation Method of a Lithium-Ion Power Battery for Swapping Stations Based on a Transformer Framework
by Yu Shi, Haicheng Xie, Xinhong Wang, Xiaoming Lu, Jing Wang, Xin Xu, Dingheng Wang and Siyan Chen
Batteries 2025, 11(1), 22; https://doi.org/10.3390/batteries11010022 - 11 Jan 2025
Viewed by 498
Abstract
Against the backdrop of automobile electrification, an increasing number of battery-swapping stations for electric vehicles have been launched to address the issue of slow battery charging under cold temperature conditions. However, due to the separation of the discharging and charging processes for lithium-ion [...] Read more.
Against the backdrop of automobile electrification, an increasing number of battery-swapping stations for electric vehicles have been launched to address the issue of slow battery charging under cold temperature conditions. However, due to the separation of the discharging and charging processes for lithium-ion batteries (LIBs) at swapping stations, and the circulation of batteries across different vehicles and stations, the operating data become fragmented, making it difficult to accurately identify the battery state-of-health (SOH). This study proposes a BiLSTM-Transformer framework that extracts the Constant Voltage Time (CVT) feature using only charging data, enabling the precise estimation of battery capacity degradation. Validation experiments conducted on battery samples under different operating temperatures showed that the model achieved a normalized RMSE of less than 1.6%. In ideal conditions, the normalized RMSE of the estimation reached as low as 0.11%. This model enables SOH estimation without relying on discharge data, contributing to the efficient and safe operation of battery swapping stations. Full article
Show Figures

Figure 1

Figure 1
<p>Experimental results. (<b>a</b>) Battery aging curve. (<b>b</b>) Number of cycles to 80% SOH at different temperatures. (<b>c</b>) Charging current and temperature curves at 0 °C vs. 25 °C.</p>
Full article ">Figure 2
<p>Feature analysis. (<b>a</b>) Evolution of IC curves. (<b>b</b>) Evolution of CVT curves.</p>
Full article ">Figure 3
<p>The flowchart of the deep learning method.</p>
Full article ">Figure 4
<p>Correlation analysis results of multi-feature analysis.</p>
Full article ">Figure 5
<p>Battery capacity estimation results. (<b>a</b>–<b>c</b>) are the battery capacity decay curves. (<b>d</b>) Performance of the model on battery samples.</p>
Full article ">Figure 6
<p>Comparative results for multiple types of models. (<b>a</b>) Cell #2 capacity estimation results. (<b>b</b>) Cell #5 capacity estimation results. (<b>c</b>) Cell #2 capacity estimation RMSE. (<b>d</b>) Cell #5 capacity estimation RMSE.</p>
Full article ">

2023

Jump to: 2025, 2022

15 pages, 4588 KiB  
Article
An Electrothermal Model of an NMC Lithium-Ion Prismatic Battery Cell for Temperature Distribution Assessment
by Said Madaoui, Jean-Michel Vinassa, Jocelyn Sabatier and Franck Guillemard
Batteries 2023, 9(9), 478; https://doi.org/10.3390/batteries9090478 - 21 Sep 2023
Cited by 5 | Viewed by 3772
Abstract
Charge time has become one of the primary issues restricting the development of electric vehicles. To counter this problem, an adapted thermal management system needs to be designed in order to reduce the internal thermal gradient, by predicting the surface and internal temperature [...] Read more.
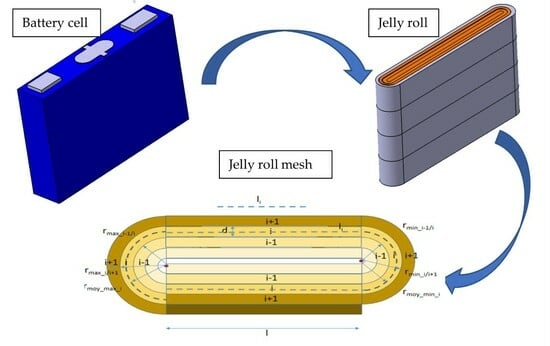
Charge time has become one of the primary issues restricting the development of electric vehicles. To counter this problem, an adapted thermal management system needs to be designed in order to reduce the internal thermal gradient, by predicting the surface and internal temperature responses of the battery. In this work, a pseudo 3D model is developed to simulate battery cell performance and its internal states under various operational scenarios such as temperature and convection conditions as well as the applied current during charge and discharge. An original mesh of the JR is proposed where heat exchanges in the three directions (radial, orthoradial and axial) are considered. The model represents one of the solutions that enable increasing the lifespan of batteries while decreasing charging time. It offers the opportunity to optimize operating parameters to extend battery life. In this paper, attention was paid not only to the core and non-core components, but also to the experiments required to parametrize the thermal and electrochemical models (heat generation). Unlike existing approaches documented in the literature, the model developed in this work achieves an impressive balance between computational efficiency and result accuracy, making it a groundbreaking contribution in the field of electric vehicle technology. Full article
Show Figures

Graphical abstract

Graphical abstract
Full article ">Figure 1
<p>The studied prismatic battery cell.</p>
Full article ">Figure 2
<p>The proposed mesh of the JR. Where <span class="html-italic">d</span> is the thickness of the mesh <span class="html-italic">i</span>, <span class="html-italic">j</span>, <span class="html-italic">l</span> the length of the JR without the rounded parts, <math display="inline"><semantics> <mrow> <msub> <mrow> <mi>r</mi> </mrow> <mrow> <mi mathvariant="italic">min</mi> <mo>⁡</mo> <mo>_</mo> <mi>i</mi> <mo>/</mo> <mi>i</mi> <mo>+</mo> <mn>1</mn> </mrow> </msub> </mrow> </semantics></math> the minimum radius of the mesh <span class="html-italic">i,j</span>, <math display="inline"><semantics> <mrow> <msub> <mrow> <mi>r</mi> </mrow> <mrow> <mi mathvariant="italic">max</mi> <mo>⁡</mo> <mo>_</mo> <mi>i</mi> <mo>/</mo> <mi>i</mi> <mo>+</mo> <mn>1</mn> </mrow> </msub> </mrow> </semantics></math> the maximum radius of the mesh <span class="html-italic">i,j</span>,<math display="inline"><semantics> <mrow> <msub> <mrow> <mo> </mo> <mi>r</mi> </mrow> <mrow> <mi>m</mi> <mi>o</mi> <mi>y</mi> <mo>_</mo> <mi mathvariant="italic">min</mi> <mo>⁡</mo> <mo>_</mo> <mi>i</mi> </mrow> </msub> </mrow> </semantics></math> the mean minimum radius of mesh <span class="html-italic">i,j</span>, <math display="inline"><semantics> <mrow> <msub> <mrow> <mi>r</mi> </mrow> <mrow> <mi>m</mi> <mi>o</mi> <mi>y</mi> <mo>_</mo> <mi mathvariant="italic">max</mi> <mo>⁡</mo> <mo>_</mo> <mi>i</mi> </mrow> </msub> </mrow> </semantics></math> the average maximum radius of mesh <span class="html-italic">i,j</span> and <span class="html-italic">dz</span> represents the height of each mesh.</p>
Full article ">Figure 3
<p>OCV as a function of SOC.</p>
Full article ">Figure 4
<p>Electrical resistance as a function of SOC and temperature.</p>
Full article ">Figure 5
<p>Entropic coefficient variation as function of SOC.</p>
Full article ">Figure 6
<p>Electrothermal model of a meshed JR.</p>
Full article ">Figure 7
<p>Mesh temperatures from the developed model.</p>
Full article ">Figure 8
<p>(<b>a</b>,<b>b</b>) Current profiles; (<b>c</b>,<b>d</b>) voltage responses; (<b>e</b>,<b>f</b>) total heat generation; (<b>g</b>,<b>h</b>) temperature responses.</p>
Full article ">Figure 8 Cont.
<p>(<b>a</b>,<b>b</b>) Current profiles; (<b>c</b>,<b>d</b>) voltage responses; (<b>e</b>,<b>f</b>) total heat generation; (<b>g</b>,<b>h</b>) temperature responses.</p>
Full article ">Figure 9
<p>The variation of reversible, irreversible and total heat generated during charging and discharging at 20 A.</p>
Full article ">Figure 10
<p>Thermal gradient assessment during charge and discharge of the battery.</p>
Full article ">
15 pages, 6423 KiB  
Article
Switched Discharge Device for Enhanced Energy Extraction from Li-Ion 18650
by Vasile Surducan and Olivia-Ramona Bruj
Batteries 2023, 9(4), 214; https://doi.org/10.3390/batteries9040214 - 1 Apr 2023
Viewed by 2395
Abstract
All autonomous electrically powered devices require a continuous power supply from batteries. Increasing the discharge performance is the top priority in the Lithium-Ion (Li-Ion) battery field and pulsed discharge is proving numerous advantages. In this paper, the maximum efficiency of pulsed discharge method [...] Read more.
All autonomous electrically powered devices require a continuous power supply from batteries. Increasing the discharge performance is the top priority in the Lithium-Ion (Li-Ion) battery field and pulsed discharge is proving numerous advantages. In this paper, the maximum efficiency of pulsed discharge method on a constant load while the cells are alternately switched with dead-time is thoroughly studied. Therefore, a novel Li-Ion charge/discharge and measurement device (SWD) using fast switching MOSFET was designed and fabricated. The device can alternately switch up to 8.3 kHz two Li-Ion 18650 batteries, generating continuous power to the programmable load and monitor the parameters that impact the capacity of the battery. An EIS (Electrochemical Impedance Spectroscopy) analysis is employed to evaluate the impedance and the behavior of the cells at frequencies up to 10 kHz. Experimental results reveal that a maximum discharge time is determined when two cells are switched at a frequency of 5.8 kHz. As a consequence, the total capacity of two switched batteries in a single discharge cycle is increased by 16.6%. Pulsed discharge efficiency is visible starting from 70% State of Charge (SOC) and is correlated with the rest time, reduced heat loss and inductance, respectively. Full article
Show Figures

Figure 1

Figure 1
<p>Nyquist equivalent circuit of Li-Ion cell used for data fitting in Ec-Lab.</p>
Full article ">Figure 2
<p>The SWD block schematic. BAT1, BAT2 = 18650 cells; S1, S2 = temperature sensors; T1, T2 = power switches, DRV1, DRV2 = gate drivers, R = current sensing resistor, A = differential amplifier, LOAD = programmable constant current active load, MICRO = microcontroller, CHARGER = CC–CV charger.</p>
Full article ">Figure 3
<p>SWD discharge set-ups for: (<b>a</b>) one Li-Ion cell in pulsed and continuous mode (<b>b</b>) two Li-Ion cells in switched and parallel mode.</p>
Full article ">Figure 4
<p>Impedance measurements: (<b>a</b>) at 100% SOC and (<b>b</b>) at 10% SOC.</p>
Full article ">Figure 5
<p>A1 cell impedance spectra for 10% step SOC values.</p>
Full article ">Figure 6
<p>High frequency equivalent circuit parameters: (<b>a</b>) R1 parameter and (<b>b</b>) L2 and R2 parameters.</p>
Full article ">Figure 7
<p>The SWD appearance during switched discharge.</p>
Full article ">Figure 8
<p>Cells A1A2, B1B2, C1C2 discharging curves; p-pulsed discharge mode, c-continuous discharge mode.</p>
Full article ">Figure 9
<p>Power surplus: continuous delivered power subtracted from pulsed delivered power (5.8 kHz) at identical discharge rate (1C-rate).</p>
Full article ">Figure 10
<p>Temperature profiles and discharge curves profiles under continuous (“c”), switched (“p”) and parallel discharge (“||c”) batteries. T: temperature, A1, A2, B1, B2, C1, C2: cells.</p>
Full article ">Figure 10 Cont.
<p>Temperature profiles and discharge curves profiles under continuous (“c”), switched (“p”) and parallel discharge (“||c”) batteries. T: temperature, A1, A2, B1, B2, C1, C2: cells.</p>
Full article ">Figure 11
<p>Measurement of the energy loss during switching. (Tektronix MSO4104 screen capture).</p>
Full article ">Figure A1
<p>Detailed electronic schematic of SWD, the key elements: T1, T2, AP6681 U1 PIC18F25K50, U2 MCP73841, U3 TSC2012, U4 MCP6022, U5 ICL7660, U6, U7 DS18B20, T7 AP6681, T8 IRF2807 on heat sink and forced air cooled.</p>
Full article ">Figure A2
<p>EIS spectrum for A1 cell.</p>
Full article ">
18 pages, 431 KiB  
Article
Efficient Reallocation of BESS in Monopolar DC Networks for Annual Operating Costs Minimization: A Combinatorial-Convex Approach
by Luis Fernando Grisales-Noreña, Oscar Danilo Montoya and Jesús C. Hernández
Batteries 2023, 9(3), 190; https://doi.org/10.3390/batteries9030190 - 22 Mar 2023
Cited by 4 | Viewed by 2071
Abstract
This article deals with the solution of a mixed-integer nonlinear programming (MINLP) problem related to the efficient reallocation of battery energy storage systems (BESS) in monopolar direct current (DC) grids through a master–slave optimization approach. The master stage solves the integer nature of [...] Read more.
This article deals with the solution of a mixed-integer nonlinear programming (MINLP) problem related to the efficient reallocation of battery energy storage systems (BESS) in monopolar direct current (DC) grids through a master–slave optimization approach. The master stage solves the integer nature of the MINLP model, which is related to the nodes where the BESS will be located. In this stage, the discrete version of the vortex search algorithm is implemented. To determine the objective function value, a recursive convex approximation is implemented to solve the nonlinear component of the MINLP model (multi-period optimal power flow problem) in the slave stage. Two objective functions are considered performance indicators regarding the efficient reallocation of BESS in monopolar DC systems. The first objective function corresponds to the expected costs of the annual energy losses, and the second is associated with the annual expected energy generation costs. Numerical results for the DC version of the IEEE 33 bus grid confirm the effectiveness and robustness of the proposed master–slave optimization approach in comparison with the solution of the exact MINLP model in the General Algebraic Modeling System (GAMS) software. The proposed master–slave optimizer was programmed in the MATLAB software. The recursive convex solution of the multi-period optimal power flow problem was implemented in the convex discipline tool (CVX) with the SDPT3 and SEDUMI solvers. The numerical reductions achieved with respect to the benchmark case in terms of energy loss costs and energy purchasing costs were 7.2091% and 3.2105%, which surpassed the results reached by the GAMS software, with reductions of about 6.0316% and 1.5736%. Full article
Show Figures

Figure 1

Figure 1
<p>Single-line diagram of the IEEE 33-node grid.</p>
Full article ">Figure 2
<p>Energy loss behavior for the benchmark case and the solution methods.</p>
Full article ">Figure 3
<p>Output generation in terminals of the substation bus.</p>
Full article ">
14 pages, 4568 KiB  
Article
Identification of Internal Short-Circuit Faults in Lithium-Ion Batteries Based on a Multi-Machine Learning Fusion
by Guangying Zhu, Tao Sun, Yuwen Xu, Yuejiu Zheng and Long Zhou
Batteries 2023, 9(3), 154; https://doi.org/10.3390/batteries9030154 - 28 Feb 2023
Cited by 12 | Viewed by 4313
Abstract
Internal short-circuit (ISC) faults are a common cause of thermal runaway in lithium-ion batteries (LIBs), which greatly endangers the safety of LIBs. Different LIBs have common features related to ISC faults. Due to the insufficient volume of acquired ISC fault data, conventional machine [...] Read more.
Internal short-circuit (ISC) faults are a common cause of thermal runaway in lithium-ion batteries (LIBs), which greatly endangers the safety of LIBs. Different LIBs have common features related to ISC faults. Due to the insufficient volume of acquired ISC fault data, conventional machine learning models could not effectively identify ISC faults. To compensate for the above deficiencies, this paper proposes a multi-machine learning fusion method to predict ISC faults and to perform faults warning classification under multiple operating conditions using the input of voltage normalization. Firstly, learning data acquisition is captured by experiments and simulation. Secondly, the simulation data are inputted into the ResNet-convolutional neural network (CNN) for pretraining, followed by the transfer learning method to freeze parts of the model layers in the CNN, and part of the experimental data are also inputted into the CNN model for parameter fine-tuning to build a multi-machine learning model. Finally, the degree of ISC faults within the laboratory battery is predicted based on the multi-machine learning model. The results show that the CNN model had a 99.9% prediction accuracy on the simulated dataset, and the multi-machine learning fusion model after transfer learning had a 96.67% prediction accuracy on the laboratory battery dataset, which can accurately identify different levels of ISC faults in batteries and realize the graded warning of ISC faults. Full article
Show Figures

Figure 1

Figure 1
<p>Simulation experiments of ISC faults within the battery module.</p>
Full article ">Figure 2
<p>First-order RC equivalent circuit model.</p>
Full article ">Figure 3
<p>Simulation of current working conditions.</p>
Full article ">Figure 4
<p>Simulated voltage curve of ISC. (<b>a</b>) ISC resistance of 30 Ω; (<b>b</b>) ISC resistance of 161 Ω.</p>
Full article ">Figure 5
<p>The architecture diagram of the ISC fault identification method based on the multi-machine learning fusion model.</p>
Full article ">Figure 6
<p>Schematic diagram of the ResNet 101 layer network structure after modification.</p>
Full article ">Figure 7
<p>Multi-machine learning model architecture.</p>
Full article ">Figure 8
<p>Normalized voltage curves: (<b>a</b>) ISC resistance of 30 Ω; and (<b>b</b>) ISC resistance of 161 Ω.</p>
Full article ">Figure 9
<p>Fault classification prediction results of battery simulation data test set.</p>
Full article ">Figure 10
<p>The laboratory battery pack voltage characteristic curve with an ISC resistance of 10 Ω: (<b>a</b>) Voltage curve of ISC; and (<b>b</b>) Normalized voltage curve.</p>
Full article ">Figure 11
<p>ResNet-CNN model prediction results of ISC fault classification for the experimental battery data.</p>
Full article ">Figure 12
<p>ISC fault classification prediction results with multiple machine learning models for experimental battery data.</p>
Full article ">
18 pages, 551 KiB  
Article
An Efficient EMS for BESS in Monopolar DC Networks with High Penetration of Renewable Generation: A Convex Approximation
by Luis Fernando Grisales-Noreña, Oscar Danilo Montoya and Jesus C. Hernández
Batteries 2023, 9(2), 84; https://doi.org/10.3390/batteries9020084 - 26 Jan 2023
Cited by 10 | Viewed by 2483
Abstract
This research presents an efficient energy management system (EMS) for battery energy storage systems (BESS) connected to monopolar DC distribution networks which considers a high penetration of photovoltaic generation. The optimization model that expresses the EMS system with the BESS and renewable generation [...] Read more.
This research presents an efficient energy management system (EMS) for battery energy storage systems (BESS) connected to monopolar DC distribution networks which considers a high penetration of photovoltaic generation. The optimization model that expresses the EMS system with the BESS and renewable generation can be classified as a nonlinear programming (NLP) model. This study reformulates the NLP model as a recursive convex approximation (RCA) model. The proposed RCA model is developed by applying a linear approximation for the voltage magnitudes only at nodes that include constant power loads. The nodes with BESS and renewables are approximated through the relaxation of their voltage magnitude. Numerical results obtained in the monopolar version of a 33-bus system, which included three generators and three BESS, demonstrate the effectiveness of the RCA reformulation when compared to the solution of the exact NLP model via combinatorial optimization techniques. Additional simulations considering wind power and diesel generators allow one to verify the effectiveness of the proposed RCA in dealing with the efficient operation of distributed energy resources in monopolar DC networks via recursive convex programming. Full article
Show Figures

Figure 1

Figure 1
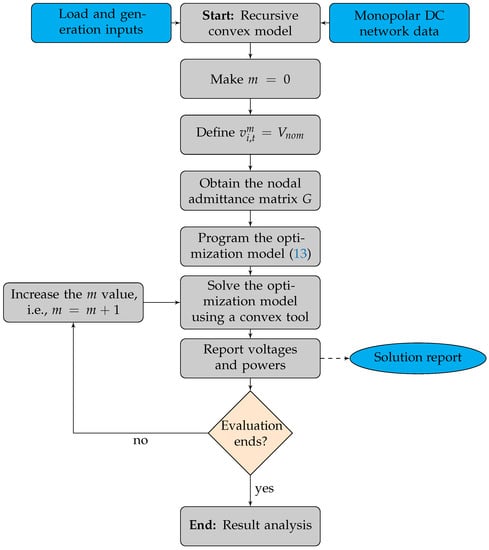
<p>Recursive solution approach for the optimization model (<a href="#FD13-batteries-09-00084" class="html-disp-formula">13</a>).</p>
Full article ">Figure 2
<p>Average daily power generation and demand for the Medellín parametrized network.</p>
Full article ">Figure 3
<p>Electrical configuration of the IEEE 33-bus grid for monopolar DC studies.</p>
Full article ">Figure 4
<p>Behavior of the aggregated daily demand and generation profiles.</p>
Full article ">Figure 5
<p>Evolution of the error in the proposed recursive approximation method in all the simulated scenarios.</p>
Full article ">Figure 6
<p>Modified version of the IEEE 33-bus grid for wind, diesel, PV, and batteries.</p>
Full article ">

2022

Jump to: 2025, 2023

12 pages, 2308 KiB  
Article
Capacity Fading Rules of Lithium-Ion Batteries for Multiple Thermoelectric Aging Paths
by Jiuyu Du, Wenbo Wang, Zhixin Wei, Fangfang Hu and Xiaogang Wu
Batteries 2023, 9(1), 3; https://doi.org/10.3390/batteries9010003 - 21 Dec 2022
Cited by 3 | Viewed by 4341
Abstract
The ambient temperature and charging rate are the two most important factors that influence the capacity deterioration of lithium-ion batteries. Differences in temperature for charge–discharge conditions significantly impact the battery capacity, particularly under high-stress conditions, such as ultrafast charging. The combined negative effects [...] Read more.
The ambient temperature and charging rate are the two most important factors that influence the capacity deterioration of lithium-ion batteries. Differences in temperature for charge–discharge conditions significantly impact the battery capacity, particularly under high-stress conditions, such as ultrafast charging. The combined negative effects of the ambient temperature and a high charging rate on the capacity of a lithium-ion battery require further research. Here, multiple scenarios of different temperatures and charging rates were considered to examine their influence on battery capacity deterioration, focusing on the effect of high charging rates above 2 C. Three test temperatures and three charging rates were selected, and experiments were performed to evaluate the battery capacity over several charge–discharge cycles. A comparative analysis was performed on the capacity, impedance, and probability density function (PDF). The results showed that increasing the charging rate delayed the response of the phase change reaction to the voltage, which accelerated the corresponding capacity deterioration. At high charging rates, the main causes of capacity deterioration were the loss of active lithium in the battery and the loss of active material from the negative electrode. Most of the product from the side reaction between the lithium coating and electrolyte remained in the electrolyte and had no evident effect on impedance. Therefore, high charging rates significantly increase the temperature of the battery, and a high charging rate and temperature exert a coupled negative effect on the battery capacity. Thermal management strategies for lithium-ion batteries must comprehensively optimize the temperature and charging rate in real time. Full article
Show Figures

Figure 1

Figure 1
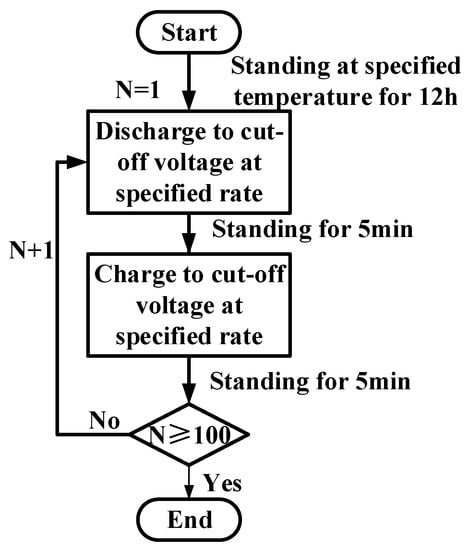
<p>Flowchart of the charge–discharge cycle test with different aging paths.</p>
Full article ">Figure 2
<p>Flowchart of the basic performance tests for the battery.</p>
Full article ">Figure 3
<p>Voltage–current curve during the basic performance tests.</p>
Full article ">Figure 4
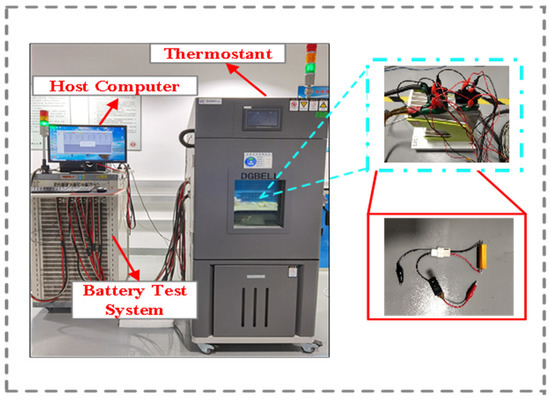
<p>Experimental platform for evaluating the battery-aging characteristics.</p>
Full article ">Figure 5
<p>Capacity deterioration of the battery in different aging paths.</p>
Full article ">Figure 6
<p>Changes in the DCIR with a full SOC.</p>
Full article ">Figure 7
<p>Changes in the DCIR with different aging paths.</p>
Full article ">Figure 8
<p>PDF curves at different temperatures and charging rates. (<b>a</b>) PDF curves at 10 °C and 2C charging rate; (<b>b</b>) PDF curves at 30 °C and 2C charging rate; (<b>c</b>) PDF curves at 50 °C and 2C charging rate; (<b>d</b>) PDF curves at 30 °C and 3C charging rate; (<b>e</b>) PDF curves at 30 °C and 4C charging rate.</p>
Full article ">Figure 9
<p>Changes in the PDF curves. (<b>a</b>) Change in PDF curve during cycle at 10 °C and 2C charge rates; (<b>b</b>) Change in PDF curve during cycle at 10 °C and 3C charge rates; (<b>c</b>) Change in PDF curve during cycle at 10 °C and 4C charge rates; (<b>d</b>) Change in PDF curve during cycle at 30 °C and 2C charge rates; (<b>e</b>) Change in PDF curve during cycle at 30 °C and 3C charge rates; (<b>f</b>) Change in PDF curve during cycle at 30 °C and 4C charge rates; (<b>g</b>) Change in PDF curve during cycle at 50 °C and 2C charge rates; (<b>h</b>) Change in PDF curve during cycle at 50 °C and 3C charge rates; (<b>i</b>) Change in PDF curve during cycle at 50 °C and 4C charge rates.</p>
Full article ">
17 pages, 3276 KiB  
Article
Experimental Study on Thermal Runaway Behavior of Lithium-Ion Battery and Analysis of Combustible Limit of Gas Production
by Xinwei Yang, Hewu Wang, Minghai Li, Yalun Li, Cheng Li, Yajun Zhang, Siqi Chen, Hengjie Shen, Feng Qian, Xuning Feng and Minggao Ouyang
Batteries 2022, 8(11), 250; https://doi.org/10.3390/batteries8110250 - 21 Nov 2022
Cited by 29 | Viewed by 7245
Abstract
Lithium-ion batteries (LIBs) are widely used in electric vehicles (EV) and energy storage stations (ESS). However, combustion and explosion accidents during the thermal runaway (TR) process limit its further applications. Therefore, it is necessary to investigate the uncontrolled TR exothermic reaction for safe [...] Read more.
Lithium-ion batteries (LIBs) are widely used in electric vehicles (EV) and energy storage stations (ESS). However, combustion and explosion accidents during the thermal runaway (TR) process limit its further applications. Therefore, it is necessary to investigate the uncontrolled TR exothermic reaction for safe battery system design. In this study, different LIBs are tested by lateral heating in a closed experimental chamber filled with nitrogen. Moreover, the relevant thermal characteristic parameters, gas composition, and deflagration limit during the battery TR process are calculated and compared. Results indicate that the TR behavior of NCM batteries is more severe than that of LFP batteries, and the TR reactions becomes more severe with the increase of energy density. Under the inert atmosphere of nitrogen, the primarily generated gases are H2, CO, CO2, and hydrocarbons. The TR gas deflagration limits and characteristic parameter calculations of different cathode materials are refined and summarized, guiding safe battery design and battery selection for power systems. Full article
Show Figures

Figure 1

Figure 1
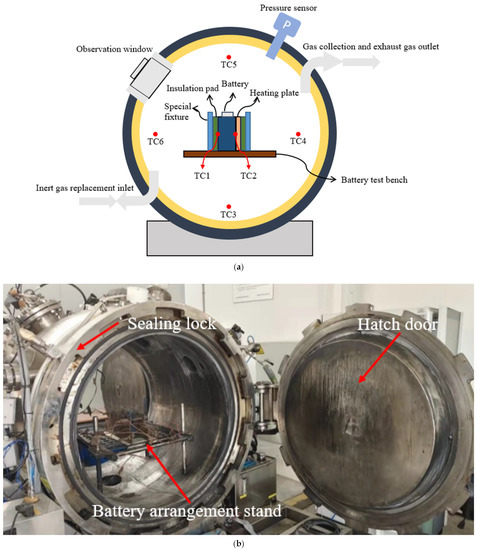
<p>Pictures of experimental cabin. (<b>a</b>) Structure diagram of experimental cabin. (<b>b</b>) Physical picture of experimental cabin.</p>
Full article ">Figure 2
<p>Layout diagram of the experimental battery. (<b>a</b>) Schematic diagram of experimental arrangement. (<b>b</b>) The layout of the experiment. (<b>c</b>) Voltage measurement wiring diagram.</p>
Full article ">Figure 2 Cont.
<p>Layout diagram of the experimental battery. (<b>a</b>) Schematic diagram of experimental arrangement. (<b>b</b>) The layout of the experiment. (<b>c</b>) Voltage measurement wiring diagram.</p>
Full article ">Figure 3
<p>Battery surface temperature and voltage record. (<b>a</b>) Sample surface temperature and voltage changes. (<b>b</b>) Voltage change curve.</p>
Full article ">Figure 4
<p>Voltage change rate.</p>
Full article ">Figure 5
<p>Gas production composition and volume percentage of four samples. (<b>a</b>) Sample No.1 (NCM622). (<b>b</b>) Sample No.2 (NCM811). (<b>c</b>) Sample No. 3 (NCM9/0.5/0.5). (<b>d</b>) Sample No. 4 (LFP).</p>
Full article ">Figure 6
<p>Normalized results of each component gas.</p>
Full article ">Figure 7
<p>Relationship between CO concentration and battery energy density.</p>
Full article ">Figure 8
<p>Relationship between H<sub>2</sub> concentration and battery energy density.</p>
Full article ">Figure 9
<p>Normalization results of gas production.</p>
Full article ">Figure 10
<p>Flammability limit of gas after thermal runaway.</p>
Full article ">
28 pages, 4239 KiB  
Review
A Review of Lithium-Ion Battery Failure Hazards: Test Standards, Accident Analysis, and Safety Suggestions
by Xin Lai, Jian Yao, Changyong Jin, Xuning Feng, Huaibin Wang, Chengshan Xu and Yuejiu Zheng
Batteries 2022, 8(11), 248; https://doi.org/10.3390/batteries8110248 - 20 Nov 2022
Cited by 69 | Viewed by 17640
Abstract
The frequent safety accidents involving lithium-ion batteries (LIBs) have aroused widespread concern around the world. The safety standards of LIBs are of great significance in promoting usage safety, but they need to be constantly upgraded with the advancements in battery technology and the [...] Read more.
The frequent safety accidents involving lithium-ion batteries (LIBs) have aroused widespread concern around the world. The safety standards of LIBs are of great significance in promoting usage safety, but they need to be constantly upgraded with the advancements in battery technology and the extension of the application scenarios. This study comprehensively reviews the global safety standards and regulations of LIBs, including the status, characteristics, and application scope of each standard. A standardized test for thermal runaway triggering is also introduced. The recent fire accidents in electric vehicles and energy storage power stations are discussed in relation to the upgrading of the rational test standards. Finally, the following four suggestions for improving battery safety are proposed to optimize the safety standards: (1) early warning and cloud alarms for the battery’s thermal runaway; (2) an innovative structural design for a no-fire battery pack; (3) the design of a fire water injection interface for the battery pack; (4) the design of an immersive energy storage power station. This study provides insights for promoting the effectiveness of relevant safety standards for LIBs, thereby reducing the failure hazards. Full article
Show Figures

Figure 1

Figure 1
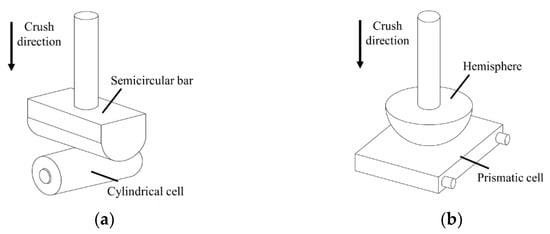
<p>Schematic diagram of the crush test: (<b>a</b>) cylindrical cell; (<b>b</b>) prismatic cell.</p>
Full article ">Figure 2
<p>Schematic diagram of the crushing plate: (<b>a</b>) form 1; (<b>b</b>) form 2.</p>
Full article ">Figure 3
<p>Trigger methods: (<b>a</b>) needling; (<b>b</b>) heating; (<b>c</b>) overcharge.</p>
Full article ">Figure 4
<p>Investigation of EV fire accidents: (<b>a</b>) the number of EVs and fire accidents, with incomplete statistics; (<b>b</b>) the number of fire accidents per month in 2021; (<b>c</b>) fire accident photos; (<b>d</b>) the vehicle status at the time of the fire accident.</p>
Full article ">Figure 5
<p>The main process of an EV fire accident.</p>
Full article ">Figure 6
<p>Fire accident at energy storage power stations: (<b>a</b>) Beijing; (<b>b</b>) Arizona.</p>
Full article ">Figure 7
<p>Comparison of fire accidents in EVs and energy storage power stations.</p>
Full article ">Figure 8
<p>Structure design of a no-fire battery pack.</p>
Full article ">Figure 9
<p>Structure design of a firewater injection port for EVs.</p>
Full article ">Figure 10
<p>Immersive firefighting design for energy storage.</p>
Full article ">
15 pages, 3884 KiB  
Article
Lithium Plating Detection Based on Electrochemical Impedance and Internal Resistance Analyses
by Yue Pan, Dongsheng Ren, Xuebing Han, Languang Lu and Minggao Ouyang
Batteries 2022, 8(11), 206; https://doi.org/10.3390/batteries8110206 - 2 Nov 2022
Cited by 9 | Viewed by 5410
Abstract
Lithium plating, induced by fast charging and low-temperature charging, is one of the reasons for capacity fading and causes safety problems for lithium-ion batteries. Hence, reliable and effective non-destructive detection methods for lithium plating are needed. In this research, electrochemical impedance and internal [...] Read more.
Lithium plating, induced by fast charging and low-temperature charging, is one of the reasons for capacity fading and causes safety problems for lithium-ion batteries. Hence, reliable and effective non-destructive detection methods for lithium plating are needed. In this research, electrochemical impedance and internal resistance for batteries are measured during the rest period after charging. The results for lithium plating batteries and normal batteries are compared and analyzed. Lithium plating detection is realized with multiple indicators extracted from electrochemical impedance and internal resistance results. The effectiveness of the proposed detection methods is verified by the experiments conducted with commercial large-capacity batteries. The proposed methods have further potential to be used in battery management systems to realize online detection of lithium plating and improve the safety of battery systems. Full article
Show Figures

Figure 1

Figure 1
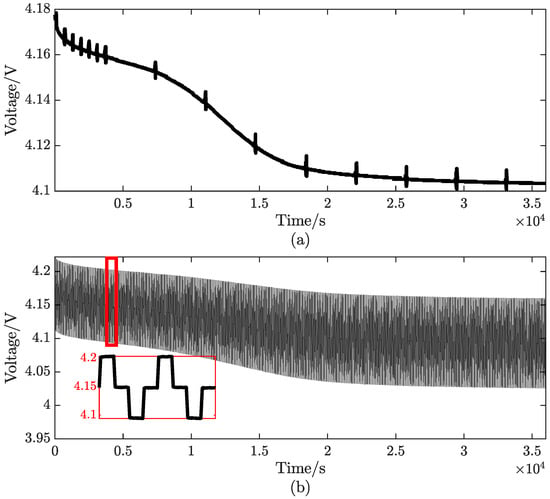
<p>Voltage profiles with (<b>a</b>) electrochemical impedance and (<b>b</b>) internal resistance measurement.</p>
Full article ">Figure 2
<p>The electrochemical impedance spectrum of (<b>a</b>) experiment #1-1; (<b>b</b>) experiment #1-2; (<b>c</b>) experiment #1-3; (<b>d</b>) experiment #1-4.</p>
Full article ">Figure 3
<p>The DRT results of (<b>a</b>) experiment #1-1; (<b>b</b>) experiment #1-2; (<b>c</b>) experiment #1-3; (<b>d</b>) experiment #1-4.</p>
Full article ">Figure 4
<p>The impedance values at different frequencies of (<b>a</b>) experiment #1-1; (<b>b</b>) experiment #1-2; (<b>c</b>) experiment #1-3; (<b>d</b>) experiment #1-4.</p>
Full article ">Figure 5
<p>The internal resistance results of (<b>a</b>) experiment #2-1; (<b>b</b>) experiment #2-2; (<b>c</b>) experiment #2-3; (<b>d</b>) experiment #2-4.</p>
Full article ">Figure 6
<p>The electrochemical impedance changes <span class="html-italic">δ</span>|<span class="html-italic">Z</span>| of experiment group1 at (<b>a</b>) 0.1 Hz; (<b>b</b>) 1 Hz; (<b>c</b>) around 10 Hz; (<b>d</b>) around 100 Hz; (<b>e</b>) around 1000 Hz.</p>
Full article ">Figure 7
<p>The internal resistance and voltage result. (<b>a</b>) Original and filtered internal resistance curve of experiment #2-2; (<b>b</b>) Original and filter voltage curve of experiment #2-2; (<b>c</b>) Normalized internal resistance <span class="html-italic">R</span><sub>Norm</sub> curves; (<b>d</b>) Relaxation voltage curves; (<b>e</b>) <span class="html-italic">dR/dt</span> curves; (<b>f</b>) <span class="html-italic">dV/dt</span> curves.</p>
Full article ">Figure 8
<p>The difference of <span class="html-italic">R</span><sub>Norm</sub> and <span class="html-italic">dR/dt</span> between normal battery and lithium plating battery. (<b>a</b>) <span class="html-italic">R</span><sub>Norm</sub> difference; (<b>b</b>) The minimum of <span class="html-italic">R</span><sub>Norm</sub> difference versus capacity change ratio; (<b>c</b>) <span class="html-italic">dR/dt</span> difference; (<b>d</b>) The minimum of <span class="html-italic">dR/dt</span> difference versus capacity change ratio.</p>
Full article ">Figure A1
<p>The electrochemical impedance spectrum of (<b>a</b>) experiment #1-1; (<b>b</b>) experiment #1-2; (<b>c</b>) experiment #1-3; (<b>d</b>) experiment #1-4.</p>
Full article ">
17 pages, 5776 KiB  
Article
Study on Thermal Runaway Behavior of Li-Ion Batteries Using Different Abuse Methods
by Dan Wei, Mengqi Zhang, Linpei Zhu, Hu Chen, Wensheng Huang, Jian Yao, Zhuchen Yuan, Chengshan Xu and Xuning Feng
Batteries 2022, 8(11), 201; https://doi.org/10.3390/batteries8110201 - 31 Oct 2022
Cited by 30 | Viewed by 7404
Abstract
Thermal runaway (TR) and the thermal runaway propagation (TRP) of Li-ion batteries can lead to safety incidents and cause explosion or fire accidents. Therefore, TR is a critical issue for the thermal safety of Li-ion batteries. In this study, the TR and TRP [...] Read more.
Thermal runaway (TR) and the thermal runaway propagation (TRP) of Li-ion batteries can lead to safety incidents and cause explosion or fire accidents. Therefore, TR is a critical issue for the thermal safety of Li-ion batteries. In this study, the TR and TRP behavior of Li-ion batteries using different abuse methods (nail penetration, side heating, and overcharge) was investigated experimentally. First, the Extended Volume Accelerating Rate Calorimetry (EV-ARC) test was performed using the cell with an internal implantation thermocouple for a comparative study. Three abuse methods were used to induce TR and TRP for the cells and modules. At the cell level, the maximum temperature inside the cell under the EV-ARC test, nail penetration, and side-heating abuse was 994.8 °C, 964.3 °C, and 1020 °C, respectively. The thermocouple inside the cell under the overcharge abuse test was broken, and the experimental phenomenon indicated that the cell was most severely damaged under the overcharging abuse test. At the module level, the TRP behavior using the three abuse methods was different than in the first two TR cells, while the behavior of the other cells was similar. It was evidenced that TRP triggered by the overcharge abuse was the most hazardous, followed by the side-heating abuse, and lastly, the nail-penetration abuse was the least. Full article
Show Figures

Figure 1

Figure 1
<p>Process on thermocouple implantation. (<b>a</b>) Discharge; (<b>b</b>) drill the hole; (<b>c</b>) open access; (<b>d</b>) inserting the thermocouple; (<b>e</b>) gluing the thermocouple; (<b>f</b>) charge.</p>
Full article ">Figure 2
<p>Experimental setup for EV-ARC test. (<b>a</b>) EV-ARC; (<b>b</b>) EV-ARC chamber; (<b>c</b>) Schematic of thermocouple position.</p>
Full article ">Figure 3
<p>Nail-penetration abuse test. (<b>a</b>) cell test; (<b>b</b>) module test.</p>
Full article ">Figure 4
<p>Side-heating abuse test. (<b>a</b>) cell test; (<b>b</b>) module test.</p>
Full article ">Figure 5
<p>Overcharge abuse test. (<b>a</b>) cell test; (<b>b</b>) module test.</p>
Full article ">Figure 6
<p>TR characterization of cell under EV-ARC test.</p>
Full article ">Figure 7
<p>Internal temperature and voltage of the cell.</p>
Full article ">Figure 8
<p>Wreckage of the cell after EV-ARC test.</p>
Full article ">Figure 9
<p>TR characterization of cell under different abuse tests. (<b>a</b>) Nail penetration; (<b>b</b>) Side heating; (<b>c</b>) Overcharge.</p>
Full article ">Figure 10
<p>TR phenomena under different abuse test. (<b>a</b>) Nail penetration; (<b>b</b>) Side heating; (<b>c</b>) Overcharge.</p>
Full article ">Figure 11
<p>Cell wreckage after different abuse test. (<b>a</b>) Nail penetration; (<b>b</b>) Side heating; (<b>c</b>) Overcharge.</p>
Full article ">Figure 12
<p>TRP temperature and voltage with different trigger methods. (<b>a</b>) Nail penetration; (<b>b</b>) Side heating; (<b>c</b>) Overcharge.</p>
Full article ">Figure 13
<p>TRP phenomena with different abuse methods. (<b>a</b>) Nail penetration; (<b>b</b>) Side heating; (<b>c</b>) Overcharge.</p>
Full article ">Figure 14
<p>TRP wreckage with different trigger methods. (<b>a</b>) Nail penetration; (<b>b</b>) Side heating; (<b>c</b>) Overcharge.</p>
Full article ">
20 pages, 7267 KiB  
Article
Integrated All-Climate Heating/Cooling System Design and Preheating Strategy for Lithium-Ion Battery Pack
by Xiaogang Wu, Zhixin Wei, Yizhao Sun, Jinlei Sun and Jiuyu Du
Batteries 2022, 8(10), 179; https://doi.org/10.3390/batteries8100179 - 12 Oct 2022
Cited by 6 | Viewed by 3738
Abstract
The continuous low temperature in winter is the main factor limiting the popularity of electric vehicles in cold regions. The best way to solve this problem is by preheating power battery packs. Power battery packs have relatively high requirements with regard to the [...] Read more.
The continuous low temperature in winter is the main factor limiting the popularity of electric vehicles in cold regions. The best way to solve this problem is by preheating power battery packs. Power battery packs have relatively high requirements with regard to the uniformity of temperature distribution during the preheating process. Aimed at this problem, taking a 30 Ah LiFePO4 (LFP) pouch battery as the research object, a three-sided liquid cooling structure that takes into account the preheating of the battery module was designed. On the basis of analyzing the influence of the cooling plate arrangement, cooling liquid flow rate, liquid medium, and inlet temperature on the temperature consistency of the battery module, the orthogonal simulation method was used to formulate the optimal combination of factors for different cooling objectives. Using the designed preheating structure, a combined internal and external preheating strategy based on the available battery power is proposed. The research results show that the cooling plate arrangement scheme and the inlet temperature have obvious influences on the preheating effect, while the increase in the flow velocity of the preheating effect is saturated. The optimized external preheating structure can maintain the preheating temperature difference of the battery module at less than 5 °C. On this basis, the proposed combined internal and external preheating strategy saves 50% of the preheating time compared with three-sided preheating. Full article
Show Figures

Figure 1

Figure 1
<p>Battery performance test experimental platform.</p>
Full article ">Figure 2
<p>Test results of various electrical performance parameters of the battery: (<b>a</b>) battery internal resistance−SOC curve; (<b>b</b>) battery OCV−SOC curve; (<b>c</b>) entropy coefficient−SOC curve.</p>
Full article ">Figure 3
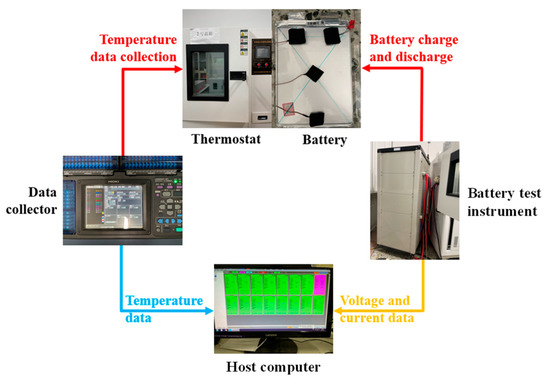
<p>Flow chart of battery charging heat generation experiment and verification; (1) Batteries used in the study and the location of thermocouple arrangement; (2) Battery charging/discharging machine and incubator used in the experiment; (3) Upper computer and data acquisition instrument; (4) Model of single battery.</p>
Full article ">Figure 4
<p>Comparison of temperature rise between simulation and experiment: (<b>a</b>) 1C charging rate; (<b>b</b>) 2C charging rate.</p>
Full article ">Figure 5
<p>Internal channel of battery pack external preheating structure: (<b>a</b>) bottom channel internal structure; (<b>b</b>) bottom trench post-package structure; (<b>c</b>) side channel internal structure; (<b>d</b>) side trench post-package structure; (<b>e</b>) three-sided preheating structure.</p>
Full article ">Figure 5 Cont.
<p>Internal channel of battery pack external preheating structure: (<b>a</b>) bottom channel internal structure; (<b>b</b>) bottom trench post-package structure; (<b>c</b>) side channel internal structure; (<b>d</b>) side trench post-package structure; (<b>e</b>) three-sided preheating structure.</p>
Full article ">Figure 6
<p>Flow chart of low-temperature preheating simulation.</p>
Full article ">Figure 7
<p>Comparison of minimum temperature/maximum temperature difference after preheating at different flow velocities.</p>
Full article ">Figure 8
<p>Comparison of battery pack temperature after preheating at flow rates of 0.6 m/s and 1 m/s: (<b>a</b>) surface temperature distribution of battery pack after preheating at 0.6 m/s; (<b>b</b>) temperature gradient of battery pack after warm-up at 0.6 m/s; (<b>c</b>) surface temperature distribution of battery pack after preheating at 1 m/s; (<b>d</b>) temperature gradient of battery pack after warm-up at 1 m/s.</p>
Full article ">Figure 9
<p>Comparison of minimum temperature/maximum temperature difference of the battery pack after preheating with different inlet temperatures/velocity orthogonal scheme.</p>
Full article ">Figure 10
<p>External preheating optimization structure of battery pack.</p>
Full article ">Figure 11
<p>Comparison of three-sided preheating and optimized structure after preheating of the battery pack at different flow velocities: (<b>a</b>) minimum temperature comparison at different flow velocities; (<b>b</b>) comparison of the maximum temperature difference at different flow velocities.</p>
Full article ">Figure 12
<p>Comparison of three-sided preheating and optimized structure after preheating at different inlet temperatures of the battery pack: (<b>a</b>) comparison of minimum temperature under different inlet temperatures; (<b>b</b>) comparison of maximum temperature difference at different inlet temperatures.</p>
Full article ">Figure 13
<p>Comparison of the maximum temperature difference between different flow rates/inlet temperatures under the optimized structure: (<b>a</b>) comparison of the maximum temperature difference at different flow velocities; (<b>b</b>) comparison of maximum temperature difference at different inlet temperatures.</p>
Full article ">Figure 14
<p>Temperature distribution of battery pack under different preheating times: (<b>a</b>) 860 s; (<b>b</b>) 925 s; (<b>c</b>) 1800 s.</p>
Full article ">Figure 15
<p>Effect of different combined internal and external preheating schemes on preheating time of battery pack.</p>
Full article ">Figure 16
<p>Relationship between battery’s available capacity, residual capacity, and ambient temperature.</p>
Full article ">Figure 17
<p>Combined internal and external battery preheating strategy.</p>
Full article ">
21 pages, 12321 KiB  
Article
Physics-Informed Recurrent Neural Networks with Fractional-Order Constraints for the State Estimation of Lithium-Ion Batteries
by Yanan Wang, Xuebing Han, Dongxu Guo, Languang Lu, Yangquan Chen and Minggao Ouyang
Batteries 2022, 8(10), 148; https://doi.org/10.3390/batteries8100148 - 1 Oct 2022
Cited by 13 | Viewed by 3731
Abstract
The state estimation of lithium-ion battery is the basis of an intelligent battery management system; therefore, both model-based and data-driven methods have been designed and developed for state estimation. Rather than using complex partial differential equations and the complicated parameter tuning of a [...] Read more.
The state estimation of lithium-ion battery is the basis of an intelligent battery management system; therefore, both model-based and data-driven methods have been designed and developed for state estimation. Rather than using complex partial differential equations and the complicated parameter tuning of a model-based method, a machine learning algorithm provides a new paradigm and has been increasingly applied to cloud big-data platforms. Although promising, it is now recognized that big data for machine learning may not be consistent in terms of data quality with reliable labels. Moreover, many algorithms are still applied as a black box that may not learn battery inner information well. To enhance the algorithm generalization in realistic situations, this paper presents a fractional-order physics-informed recurrent neural network (PIRNN) for state estimation. The fractional-order characteristics from battery mechanism are embedded into the proposed algorithm by introducing fractional-order gradients in backpropagation process and fractional-order constraints into the convergence loss function. With encoded battery knowledge, the proposed fractional-order PIRNN would accelerate the convergence speed in training process and achieve improved prediction accuracies. Experiments of four cells under federal urban driving schedule operation conditions and different temperatures are conducted to illustrate the estimation effects of the proposed fractional-order PIRNN. Compared to the integer-order gradient descent method, the fractional-order gradient descent method proposed in this work can optimize network convergence and obtains regression coefficient larger than 0.995. Moreover, the experimental results indicate that the proposed algorithm can achieve 2.5% estimation accuracy with the encoding fractional-order knowledge of lithium-ion batteries. Full article
Show Figures

Figure 1

Figure 1
<p>Structure of typical FOMs for LIBs: (<b>a</b>) second-order FOM. (<b>b</b>) Simplified FOM.</p>
Full article ">Figure 2
<p>Structure of a typical RNN.</p>
Full article ">Figure 3
<p>PDE constraints for the ML algorithm to achieve PINN.</p>
Full article ">Figure 4
<p>Framework of the proposed PIRNN with fractional-order constraints.</p>
Full article ">Figure 5
<p>Experiment setup.</p>
Full article ">Figure 6
<p>Current profile of a single period in FUDS.</p>
Full article ">Figure 7
<p>The measured capacity of four 18650 cells under five temperatures (<math display="inline"><semantics> <mrow> <mn>5</mn> <msup> <mspace width="3.33333pt"/> <mo>∘</mo> </msup> <mi mathvariant="normal">C</mi> </mrow> </semantics></math>,<math display="inline"><semantics> <mrow> <mn>15</mn> <msup> <mspace width="3.33333pt"/> <mo>∘</mo> </msup> <mi mathvariant="normal">C</mi> </mrow> </semantics></math>, <math display="inline"><semantics> <mrow> <mn>25</mn> <msup> <mspace width="3.33333pt"/> <mo>∘</mo> </msup> <mi mathvariant="normal">C</mi> </mrow> </semantics></math>, <math display="inline"><semantics> <mrow> <mn>35</mn> <msup> <mspace width="3.33333pt"/> <mo>∘</mo> </msup> <mi mathvariant="normal">C</mi> </mrow> </semantics></math>, and <math display="inline"><semantics> <mrow> <mn>45</mn> <msup> <mspace width="3.33333pt"/> <mo>∘</mo> </msup> <mi mathvariant="normal">C</mi> </mrow> </semantics></math>).</p>
Full article ">Figure 8
<p>Selected data for training, validation, and testing of the algorithm. (<b>a</b>) current profile, containing cycling FUDS periods, (<b>b</b>) measured cell voltage, (<b>c</b>) five measured temperature (<math display="inline"><semantics> <mrow> <mn>5</mn> <msup> <mspace width="3.33333pt"/> <mo>∘</mo> </msup> <mi mathvariant="normal">C</mi> </mrow> </semantics></math>, <math display="inline"><semantics> <mrow> <mn>15</mn> <msup> <mspace width="3.33333pt"/> <mo>∘</mo> </msup> <mi mathvariant="normal">C</mi> </mrow> </semantics></math>, <math display="inline"><semantics> <mrow> <mn>25</mn> <msup> <mspace width="3.33333pt"/> <mo>∘</mo> </msup> <mi mathvariant="normal">C</mi> </mrow> </semantics></math>, <math display="inline"><semantics> <mrow> <mn>35</mn> <msup> <mspace width="3.33333pt"/> <mo>∘</mo> </msup> <mi mathvariant="normal">C</mi> </mrow> </semantics></math>, <math display="inline"><semantics> <mrow> <mn>45</mn> <msup> <mspace width="3.33333pt"/> <mo>∘</mo> </msup> <mi mathvariant="normal">C</mi> </mrow> </semantics></math>), and (<b>d</b>) calculated SOC, as output target. Data are collected together in time series (1Hz frequency) and can exchange the sequential order to achieve different division patterns.</p>
Full article ">Figure 9
<p>Training process and output performance of fPIRNN. (<b>a</b>) Training, validation, and testing loss; (<b>b</b>) output SOC with fitting; (<b>c</b>) output errors.</p>
Full article ">Figure 10
<p>Experiment results of fPIRNN with fractional-order PDE constraints and RNN with GDm. (<b>a</b>) training and testing loss (marked as “training GDm”, “testing GDm”,“training FO constraints”, and “testing FO cosntraints”), (<b>b</b>) estimated SOC with GDm, (<b>c</b>) estimated SOC with FO constraints, (<b>d</b>) estimated error with GDm, (<b>e</b>) estimated error with FO constraints, and (<b>f</b>) comparison of fitted errors.</p>
Full article ">Figure 11
<p>Comparison of output performance of fPIRNN with fractional-order constraints to RNN with GDm. (<b>a</b>) Regression coefficient and (<b>b</b>) MSE of output error. “data” means the entire dataset including training, validation, and testing data. Moreover, “training”, “validation”, and “testing” are the corresponding results of the three datasets, respectively.</p>
Full article ">Figure 12
<p>Experiment results of fPIRNN with FOGDm and fPIRNN with FOGDm and FO loss. (<b>a</b>) training and testing loss, (<b>b</b>) output SOC with FOGDm, (<b>c</b>) output SOC with FOGDm and FO loss, (<b>d</b>) estimated error with FOGDm, (<b>e</b>) estimated error with FOGDm and FO loss, and (<b>f</b>) comparison of fitted errors.</p>
Full article ">Figure 13
<p>Comparison of output performance of four NN algorithms (marked as “GDm”, “FO constraints”, “FOGDm”, and “FOGDm and FO loss”). (<b>a</b>) Regression coefficient and (<b>b</b>) MSE of output.</p>
Full article ">
15 pages, 6795 KiB  
Article
A Unified Power Converter for Solar PV and Energy Storage in dc Microgrids
by Sergio Coelho, Vitor Monteiro, Tiago J. C. Sousa, Luis A. M. Barros, Delfim Pedrosa, Carlos Couto and Joao L. Afonso
Batteries 2022, 8(10), 143; https://doi.org/10.3390/batteries8100143 - 25 Sep 2022
Cited by 5 | Viewed by 2999
Abstract
This paper deals with the development and experimental validation of a unified power converter for application in dc microgrids, contemplating the inclusion of solar photovoltaic (PV) panels and energy storage systems (ESS), namely batteries. Considering the limitations presented by the current structure of [...] Read more.
This paper deals with the development and experimental validation of a unified power converter for application in dc microgrids, contemplating the inclusion of solar photovoltaic (PV) panels and energy storage systems (ESS), namely batteries. Considering the limitations presented by the current structure of the power grid, mostly highlighted by the accentuated integration of emerging technologies (ESS, renewables, electric vehicles, and electrical appliances that natively operate in dc), it is extremely pertinent to adopt new topologies, architectures, and paradigms. In particular, decentralized power systems, unified topologies, and correspondent control algorithms are representative of a new trend towards a reduction in the number of power converters. Thus, the developed solution is designed to operaSAVE-15te at a nominal power of 3.6 kW, with a switching frequency of 100 kHz, and in four operation modes concerning power flow: (i) solar PV panels to batteries (PV2B); (ii) solar PV panels to dc grid (PV2G); (iii) batteries to dc grid (B2G); (iv) dc grid to batteries (G2B). Moreover, a dual active bridge converter guarantees galvanic isolation, while two back-end dc–dc converters are responsible for interfacing solar PV panels and batteries. The experimental validation of the proposed unified power converter proves its application value to self-consumption production units. Full article
Show Figures

Figure 1

Figure 1
<p>Proposed topology for the unified power converter.</p>
Full article ">Figure 2
<p>Operation modes for the proposed unified power converter topology: (<b>a</b>) solar PV panels to batteries (PV2B); (<b>b</b>) solar PV panels to dc grid (PV2G); (<b>c</b>) batteries to dc grid (B2G); (<b>d</b>) dc grid to batteries (G2B).</p>
Full article ">Figure 3
<p>Electrical schematic of the non-isolated dc–dc back-end power converters: (<b>a</b>) Unidirectional boost, interfacing the solar PV panels; (<b>b</b>) bidirectional buck–boost, interfacing the BESS.</p>
Full article ">Figure 4
<p>Electrical schematic of the isolated bidirectional DAB converter, interfacing the dc grid.</p>
Full article ">Figure 5
<p>Voltage waveforms in the windings of the high-frequency transformer of the DAB power converter with power flow from the: (<b>a</b>) primary to the secondary side (<span class="html-italic">φ</span> &gt; 0); (<b>b</b>) secondary to the primary side (<span class="html-italic">φ</span> &lt; 0).</p>
Full article ">Figure 6
<p>Photography of the prototype developed for the unified power converter.</p>
Full article ">Figure 7
<p>PV2B operation mode: (<b>a</b>) voltage on the solar PV panels (CH1: 5 V/div), secondary dc-link (CH2: 20 V/div) and BESS (CH3: 10 V/div) and current at the BESS (CH4: 1 A/div); (<b>b</b>) gate-source voltage in each of the semiconductors that make up the back-end bidirectional dc–dc buck–boost converter (CH1: 5 V/div), (CH2: 5 V/div).</p>
Full article ">Figure 8
<p>PV2G operation mode with a DPS control algorithm: (<b>a</b>) voltage on the primary (CH1: 20 V/div) and secondary dc-link (CH2: 20 V/div), voltage on the solar PV panels (CH3: 10 V/div), current at the solar PV panels (CH4: 1 A/div); (<b>b</b>) voltage on the high-frequency transformer primary (CH1: 20 V/div) and secondary side (CH2: 20 V/div) in a steady-state; (<b>c</b>) voltage on the high-frequency transformer primary (CH1: 20 V/div) and secondary side (CH2: 20 V/div), detailing the negative phase lag (−<span class="html-italic">φ</span>).</p>
Full article ">Figure 9
<p>B2G operation mode: voltage on the primary dc-link (CH1: 20 V/div), voltage on the secondary dc-link (CH2: 10 V/div), voltage on the batteries (CH3: 10 V/div), current at the BESS (CH4: 500 mA/div).</p>
Full article ">Figure 10
<p>G2B operation mode: (<b>a</b>) voltage on the primary dc-link (CH1: 20 V/div), voltage on the secondary dc-link (CH2: 10 V/div), voltage on the BESS (CH3: 10 V/div), current at the BESS (CH4: 500 mA/div); (<b>b</b>) gate-source voltage waveform of the semiconductors <span class="html-italic">S</span><sub>1</sub> (CH1: 5 V/div) and <span class="html-italic">S</span><sub>5</sub> (CH2: 5 V/div) in an unbalanced situation.</p>
Full article ">Figure 11
<p>G2B operation mode, comparing the phase shift angle (φ) between <span class="html-italic">v</span><sub>1</sub> and <span class="html-italic">v</span><sub>2</sub> during unbalanced and balanced conditions applying a DPS modulation: (<b>a</b>) during a half-cycle on an unbalanced situation—voltage on the primary (CH1: 20 V/div) and secondary (CH2: 20 V/div) side of the high-frequency transformer and on the secondary dc-link (CH3: 10 V/div); (<b>b</b>) on a balanced situation—voltage on the primary (CH1: 20 V/div) and secondary (CH2: 20 V/div) side of the high-frequency transformer.</p>
Full article ">
18 pages, 5814 KiB  
Article
An Electrical–Thermal Coupling Model with Artificial Intelligence for State of Charge and Residual Available Energy Co-Estimation of LiFePO4 Battery System under Various Temperatures
by Shuoyuan Mao, Meilin Han, Xuebing Han, Languang Lu, Xuning Feng, Anyu Su, Depeng Wang, Zixuan Chen, Yao Lu and Minggao Ouyang
Batteries 2022, 8(10), 140; https://doi.org/10.3390/batteries8100140 - 22 Sep 2022
Cited by 13 | Viewed by 3642
Abstract
The LiFePO4 (LFP) battery tends to underperform in low temperature: the available energy drops, while the state of charge (SOC) and residual available energy (RAE) estimation error increase dramatically compared to the result under room temperature, which causes mileage anxiety for drivers. This [...] Read more.
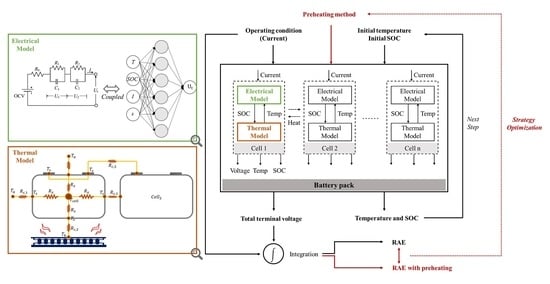
The LiFePO4 (LFP) battery tends to underperform in low temperature: the available energy drops, while the state of charge (SOC) and residual available energy (RAE) estimation error increase dramatically compared to the result under room temperature, which causes mileage anxiety for drivers. This paper introduces an artificial intelligence-based electrical–thermal coupling battery model, presents an application-oriented procedure to estimate SOC and RAE for a reliable and effective battery management system, and puts forward a model-based strategy to control the battery thermal state in low temperature. Firstly, an LFP battery electrical model based on artificial intelligence is proposed to estimate the terminal voltage, and a thermal resistance model with an EKF estimation algorithm is established to assess the temperature distribution in the battery pack. Then, the electrical and thermal models are coupled, a closed-loop EKF algorithm is employed to estimate the battery SOC, and a fusion method is discussed. The coupled model is simulated under a given protocol and RAE can be obtained. Finally, based on the electrical–thermal coupling model and RAE calculation algorithm, a preheating method and constant power condition-based RAE estimation are discussed, and the thermal management strategy of the battery system under low temperature is formed. Results show that the estimation error of SOC can be controlled within 2% and RAE can be controlled within 4%, respectively. The preheating strategy at low temperature and low SOC can significantly improve the energy output of the battery pack system. Full article
Show Figures

Graphical abstract

Graphical abstract
Full article ">Figure 1
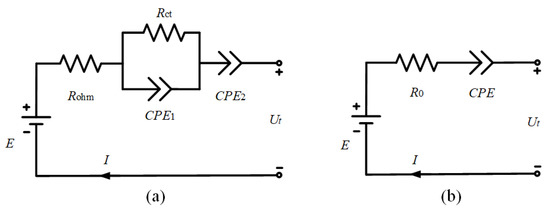
<p>Battery models. (<bold>a</bold>) 2nd-order ECM. (<bold>b</bold>) NN model.</p>
Full article ">Figure 2
<p>The thermal model of the battery and module. (<bold>a</bold>) Single battery model. (<bold>b</bold>) Battery module model.</p>
Full article ">Figure 3
<p>The four regions defined in the battery pack according to symmetry.</p>
Full article ">Figure 4
<p>The configuration of the test bench.</p>
Full article ">Figure 5
<p>The HPPC test protocol and identified parameters of ECM. (<bold>a</bold>) Full protocol of the HPPC test. (<bold>b</bold>) A single plus protocol. (<bold>c</bold>) The identified OCV. (<bold>d</bold>) The identified R0. (<bold>e</bold>) The identified R1. (<bold>f</bold>) The identified C1. (<bold>g</bold>) The identified C2. (<bold>h</bold>) The identified R2.</p>
Full article ">Figure 6
<p>The current protocols used in NN training and validation. (<bold>a</bold>) NEDC operating condition. (<bold>b</bold>) FUDS operating condition. (<bold>c</bold>)–(<bold>i</bold>) Dynamic operating conditions selected from real vehicle data.</p>
Full article ">Figure 7
<p>The experiment and simulation results of the thermal model. (<bold>a</bold>) Temperature measurement experiment results at 25 °C. (<bold>b</bold>) The validation of a single battery model at 25 °C. (<bold>c</bold>) Simulation results of the module model. (<bold>d</bold>) The validation of a single battery model at −20 °C.</p>
Full article ">Figure 8
<p>The EKF algorithm in estimating battery SOC. (<bold>a</bold>) The algorithm logic diagram. (<bold>b</bold>) The specific calculation process based on ECM. (<bold>c</bold>) The specific calculation process based on NN model.</p>
Full article ">Figure 9
<p>The SOC estimation results of different algorithms under three error modes.</p>
Full article ">Figure 10
<p>The calculation process of RAE. (<bold>a</bold>) Total process of SOC and temperature co-estimation and calculation of RAE. (<bold>b</bold>) Detailed flow chart of RAE calculation.</p>
Full article ">Figure 11
<p>The effect of preheating to energy state at various low temperatures. (<bold>a</bold>) Ambient temperature and battery initial temperature is −20 °C. (<bold>b</bold>) Ambient temperature and battery initial temperature is −15 °C. (<bold>c</bold>) Ambient temperature and battery initial temperature is −10 °C. (<bold>d</bold>) Ambient temperature and battery initial temperature is −5 °C.</p>
Full article ">Figure 12
<p>SOE of the module discharged at different constant powers at −20 °C and with preheating.</p>
Full article ">

Planned Papers

The below list represents only planned manuscripts. Some of these manuscripts have not been received by the Editorial Office yet. Papers submitted to MDPI journals are subject to peer-review.

Title: Binary Ni/Co Metal-Organic Frameworks as Electrodes for High-Power Energy Storage Applications
Authors: Evangelos I. Gkanas; Ilias Ntoukas; Chiara Milanese; Rong Lan; Alexander Roberts
Affiliation: Centre for Advanced Low Carbon Propulsion Systems (C-ALPS), Coventry University, UK
Abstract: Metal-Organic Frameworks (MOFs) are compounds consisting of metal ions coordinated to organic ligands to form crystalline porous structures by self-assembly. They have emerged as a class of crystalline materials with high surface area and porosity, tuneable pore size and functionalized surface. Due tothe metal nodes in the framework, they provide redox centres facilitating faradaic reactions, and due to their crystalline porous structure they provide easier access for electrolyte diffusion. Thus, they own great electrochemical properties, making them ideal for electrode materials for supercapacitors. However, most reported MOFs own an insulating nature which is a major drawback for their electrochemical applications. A common method to solve this restriction is to incorporate another metallic element to enhance the properties of the electrode material. Nickel materials demonstrate high specific capacitance and exhibit promising electrochemical properties as electrode materials for supercapacitors, but they own low rate capability and cycle life, which is attributed to their poor structural stability during the fast charge-discharge process. With the addition of another metal ions such as Co into the structure, more active sites and improved conductivity can be obtained, while stabilizing the Ni species. The partial substitution of the second metal ions in the inorganic nodes will provide synergistic effects for the bimetallic framework. The ratio between the metals can also be adjusted to tune the physiochemical properties of MOFs. In this study, using terephthalic and trimesic acid as the linkers, binary Ni/Co MOFs (Ni:Co = 4:1, 3:1, 2:1, 1:1)have been synthesized utilizing a solvothermal method. Various parameters that affect the structure andproperties of MOFs such as time, temperature, ligands, Ni/Co ratio, and additives have been investigated. Themain focus is on the effect of Co ions that substitute the Ni ones in the framework, how they affect thestructure’s stability and the electrochemical properties of the bimetallic Ni/Co MOFs. These materials have been structurally characterised by SEM, EDX, XRD, XPS, FTIR, TGA, BET and TEM.The morphology consists of 2D interlayered nanosheets with smooth surface that assemble to form 3Dmicroflower-like crystalline structures. The addition of Co leads to a more dense, hierarchical and sphericalmorphology. The phase of these materials is also identified by Rietveld analysis and is: Ni(OH)(CHO) (CCDC no. 985792). The addition of Co does not alter the framework but only provides stability. Moreover, these materials have been electrochemically tested by CV, GCD, EIS and cycling measurements. Alarge specific capacitance of 1503 F/g at 1A/g has been achieved with 70% retention after 3000 cycles. Finally, asymmetric coin cells using these materials and Activated Carbon (AC) have been developed and tested for their capacitance and cycle life.

Back to TopTop