COVID-19 Vaccines and Vaccination
A topical collection in Vaccines (ISSN 2076-393X). This collection belongs to the section "COVID-19 Vaccines and Vaccination".
Viewed by 350247Editors
Interests: viral immunology; vaccines; therapeutics; RSV; influenza; RNAi; miRNA
Special Issues, Collections and Topics in MDPI journals
Interests: the requirements for the generation and maintenance of resident memory CD8 T cells
Special Issues, Collections and Topics in MDPI journals
Topical Collection Information
Dear Associates,
There are >200 vaccine candidates for COVID-19 being developed. Of these, >50 candidate vaccines are in clinical trials. It is expected that the different vaccines in development will secure the chance that one or more will be efficacious and safe.
There are three approaches to vaccine design:
(1) whole virus,
(2) part of the virus that triggers immunity, or
(3) viral genetic material.
This Collection on “COVID-19 Vaccine Development and Vaccination” will highlight the recent effort to develop, test, and use vaccines on individuals with promising vaccine platforms against SARS-CoV-2. These approaches may include a whole virus approach (live-attenuated vaccine, inactivated vaccine, or viral vector vaccine), a subunit approach, or genetic approaches that include nucleic acid vaccines.
Prof. Dr. Ralph Tripp
Dr. Scott Anthony
Collection Editor,Editor in Chief
Manuscript Submission Information
Manuscripts should be submitted online at www.mdpi.com by registering and logging in to this website. Once you are registered, click here to go to the submission form. Manuscripts can be submitted until the deadline. All submissions that pass pre-check are peer-reviewed. Accepted papers will be published continuously in the journal (as soon as accepted) and will be listed together on the collection website. Research articles, review articles as well as short communications are invited. For planned papers, a title and short abstract (about 100 words) can be sent to the Editorial Office for announcement on this website.
Submitted manuscripts should not have been published previously, nor be under consideration for publication elsewhere (except conference proceedings papers). All manuscripts are thoroughly refereed through a single-blind peer-review process. A guide for authors and other relevant information for submission of manuscripts is available on the Instructions for Authors page. Vaccines is an international peer-reviewed open access monthly journal published by MDPI.
Please visit the Instructions for Authors page before submitting a manuscript. The Article Processing Charge (APC) for publication in this open access journal is 2700 CHF (Swiss Francs). Submitted papers should be well formatted and use good English. Authors may use MDPI's English editing service prior to publication or during author revisions.
<p>Antibody responses in ChAdOx1, nCoV-19, and mRNA-1273-vaccinated hemodialysis patients. (<b>A</b>) Time-dependent changes of anti-RBD IgG levels induced by ChAdOx1, nCoV-19, and mRNA-1273 vaccination. (<b>B</b>) Comparison of mean anti-RBD IgG levels induced by different vaccines. (<b>C</b>) Comparison of mean anti-RBD IgG levels induced by vaccination at various time points. *** denotes <span class="html-italic">p</span> < 0.001.</p> Full article ">Figure 2
<p>Comparison of vaccine-induced anti-RBD IgG levels at different time points and in different subgroups. (<b>a</b>,<b>b</b>) Antibody responses in different genders. (<b>c</b>,<b>d</b>) Antibody responses at different ages. (<b>e</b>,<b>f</b>) Antibody responses in different BMIs. *, **, and *** denote <span class="html-italic">p</span> < 0.05, <0.01, and <0.001.</p> Full article ">
<p>Timeline of the pandemic in the Voždovac municipality. Time of study (1 July–31 October 2021) depicted along with the vaccination timeline and dominant SARS-CoV-2 variant. The number of SARS-CoV-2 positive persons per day in Voždovac (from April 2020 through December 2022) as reported by the Institute of Public Health of Serbia (<a href="https://covid19.data.gov.rs" target="_blank">https://covid19.data.gov.rs</a>, accessed on 27 December 2022).</p> Full article ">Figure 2
<p>Vaccine effectiveness of the four vaccine types administered to the Voždovac community according to age group.</p> Full article ">
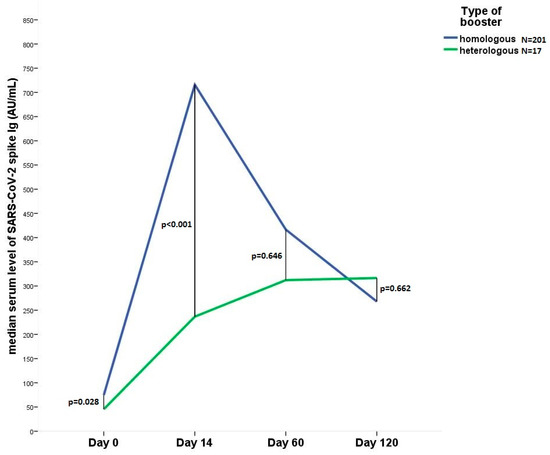
<p>Line diagram shows the change in the median anti SARS-CoV-2 IgG level 14, 60 and 120 days after heterologous (N = 17) or homologous (N = 201) booster vaccination. Day 0, immediately before 3rd dose.</p> Full article ">Figure 2
<p>Correlation of antibody titers with syptomatic status after the 2nd and 3rd vaccinations. (<b>A</b>) Antibody response of symptomatic versus non-symptomatic patients at 14 (N = 383), 60 (N = 320) and 120 (N = 268) days after the 2nd vaccination, (<b>B</b>) after the 3rd dose (N = 218 at all time points). Definition of a symptomatic individual: A local or systemic adverse reaction occurring within 7 days after vaccination. Statistical analysis was performed using Mann–Whitney-U test in each group, respectively. NS, non-significant; SARS-CoV-2, severe acute respiratory syndrome coronavirus 2. * indicates <span class="html-italic">p</span> < 0.05.</p> Full article ">
<p>Pregnancy monitoring impacted by the COVID-19 pandemic. (<b>a</b>) rescheduled doctor visits, (<b>b</b>) reasons for reduced pregnancy visits.</p> Full article ">Figure 2
<p>Anxiety reported by pregnant women (<b>a</b>) during pregnancy and (<b>b</b>) before birth because of the possibility of isolation from the newborn in case they tested positive.</p> Full article ">Figure 3
<p>Vaccination uptake among participants and moment of immunization. (<b>a</b>) Number of vaccinated participants, (<b>b</b>) vaccination time, (<b>c</b>) the number of vaccinated participants depending on their pregnancy trimester for women vaccinated during pregnancy.</p> Full article ">
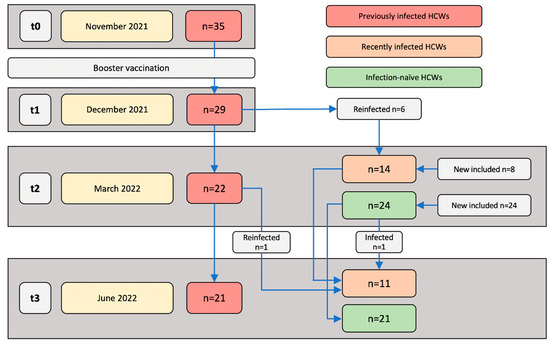
<p>Study populations and sampling time points. Blood samples were collected and immune responses were assessed at the following four time points: November 2021 (t0; approximately two weeks before receiving a booster vaccination), December 2021 (t1; one month post-booster vaccination), March 2022 (t2; four months post-booster vaccination), and June 2022 (t3; seven months post-booster vaccination).</p> Full article ">Figure 2
<p>SARS-CoV-2-specific T cell and antibody responses of previously infected HCWs two weeks and five months post-primary vaccinations. Previously infected HCWs (<span class="html-italic">n</span> = 32) are represented by individual data points. (<b>A</b>) T cell responses against SARS-CoV-2 S1 and N, (<b>B</b>) serum anti-RBD IgG concentrations, and (<b>C</b>) the neutralizing activity of serum antibodies against SARS-CoV-2 at two weeks and five months (i.e., t0) after primary vaccination series. Statistical significance was assessed with a Wilcoxon test.</p> Full article ">Figure 3
<p>SARS-CoV-2-specific T cell and antibody responses of previously infected HCWs before and after booster vaccination. Immune responses of previously infected HCWs (<span class="html-italic">n</span> = 26) were assessed at median 1 (IQR 1–7) day before (t0) and 27 (IQR 24–29) days after (t1) receiving the BNT162b2 or mRNA-1273 booster vaccination. Each data point represents an individual HCW. (<b>A</b>) T cell responses against SARS-CoV-2 S1 and N. (<b>B</b>) Serum anti-RBD IgG concentrations. (<b>C</b>) Neutralizing activity of serum antibodies against SARS-CoV-2. (<b>D</b>) Association between SARS-CoV-2 S1-specific T cell responses and anti-RBD IgG concentrations at t0 and t1. (<b>E</b>) Association between the neutralizing activities and anti-RBD IgG concentrations at t0 and t1. Statistical significance between paired data was assessed with a Wilcoxon test (<b>A</b>–<b>C</b>) and associations were assessed by Spearman’s rank correlation (<b>D</b>,<b>E</b>).</p> Full article ">Figure 4
<p>SARS-CoV-2-specific T cell and antibody responses of previously infected HCWs at t1, t2, and t3. Immune responses of previously infected HCWs were assessed median 27 (IQR 22–28) days (t1), 125 (IQR 118–126) days (t2), and 221 (IQR 204–213) days (t3) after receiving BNT162b2 or mRNA-1273 booster vaccination. (<b>A</b>) SARS-CoV-2 S1-specific T cell responses, (<b>B</b>) serum anti-RBD IgG concentrations, and (<b>C</b>) neutralizing activity against SARS-CoV-2 at t1 and t2 (<span class="html-italic">n</span> = 19). (<b>D</b>) SARS-CoV-2 S1-specific and (<b>E</b>) serum anti-RBD IgG concentrations at t2 and t3 (<span class="html-italic">n</span> = 19). Statistical significance was assessed with a Wilcoxon test.</p> Full article ">Figure 5
<p>SARS-CoV-2-specific T cell and antibody responses of previously infected, recently infected, and infection-naïve HCWs. Immune responses were assessed at t2 (median 126 (IQR 122–131) days after receiving BNT162b2 or mRNA-1273 booster vaccination) and t3 (median 209 (IQR 204–212) days after receiving BNT162b2 or mRNA-1273 booster vaccination). (<b>A</b>) SARS-CoV-2 S1-specific T cell responses at t2 of previously infected (<span class="html-italic">n</span> = 22), recently infected (<span class="html-italic">n</span> = 14), and infection-naïve HCWs (<span class="html-italic">n</span> = 24). (<b>B</b>) Anti-RBD serum IgG concentrations at t2 of previously infected (<span class="html-italic">n</span> = 22), recently infected (<span class="html-italic">n</span> = 14), and infection-naïve HCWs (<span class="html-italic">n</span> = 24). (<b>C</b>) Neutralizing activity against SARS-CoV-2 RBD at t2 of previously infected (<span class="html-italic">n</span> = 21), recently infected (<span class="html-italic">n</span> = 12), and infection-naïve HCWs (<span class="html-italic">n</span> = 23). (<b>D</b>) T cell responses against SARS-CoV-2 S1 and N at t3 between previously infected (<span class="html-italic">n</span> = 21), recently infected (<span class="html-italic">n</span> = 11), and infection-naïve HCWs (<span class="html-italic">n</span> = 21). (<b>E</b>) Anti-RBD serum IgG concentrations at t3 between previously infected (<span class="html-italic">n</span> = 21), recently infected (<span class="html-italic">n</span> = 11), and infection-naïve HCWs (<span class="html-italic">n</span> = 21). Indicated is the median with IQR and statistical significance was assessed with a Kruskal–Wallis test with Dunn’s multiple comparison test. (<b>F</b>) Percentages of serum anti-N IgG-positive previously infected HCWs (<span class="html-italic">n</span> = 21) assessed at June 2020, June 2021, and March 2022 (t2).</p> Full article ">Figure 6
<p>T cell responses against wild-type spike and VOC-mutated spike proteins. At t3, the PBMCs of previously infected (<span class="html-italic">n</span> = 21), recently infected (<span class="html-italic">n</span> = 11), and infection-naïve (<span class="html-italic">n</span> = 21) HCWs were stimulated with SARS-CoV-2 Omicron BA.1, Omicron BA.2, and Delta mutation spike peptide pools and corresponding SARS-CoV-2 wildtype (WT) spike peptide pools. (<b>A</b>) T cell responses against the SARS-CoV-2 Omicron BA.1 spike and corresponding WT spike peptide pools. (<b>B</b>) T cell responses against the SARS-CoV-2 Omicron BA.2 spike and corresponding WT spike peptide pools. (<b>C</b>) T cell responses against the SARS-CoV-2 Delta spike and corresponding WT spike peptide pools. Statistical significance was assessed with a Mann–Whitney test. (<b>D</b>) T cell responses against SARS-CoV-2 Omicron BA.1, Omicron BA.2, and Delta spike mutation peptide pools between previously infected, recently infected, and infection-naive HCWs. Indicated is the median with IQR and statistical significance was assessed through a Kruskal–Wallis test with Dunn’s multiple comparison test.</p> Full article ">
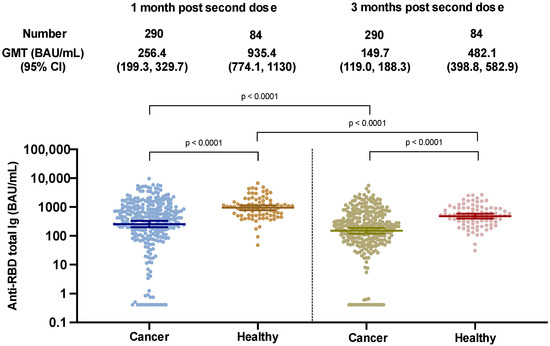
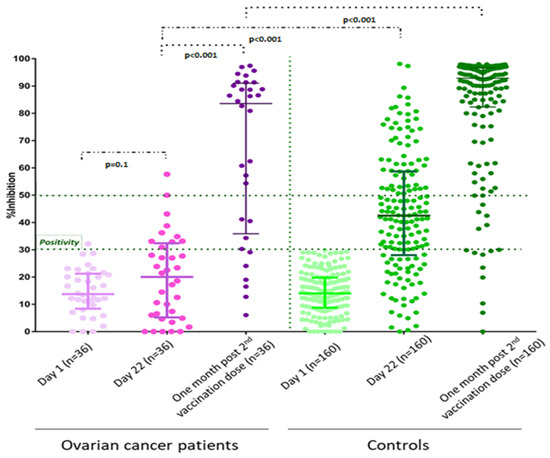
<p>SARS-CoV-2 binding antibody levels at 1 and 3 months after two doses of the ChAdOx-nCoV-19 vaccine in cancer and healthy cohorts.</p> Full article ">Figure 2
<p>Decay rates of SARS-CoV-2 binding antibody levels at 1 and 3 months after two doses of the ChAdOx-nCoV-19 vaccine in cancer (n = 290) and healthy cohorts (n = 84). (<b>A</b>) Comparison of anti-RBD total Ig at 3 months after completing 2 doses of ChAdOx1-nCoV-19 between the cancer and healthy groups—adjusted for individual baseline values (at 1 month). (<b>B</b>) Slopes of regression lines adjusted for individual baseline values (at 1 month): slope (cancer) = −0.004155 (log 10 scale)/day, slope (healthy) = −0.004736 (log 10 scale)/day. (<b>C</b>) Comparison of anti-RBD total Ig at 3 months after completing 2 doses of ChAdOx1-nCoV-19 between treatment types among cancer patients—adjusted for individual baseline values (at 1 month). Grey line represents patients with decreasing antibody levels and colored lines represent patients with stable or rising levels. (<b>D</b>) Slopes of regression lines adjusted for individual baseline values (at 1 month): slope (chemotherapy) = −0.002552 (log 10 scale)/day, slope (TKI/CDK4/6 inhibitor) = −0.005772 (log 10 scale)/day, slope (immunotherapy) = −0.008619 (log 10 scale)/day, slope (biologic agent/anti-hormonal) = −0.002066 (log 10 scale)/day. * In order to consider multiple comparisons adjustment using Bonferroni, the calculated <span class="html-italic">p</span>-values should be compared with <0.05/6 = <0.0083 in considering significance.</p> Full article ">Figure 3
<p>SARS-CoV-2 binding antibody levels at 1 and 3 months after two doses of the ChAdOx-nCoV-19 vaccine in cancer patients stratified by treatment given (n = 137) compared to healthy controls (n = 84) (<b>A</b>). GMT of Anti-RBD total Ig of SAR-CoV-2 at one month and three months after completing ChAdOx1-nCoV-19 vaccines among different types of anticancer treatments (<b>B</b>): immunotherapy, chemotherapy, targeted therapy.</p> Full article ">Figure 3 Cont.
<p>SARS-CoV-2 binding antibody levels at 1 and 3 months after two doses of the ChAdOx-nCoV-19 vaccine in cancer patients stratified by treatment given (n = 137) compared to healthy controls (n = 84) (<b>A</b>). GMT of Anti-RBD total Ig of SAR-CoV-2 at one month and three months after completing ChAdOx1-nCoV-19 vaccines among different types of anticancer treatments (<b>B</b>): immunotherapy, chemotherapy, targeted therapy.</p> Full article ">Figure 4
<p>Effect of treatment cessation on antibody response. The SARS-CoV-2 binding antibody levels at 1 and 3 months after two doses of the ChAdOx-nCoV-19 vaccine in cancer treatment cessation patients (n = 63, red color), and those undergoing anticancer treatment (n = 227, green color) (<b>A</b>). Dynamics (<b>B</b>) and slopes (<b>C</b>) of anti-RBD total Ig at 1 month and 3 months after the second dose of ChAdOx1-nCoV-19 among cancer patients who discontinued treatment compared to those receiving anticancer treatment—adjusted for individual baseline values (at 1 month). Slopes of regression lines adjusted for individual baseline values (at 1 month): slope (treatment interruption) = −0.003885 (log 10 scale)/day, slope (no interruption) = −0.004224 (log 10 scale)/day.</p> Full article ">Figure 4 Cont.
<p>Effect of treatment cessation on antibody response. The SARS-CoV-2 binding antibody levels at 1 and 3 months after two doses of the ChAdOx-nCoV-19 vaccine in cancer treatment cessation patients (n = 63, red color), and those undergoing anticancer treatment (n = 227, green color) (<b>A</b>). Dynamics (<b>B</b>) and slopes (<b>C</b>) of anti-RBD total Ig at 1 month and 3 months after the second dose of ChAdOx1-nCoV-19 among cancer patients who discontinued treatment compared to those receiving anticancer treatment—adjusted for individual baseline values (at 1 month). Slopes of regression lines adjusted for individual baseline values (at 1 month): slope (treatment interruption) = −0.003885 (log 10 scale)/day, slope (no interruption) = −0.004224 (log 10 scale)/day.</p> Full article ">Figure 4 Cont.
<p>Effect of treatment cessation on antibody response. The SARS-CoV-2 binding antibody levels at 1 and 3 months after two doses of the ChAdOx-nCoV-19 vaccine in cancer treatment cessation patients (n = 63, red color), and those undergoing anticancer treatment (n = 227, green color) (<b>A</b>). Dynamics (<b>B</b>) and slopes (<b>C</b>) of anti-RBD total Ig at 1 month and 3 months after the second dose of ChAdOx1-nCoV-19 among cancer patients who discontinued treatment compared to those receiving anticancer treatment—adjusted for individual baseline values (at 1 month). Slopes of regression lines adjusted for individual baseline values (at 1 month): slope (treatment interruption) = −0.003885 (log 10 scale)/day, slope (no interruption) = −0.004224 (log 10 scale)/day.</p> Full article ">
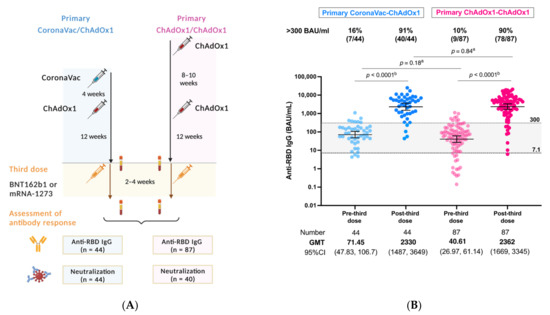
<p>(<b>A</b>) Study flow diagram (<b>B</b>) SARS-CoV-2 binding antibody response at post-third mRNA COVID-19 vaccine following the primary heterologous CoronaVac/ChAdOx1 versus ChAdOx1/ChAdOx1 vaccination schedules. Anti-RBD IgG levels ≥ 7.1 BAU/mL (equal to 50 AU/mL) were considered positive, whereas levels >300 BAU/mL were considered as adequate response. <sup>a</sup> Mann-Whitney test, <sup>b</sup> Wilcoxon signed rank test.</p> Full article ">Figure 2
<p>(<b>A</b>,<b>B</b>) SARS-CoV-2 binding antibody response SARS-CoV-2 binding antibody response at post-third mRNA COVID-19 vaccine following the heterologous CoronaVac/ChAdOx1 vaccination in cancer patients versus healthy controls (<b>A</b>) and aged match subset analysis (<b>B</b>). (<b>C</b>) SARS-CoV-2 binding antibody response at post-third mRNA COVID-19 vaccine following the primary CoronaVac/ChAdOx1 vaccination in cancer patients stratified by types of mRNA COVID-19 vaccines and types of anticancer treatment. (<b>D</b>) Vaccine-related reactogenicity after the CoronaVac/ChAdOx1/mRNA vaccination in cancer patients. <sup>a</sup> Mann-Whitney test, <sup>b</sup> Wilcoxon signed rank test.</p> Full article ">Figure 2 Cont.
<p>(<b>A</b>,<b>B</b>) SARS-CoV-2 binding antibody response SARS-CoV-2 binding antibody response at post-third mRNA COVID-19 vaccine following the heterologous CoronaVac/ChAdOx1 vaccination in cancer patients versus healthy controls (<b>A</b>) and aged match subset analysis (<b>B</b>). (<b>C</b>) SARS-CoV-2 binding antibody response at post-third mRNA COVID-19 vaccine following the primary CoronaVac/ChAdOx1 vaccination in cancer patients stratified by types of mRNA COVID-19 vaccines and types of anticancer treatment. (<b>D</b>) Vaccine-related reactogenicity after the CoronaVac/ChAdOx1/mRNA vaccination in cancer patients. <sup>a</sup> Mann-Whitney test, <sup>b</sup> Wilcoxon signed rank test.</p> Full article ">Figure 3
<p>ELISA-based surrogate neutralization against Omicron BA2 variant in response to the CoronaVac/ChAdOx1/mRNA versus the ChAdOx1/ChAdOx1/mRNA vaccination in cancer patients. Data are reported as the median and 95%CI of percentage of inhibition between human ACE-2 and RBD protein. The cut-off value of 30% indicates the presence of detectable neutralization according to the manufacturer’s (cPass, Genscript) protocol. Data points represent individual samples. The pink color represents chemotherapy and the blue color represents treatment with hormonal therapy/biologics. <sup>a</sup> Mann-Whitney test.</p> Full article ">
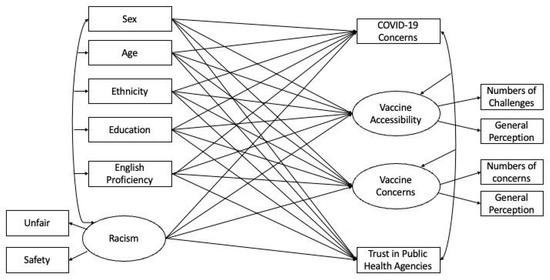
<p>Structural equation model (SEM) predicting general COVID-19 concerns, COVID-19 vaccine accessibility, COVID-19 vaccine concerns, and trust in public health agencies using demographic characteristics and racism experience. The shared variance (<span class="html-italic">r</span><sup>2</sup>) between indicators formed the latent variable: vaccine accessibility = 0.08; vaccine concerns = 0.14; and racism = 0.30. These statistics indicate the association and hence internal consistency among the items [<a href="#B30-vaccines-10-01333" class="html-bibr">30</a>].</p> Full article ">Figure 2
<p>A map for the visualization of the overall SVI against the perception of unfairness due to race/ethnicity among survey respondents.</p> Full article ">Figure 3
<p>A map for the visualization of the overall SVI against the accessibility of COVID-19 vaccination among survey respondents.</p> Full article ">Figure 4
<p>A map for the visualization of the overall SVI against the trust in public health agencies among survey respondents.</p> Full article ">
Full article ">Figure 1
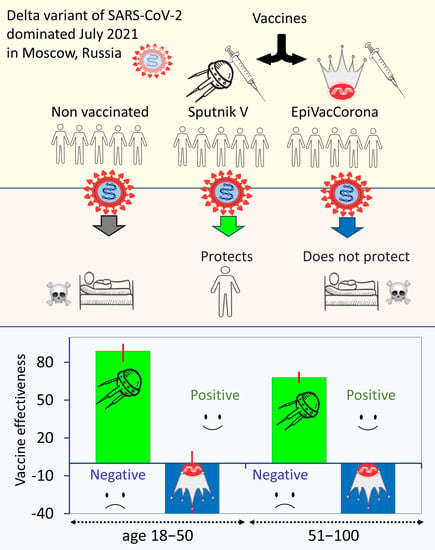
<p>Characterization of immune protection by COVID-19 vaccines. Data obtained in Moscow for the summer of 2021. (<b>a</b>) The estimated effectiveness values of the Sputnik V and EpiVacCorona vaccines in preventing severe forms of COVID-19. The analysis is based on data from July 2021. The upper chart shows the results of the analysis performed with a control group of unvaccinated Moscow residents, and the lower chart corresponds to the data analysis performed with a control group of seronegative individuals. The VE estimates for the Sputnik V vaccine were positive and highly significant (<span class="html-italic">p</span> < 0.001) by the chi-square test for both age groups. The VE values for EpiVacCorona vaccines were negative and nonsignificant (<span class="html-italic">p</span> > 0.05) for the 18–50 age group and negative and significant for the 50+ age group (<span class="html-italic">p</span> < 0.001). (<b>b</b>) The panel shows the number of deaths and severe cases of COVID-19 among fully vaccinated or seronegative Moscow residents, normalized per 10,000 person-years.</p> Full article ">Figure 2
<p>Protective effectiveness of the Sputnik V vaccine against COVID-19 disease of varying severity or death (%). The upper bar charts represent calculations with control group 1, and the lower bar charts represent calculations with control group 2. All positive VE estimates in all charts are highly significant according to the chi-square test, <span class="html-italic">p</span> < 0.001. Data obtained in Moscow in June 2021.</p> Full article ">
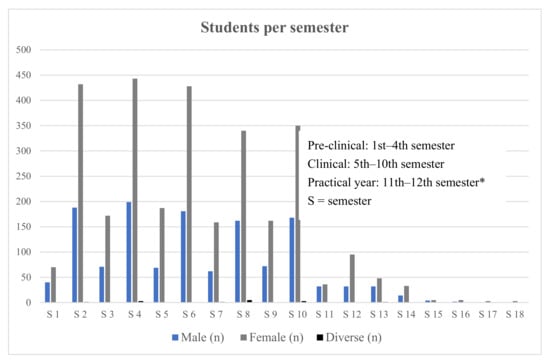
<p>Distribution of medical students enrolled per semester. * Six-year undergraduate medical education in Germany comprises two pre-clinical years and a four-year clinical segment ending with a final practical year. Some students take more time to complete their studies than the official minimum duration.</p> Full article ">Figure 2
<p>Percentage agreement to statements regarding teaching of vaccination-related topics.</p> Full article ">Figure 3
<p>Percentage agreement to statements regarding perceived needs of students on vaccine-related teaching topics.</p> Full article ">Figure 4
<p>Percentage agreement of questions about informing/educating others and confidence about the learnt information.</p> Full article ">
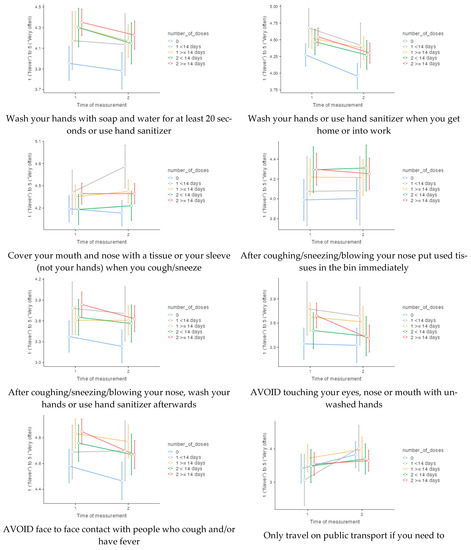
<p>Frequencies of 14 precautionary behaviours at time of measurement 1 (141 days before the start of the vaccination programme) and time of measurement 2 (161 days after the start of the vaccination programme), according to number of doses at time of measurement 2.</p> Full article ">Figure 1 Cont.
<p>Frequencies of 14 precautionary behaviours at time of measurement 1 (141 days before the start of the vaccination programme) and time of measurement 2 (161 days after the start of the vaccination programme), according to number of doses at time of measurement 2.</p> Full article ">
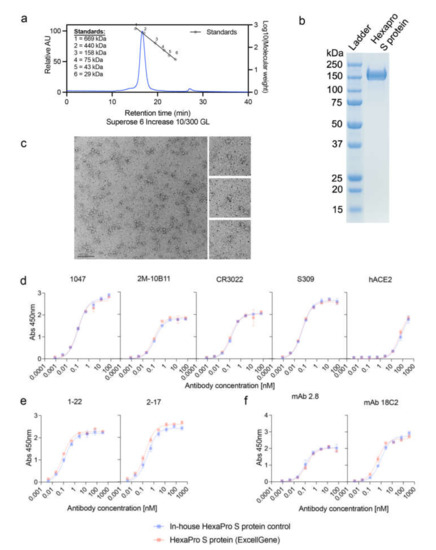
<p>Characterization of the SARS CoV-2 HexaPro S protein. (<b>a</b>) Analysis of HexaPro S protein on size-exclusion chromatography (SEC), with a single peak at 16.6 min and purity of 98%. A mixture of thyroglobulin (669 kDa), ferritin (440 kDa), aldolase (158 kDa), conalbumin (75 kDa), ovalbumin (43 kDa), and carbonic anhydrase (29 kDa) proteins were used as standards. (<b>b</b>) SDS-PAGE gel showing a band for the HexaPro S protein. (<b>c</b>) Negative-stain electron microscopy (Bar = 100 nm) of the HexaPro S protein. Antibody binding to (<b>d</b>) RBD (1047, 2M-10B11, CR3022, S309, and hACE2), (<b>e</b>) N-terminal domain (NTD; 2-17 and 1-22), and (<b>f</b>) S2 subunit (mAb 2.8 and mAb 18C2).</p> Full article ">Figure 2
<p>HexaPro S protein-based vaccine and its application using HD-MAP. (<b>a</b>) HD-MAPs containing 5000 solid polymer microprojection arrays to deliver vaccine into the cutaneous layer of the skin. (<b>b</b>) Delivery efficiency of antigen into the skin using HD-MAPs coated with SARS CoV-2 HexaPro S protein and QS-21-adjuvanted SARS CoV-2 HexaPro S protein (<span class="html-italic">n</span> = 5, each) was measured by comparing the remaining protein from the delivered HD-MAPs to undelivered HD-MAPs using capture ELISA.</p> Full article ">Figure 3
<p>Immune responses in BALB/c mice following the vaccination with excipients (negative control), HexaPro S protein, and HexaPro S protein + QS-21 via intradermal injection (i.d.) or HD-MAP application (<span class="html-italic">n</span> = 8, each), (<b>a</b>) vaccination schedule. Serum was collected after primary immunization and first boost (on day 20 and 42, respectively) and analyzed for (<b>b</b>) serum IgG antibody titers against HexaPro S protein and HexaPro S protein derived from Alpha and Delta variants by ELISA. Serum and bronchoalveolar lavage (BAL) collected on day 42 were analyzed for (<b>c</b>) serum virus neutralization by plaque reduction neutralization test (PRNT) against the parental SARS-CoV-2 isolate, an Alpha variant, and a Delta variant, and (<b>d</b>) BAL virus neutralization by PRNT against ancestral SARS-CoV-2 variant, respectively. Each point represents an individual biological replicate (mouse) performed on a single ELISA assay; bars represent the average antigen-specific IgG antibody titers (EC50); error bars represent the SD; the LoD line represents the assay limit of detection. Statistical analysis was performed using one-way ANOVA with Tukey’s multiple comparison <span class="html-italic">post hoc</span> test ((*) <span class="html-italic">p <</span> 0.05, (***) <span class="html-italic">p <</span> 0.001, (****) <span class="html-italic">p <</span> 0.0001 and non-significant (ns)).</p> Full article ">
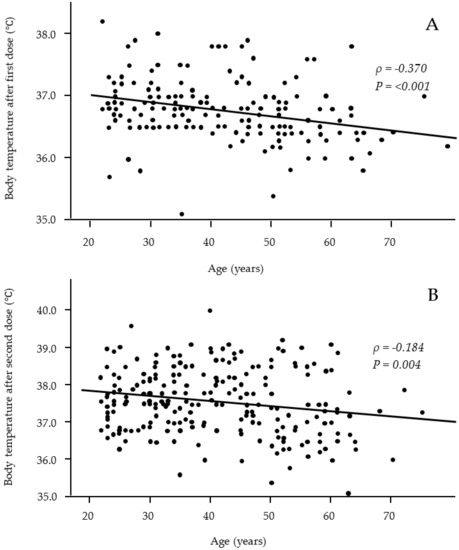
<p>Relationships between age and body temperature after the first (<b>A</b>) and second (<b>B</b>) vaccine doses. Significant negative correlations were observed after both the first and second vaccine doses. (<b>A</b>: <span class="html-italic">n</span> = 176; <b>B</b>: <span class="html-italic">n</span> = 243).</p> Full article ">Figure 2
<p>Relationships between body temperature after the second vaccine dose and age-adjusted anti-SARS-CoV-2 Ab titers at 3 months (<b>A</b>) and 6 months (<b>B</b>) after the second dose of the vaccine. Significant positive correlations were observed at 3 months after vaccination but not at 6 months. (<b>A</b>: <span class="html-italic">n</span> = 243; <b>B</b>: <span class="html-italic">n</span> = 243).</p> Full article ">
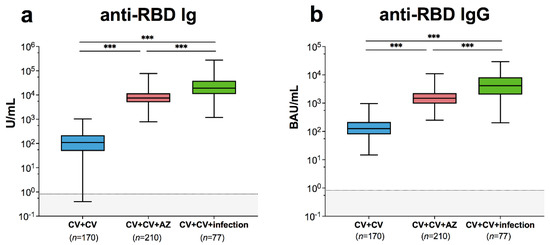
<p>SARS-CoV-2-specific binding antibody responses and neutralizing activities. Immune response of individuals with SARS-CoV-2 breakthrough infection (CV + CV + Infection) was compared to those with fully vaccinated CoronaVac vaccines without infection (CV + CV) and those who received AZD1222 as third booster (CV + CV + AZ). Serum (<b>a</b>) anti-RBD Ig activity, (<b>b</b>) anti-RBD IgG-binding antibody units. The results are shown as Geometric mean titres with 95% CIs. The cut-off value is indicated as dotted lines. Statistics were calculated using one-way ANOVA with Bonferroni correction. *** <span class="html-italic">p</span> < 0.001.</p> Full article ">Figure 2
<p>Neutralizing activities against (<b>a</b>) wild-type, (<b>b</b>) B.1.1.7-alpha, (<b>c</b>) B.1.351-beta, and (<b>d</b>) B.1.617.2-delta using surrogate virus neutralization test (sVNT). The fully vaccinated individuals with two doses of CoronaVac (CV+CV), the fully vaccinated individuals with two doses of CoronaVac then administered a third vaccination with AZD1222 (CV+CV+AZ), and the fully vaccinated individuals with two doses of CoronaVac followed by SARS-CoV-2 breakthrough infection (CV+CV+infection) were compared. Median values with IQRs are shown as horizontal bars. Dotted lines indicate cut-off values, and grey shaded areas depict values under the cut-off. Statistics were calculated using Kruskal–Wallis tests with Dunn’s post hoc correction. * <span class="html-italic">p</span> < 0.05, ** <span class="html-italic">p</span> < 0.01, *** <span class="html-italic">p</span> < 0.001. ns indicates no statistical significance.</p> Full article ">Figure 3
<p>Live SARS-CoV-2 serum dilution titres were determined against B.1.617.2-delta and B.1.1.529-omicron in serum samples from individuals with breakthrough infection determined using focus reduction neutralization test 50 values (FRNT50). Number indicates the geometric mean titres with 95% CIs. Statistics were calculated using Wilcoxon matched pair signed rank test. *** <span class="html-italic">p</span> < 0.001.</p> Full article ">
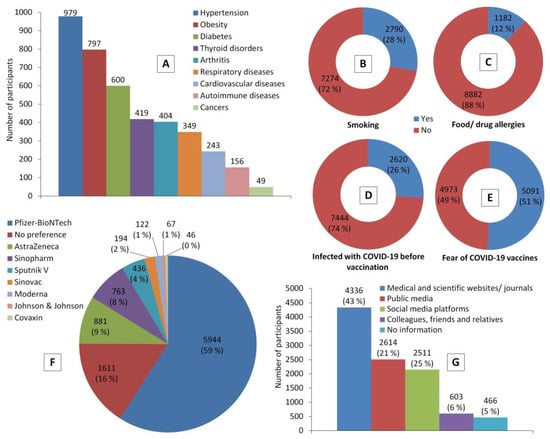
<p>Participants’ health status indicators and their perceptions towards COVID-19 vaccines before receiving a COVID-19 vaccine. Chart (<b>A</b>) represents the most common chronic diseases that were reported by participants. (<b>B</b>–<b>E</b>) show proportions of participants who are smokers, have food and/or drug allergies, had experienced COVID-19 infection, had experienced COVID-19 vaccine hesitancy and related fears, respectively. (<b>F</b>) shows frequencies of COVID-19 vaccines preferred by participants, while (<b>G</b>) shows the credible sources of information about COVID-19 vaccines among them.</p> Full article ">Figure 2
<p>Participants’ post-vaccination information. (<b>A</b>) Interval between receiving a COVID-19 vaccine and participating in this study (<span class="html-italic">n</span> = 10,064). (<b>B</b>) Time of COVID-19 vaccine breakthrough infection (<span class="html-italic">n</span> = 471). (<b>C</b>) Characterization of participants who experienced COVID-19 vaccine breakthrough infections based on the type of vaccine and number of doses (<span class="html-italic">n</span> = 471; 4.7%). * The perception was calculated out of the total number of participants who experienced vaccine breakthrough infection (<span class="html-italic">n</span> = 471); ** the perception was calculated out of the total number of participants who received the vaccine (<a href="#vaccines-10-00366-t003" class="html-table">Table 3</a>).</p> Full article ">Figure 3
<p>Severity of side effects following COVID-19 vaccination.</p> Full article ">Figure 4
<p>Side effects of COVID-19 vaccines. (<b>A</b>), the most common post-vaccination side effects; (<b>B</b>), interval between receiving a COVID-19 vaccine and experiencing side effects; (<b>C</b>), duration of post-vaccination side effects; (<b>D</b>), coping responses to post-vaccination side effects.</p> Full article ">Figure 5
<p>Participants’ responses to belief-based questions after COVID-19 vaccination.</p> Full article ">
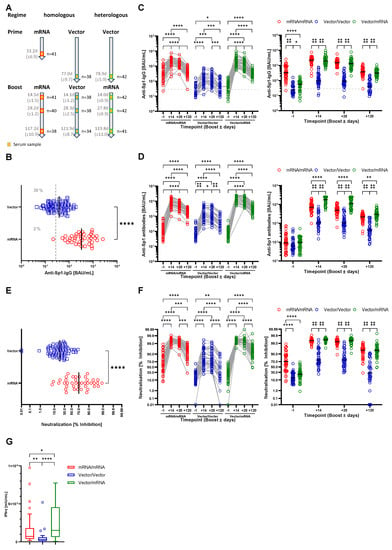
<p>Homologous and heterologous prime-boost immunization regimens induce anti-SARS-CoV-2 antibody production and immunity. (<b>A</b>) Study design and sample generation. Based on the received vaccinations, participants were grouped into the mRNA/mRNA, Vector/Vector or Vector/mRNA group. Serum samples were obtained one day before as well as 14, 28 and 120 days after booster. (<b>B</b>) Serum levels of anti-SARS-CoV-2-Sp1-IgG antibodies after vector (blue) or mRNA (red) prime one day before booster vaccination. The dashed line indicates the applied cutoff for positivity. (<b>C</b>) Left: Profile of serum anti-SARS-CoV-2-Sp1-IgG antibodies of individual participants based on the different vaccination strategies (red-mRNA/mRNA; blue-Vector/Vector; green-mRNA/Vector). Connected circles represent antibody levels of individual participants. Right: Serum anti-SARS-CoV-2-Sp1-IgG antibodies according to the study groups at the different time points. (<b>D</b>) Left: Profile of serum anti-SARS-CoV-2-Sp1 antibodies of individual participants based on the different vaccination strategies and indicated groups. Connected circles represent antibody levels for individual participants. Right: Serum anti-SARS-CoV-2-Sp1 antibodies according to the study groups at the different time points. (<b>E</b>) Levels of neutralizing antibodies after Vector (blue) or mRNA (red) prime one day before booster vaccination. (<b>F</b>) Left: Profile of neutralizing antibodies of individual participants within the indicated groups. Connected circles represent the antibody levels of an individual participant. Right: Neutralizing antibodies according to the study groups at the different time points. (<b>F</b>) IFN-γ release upon stimulation with SARS-CoV-2 peptides four months post booster vaccination (red-mRNA/mRNA, blue-Vector/Vector, green-mRNA/Vector). Outliers have been identified by ROUT method and excluded from statistical analysis. Statistical analyses: Mann–Whitney test (<b>B</b>,<b>E</b>), Mixed-effects analysis with Tukey’s multiple comparison test within and between groups (<b>C</b>,<b>D</b>,<b>F</b>) and Kruskal–Wallis test (<b>G</b>). * <span class="html-italic">p</span> < 0.05, ** <span class="html-italic">p</span> < 0.01, *** <span class="html-italic">p</span> < 0.001, **** <span class="html-italic">p</span> < 0.0001.</p> Full article ">Figure 2
<p>Reactogenicity after prime vaccinations with an mRNA or Vector vaccine and after booster vaccination for the mRNA/mRNA, Vector/Vector (V/V) and Vector/mRNA (V/mRNA) groups. (<b>A</b>) Analysis of local and systemic reactions; (<b>B</b>) analysis of the severity of reactions based on the number of symptoms; (<b>C</b>) analysis of the frequencies of local reactions; (<b>D</b>) analysis of the frequencies of systemic reactions.</p> Full article ">Figure 3
<p>Analysis of autoantibody levels in the serum of the participants at the different time points and in the different groups (red-mRNA/mRNA; blue-Vector/Vector; green-Vector/mRNA). Connected circles represent the antibody levels of an individual participant. (<b>A</b>) anti-Cardiolipin; (<b>B</b>) anti-Prothrombin; (<b>C</b>) anti-β2-Glycoprotein; (<b>D</b>) anti-CCP; (<b>E</b>) anti-TTG autoantibody levels in the indicated groups. (<b>F</b>) Analysis of ANAs in serum samples of the shown groups. Color of the boxes indicate individual titers and numbers state the respective patterns. Statistical analyses by Mixed-effects analysis with Tukey’s multiple comparison test within and between groups (<b>C</b>). * <span class="html-italic">p</span> < 0.05, ** <span class="html-italic">p</span> < 0.01, *** <span class="html-italic">p</span> < 0.001, **** <span class="html-italic">p</span> < 0.0001.</p> Full article ">
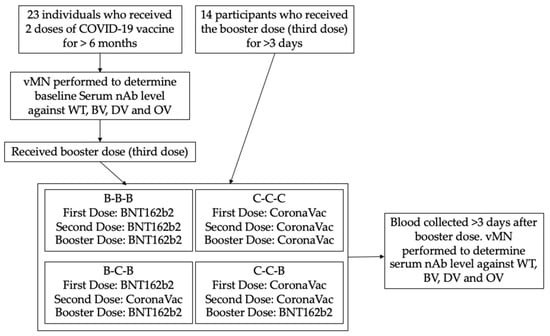
<p>Procedure of the study. vMN: virus microneutralization assay; nAb: neutralizing antibody; WT: SARS-CoV-2 wild type; BV: SARS-CoV-2 Beta variant; DV: SARS-CoV-2 Delta variant; OV: SARS-CoV-2 Omicron variant.</p> Full article ">Figure 2
<p>GMT titre of different vaccine combinations against SARS-CoV-2 variants at baseline and post booster vaccination. (<b>a</b>) Wild type; (<b>b</b>) Beta variant; (<b>c</b>) Delta variant; (<b>d</b>) Omicron variant; * = <span class="html-italic">p</span> < 0.05; ns = non-significant.</p> Full article ">Figure 3
<p>vMN titre against Omicron variant after booster dose, all groups included; * = <span class="html-italic">p</span> < 0.05; ** = <span class="html-italic">p</span> < 0.005; ns = non-significant.</p> Full article ">
<p>Anti-S1 antibody response at pre-vaccination (within 14 days prior to the first dose), within 7 days prior to the second dose and 14 days (+/− 7 days) after the second dose of BNT162b2 in healthy volunteers and patients with hematopoietic stem cell transplantation.</p> Full article ">Figure 2
<p>Anti-S1 titers after the second dose in each subgroup of transplant patients. Median optical density of antibody levels in patients with low IgG levels (<600 mg/dL), steroid treatment and low lymphocytes (<1000/μL) was significantly lower than in the other patients. There was no significant difference in S1-antibody titers between the group taking calcineurin inhibitors and the group not taking them (<span class="html-italic">p</span> = 0.45).</p> Full article ">Figure 3
<p>Relationship between S1 titers after the second dose and duration from transplantation to vaccination. The perforated line indicates the threshold (0.26) for seroconversion and the solid line indicates the regression line.</p> Full article ">
<p>Trial profile.</p> Full article ">Figure 2
<p>Change in neutralizing activity in participants after recovering from COVID-19. Convalescent patients infected by COVID-19 aged above 18 years were recruited, and blood samples were taken after discharge and at 6 weeks, 12 weeks, 6 months, and 1 year post recovery. vMN was used to determine the neutralizing antibody in sera. BL: baseline; W6: 6 weeks post recovery; W12: 12 weeks post recovery; M6: 6 months post recovery; Y1: 1 year post recovery; <span class="html-italic">p</span> < 0.05, statistically significant difference. Each dot represents an individual serum sample, and the error bar represents the 95% confidential interval (CI).</p> Full article ">Figure 3
<p>GMT fold change after vaccination. (<b>a</b>) Recovered individuals previously infected by COVID-19 received a booster dose of BNT162b2 (PC-B) or CoronaVac (PC-C) and had their blood taken at baseline and at day 28 post vaccination. SARS-CoV-2 naïve participants received two doses of BNT 162b2 (CN-B) or CoronaVac (CN-C) and has their blood collected at baseline, on day 21 (CN-B) and day 28 (CN-C), and on day 56 after their first dose. Neutralizing antibody titre in serum was determined with vMN, and GMT change against the wild type (<b>b</b>) and Delta variant (<b>c</b>) was determined by comparing the antibody titre after vaccination with the antibody titre at baseline. PFD: post first dose; PSD: post second dose.</p> Full article ">Figure 4
<p>Comparison of neutralizing antibody titre against wild type and Delta variant after vaccination. Recovered individuals previously infected by COVID-19 received a booster of BNT162b2 (PC-B) or CoronaVac vaccines (PC-C) and had their blood taken at baseline and day 28 post vaccination. SARS-CoV-2 naïve participants received two doses of BNT 162b2 (CN-B) or CoronaVac (CN-C) and had their blood collected at baseline, on day 21 (CN-B) or day 28 (CN-C), and on day 56 after their first dose. vMN was used to determine neutralizing antibody titre in sera from (<b>a</b>) PC-B, (<b>b</b>) PC-C, (<b>c</b>) CN-B, and (<b>d</b>) CN-C. WT: wild type; DV: Delta variant; BL: baseline; PFD: post first dose; PSD: post second dose.</p> Full article ">
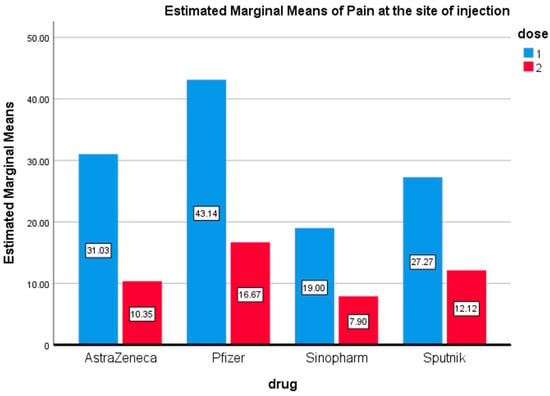
<p>Pain at the Injection Site. Estimated marginal means of pain at the site of injection after the first and second doses of vaccines used in the Kingdom of Bahrain.</p> Full article ">Figure 2
<p>Fever. Estimated marginal means of fever after first and second doses of vaccines used in the Kingdom of Bahrain.</p> Full article ">Figure 3
<p>Headache. Estimated marginal means of headache after first and second doses of vaccines used in the Kingdom of Bahrain.</p> Full article ">Figure 4
<p>Myalgia. Estimated marginal means of myalgia after first and second doses of vaccines used in the Kingdom of Bahrain.</p> Full article ">Figure 5
<p>Nausea. Estimated marginal means of nausea after first and second doses of vaccines used in the Kingdom of Bahrain.</p> Full article ">Figure 6
<p>Cough. Estimated marginal means of cough after first and second doses of vaccines used in the Kingdom of Bahrain.</p> Full article ">Figure 7
<p>Fatigue. Estimated marginal means of fatigue after first and second doses of vaccines used in the Kingdom of Bahrain.</p> Full article ">Figure 8
<p>Pearson’s heatmap. Pearson’s heatmap illustrates the correlation among different side effects of COVID-19 vaccines that have been used in the Kingdom of Bahrain. * <span class="html-italic">p</span> < 0.05, ** <span class="html-italic">p</span> < 0.01, *** <span class="html-italic">p</span> < 0.001.</p> Full article ">
<p>The flow-chart of patients’ recruitment and study protocol.</p> Full article ">Figure 2
<p>Comparison of antibody levels in the HD- and RD-COVID-19-positive subgroups before vaccination (<b>A</b>) and 8 days after the first vaccine dose (<b>B</b>).</p> Full article ">Figure 3
<p>Boxplot (median, hinges: first and third quartiles, whiskers: the largest value no further than 1.5 * IQR from the hinge) showing humoral response to the vaccination as measured with antibody levels in the RD- and HD-COVID-19-negative subgroups on the day of the second dose (FD: <span class="html-italic">n</span> = 152, HD: <span class="html-italic">n</span> = 33; (<b>A</b>) and 8–10 days after the second dose for participants whose results were within the test detection limit (FD: <span class="html-italic">n</span> = 45, HD: <span class="html-italic">n</span> = 14; (<b>B</b>)).</p> Full article ">
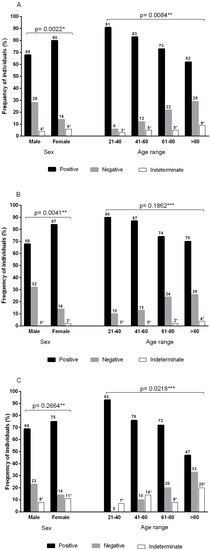
<p>Frequencies of anti-SARS-CoV-2 antibodies according to sex and age group. (<b>A</b>) Pooled frequencies of anti-SARS-CoV-2 total antibodies (S1/S2) plus anti-SARS-CoV-2 IgG neutralizing antibodies (RBD-S1). Sample size by sex: male (<span class="html-italic">n</span> = 138) and female (<span class="html-italic">n</span> = 220). Sample size by age group: 21–40 (<span class="html-italic">n</span> = 35), 41–60 (<span class="html-italic">n</span> = 60), 61–80 (<span class="html-italic">n</span> = 221), and >80 (<span class="html-italic">n</span> = 42). (<b>B</b>) Frequencies of total anti-SARS-CoV-2 antibodies (S1/S2). Sample size by sex: male (<span class="html-italic">n</span> = 77) and female (<span class="html-italic">n</span> = 128). Sample size by age group: 21–40 (<span class="html-italic">n</span> = 20), 41–60 (<span class="html-italic">n</span> = 39), 61–80 (<span class="html-italic">n</span> = 119), and >80 (<span class="html-italic">n</span> = 27). (<b>C</b>) Frequencies of neutralizing IgG anti-SARS-CoV-2 (RBD-S1) antibodies. Sample size by sex: male (<span class="html-italic">n</span> = 61) and female (<span class="html-italic">n</span> = 92). Sample size by age group: 21–40 (<span class="html-italic">n</span> = 15), 41–60 (<span class="html-italic">n</span> = 21), 61–80 (<span class="html-italic">n</span> = 102), and >80 (<span class="html-italic">n</span> = 15). * Indeterminate results were not included in the statistical analysis; ** chi-square test; *** G test.</p> Full article ">
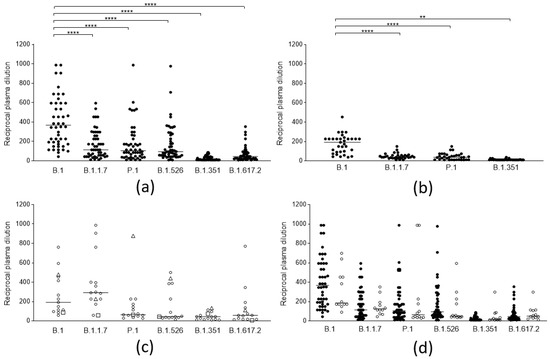
<p>Neutralization activity of SARS-CoV-2 anti-spike antibodies from different groups of subjects against selected viral lineages. (<b>a</b>) Neutralization titers of vaccinees (<span class="html-italic">n</span> = 50) 2 weeks after the second dose of the BNT162b2 vaccine against 6 viral lineages. Three data points are outside the axis limits. Statistical difference was assessed by the Wilcoxon matched pairs signed rank test. (<b>b</b>) Neutralization titers of blood donors naturally infected by the B.1 lineage (<span class="html-italic">n</span> = 33) against 4 viral lineages. Statistical difference was assessed by the Wilcoxon matched pairs signed rank test. (<b>c</b>) Neutralization titers of blood donors naturally infected by the B.1.1.7 (white circles, <span class="html-italic">n</span> = 13), by P.1 (white triangles, <span class="html-italic">n</span> = 1), and B.1.351(white squares, <span class="html-italic">n</span> = 1) against 6 viral lineages. (<b>d</b>) Neutralization titers of subjects who became infected after a second dose of the BNT162b2 vaccine (vaccine failure, white circles, <span class="html-italic">n</span> = 12) compared to those from the general population of vaccinees (black circles, <span class="html-italic">n</span> = 50). Reductions in neutralizing titers were not statistically significant. Three data points are outside the axis limits. Statistical difference was assessed by the Mann-Whitney rank test. Neutralization titers <20 and >1280 were plotted, respectively, as 10 and 2560. Statistical significance: ns = <span class="html-italic">p</span> > 0.05, ** = <span class="html-italic">p</span> < 0.01, **** = <span class="html-italic">p</span> < 0.0001. Horizontal lines represent medians.</p> Full article ">Figure 2
<p>Antibody binding activity of sera from different groups of subjects. Antibody binding activity of: 50 naïve subjects vaccinated with a double dose of the BNT162b2 vaccine (BNT II: black circles); 12 subjects who became infected after a second dose of the BNT162b2 vaccine (BNT fail: white circles); 5 naïve subjects vaccinated with a double dose of AZD1222 (AZD II: black squares); 3 subjects vaccinated with a single dose of the BNT162b2 after natural infection (BNT I inf; black triangles); subjects vaccinated with a single dose of the AZD1222 vaccine after natural infection contracted between February and April 2020 (AZD I inf (Feb-Apr 20): white squares, <span class="html-italic">n</span> = 5), and between October to December 2020 (AZD I inf (Oct-Dec 20): white triangles, <span class="html-italic">n</span> = 5); subjects vaccinated with a double dose of the BNT162b2 vaccine after natural infection (BNT II inf: black diamonds <span class="html-italic">n</span> = 15), and the AZD1222 vaccine after natural infection (AZD II inf: white diamonds, <span class="html-italic">n</span> = 3). Values are expressed in binding antibody units (BAU/mL) according to the WHO standard. Horizontal lines represent medians.</p> Full article ">Figure 3
<p>Neutralization titers of sera from vaccinees with anamnestic response and immunological memory who had already experienced PCR-confirmed SARS-CoV-2 infection against different viral lineages. (<b>a</b>) Neutralization titers of subjects vaccinated with 2 doses of the BNT162b2 (black circles, <span class="html-italic">n</span> = 15), and the AZD1222 (white circles, <span class="html-italic">n</span> = 3), vaccines against 6 viral lineages of SARS-CoV-2. Horizontal lines represent medians. (<b>b</b>) Neutralization titers against 6 viral lineages of 9 subjects infected between February and April 2020 (black circles) compared to those of 9 subjects infected between October and December 2020 (white circles), both vaccinated with 2 doses of vaccine. Columns represent means, and error bars represent the standard deviation. Reductions of neutralizing titers were not statistically significant. (<b>c</b>) Neutralization titers against 6 viral lineages of 6 subjects infected between February and April 2020 (black circles), compared to 7 subjects infected between October-December 2020 (white circles), both vaccinated with 1 dose of vaccine. Columns represent means, and error bars represent the standard deviation. Reductions of neutralizing titers were not statistically significant. Statistical difference was assessed by the Mann-Whitney rank test. Neutralization titers <20 and >1280 were plotted as 10 and 2560, respectively.</p> Full article ">Figure 4
<p>Trend of neutralizing titers against different viral lineages in naive vaccinees and in vaccinees with previous SARS-CoV-2 after a single and a double dose of the respective vaccines. (<b>a</b>) Neutralization titers of 10 naïve subjects vaccinated with a single (black circles), and a double dose (white circles), of the BNT162b2 vaccine (<b>b</b>) Neutralization titers of 5 naïve subjects vaccinated with a single (black circles), and a double dose (white circles), of the AZD1222 vaccine (<b>c</b>) Neutralization titers of 3 subjects vaccinated with a single (black circles), and a double dose (white circles), with the BNT162b2 vaccine after natural infection (<b>d</b>) Neutralization titers of 3 subjects vaccinated with a single (black circles), and a double dose (white circles), of the AZD1222 vaccine after natural infection.</p> Full article ">
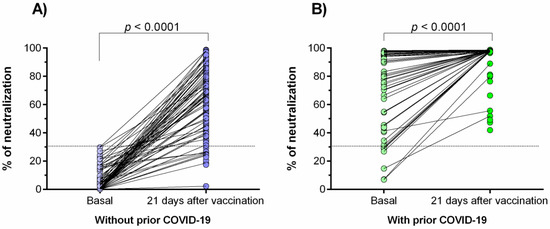
<p>Percentage of neutralizing signal of antibodies generated in response to the Ad5-nCoV vaccine. (<b>A</b>) Individuals without prior COVID-19; (<b>B</b>) individuals with prior COVID-19. Differences were calculated by the Wilcoxon signed-rank test. The dotted line indicates the cut-off point for the neutralization test (>30%). The “basal” status represents the neutralization percentage before the effect of vaccination (3 days after vaccination).</p> Full article ">Figure 2
<p>Comparison of the neutralization percentages of the antibodies generated in response to the Ad5-nCoV vaccine. The difference between all groups was calculated with the U-Mann–Whitney test or the Wilcoxon signed-rank test. The data are provided as medians and interquartile ranges. ****, <span class="html-italic">p</span> < 0.0001; **, <span class="html-italic">p</span> < 0.001.</p> Full article ">Figure 3
<p>Relationship between prior COVID-19 clinical course and days after infection with the percentage of neutralization. (<b>A</b>) Comparison of basal neutralization percentage between individuals with different prior COVID-19 clinical courses; (<b>B</b>) comparison of neutralization percentage after 21 days of immunization with the Ad5-nCoV vaccine among individuals with different prior COVID-19 clinical courses. Correlation between percentage of neutralization and the time of a previous COVID-19 infection: (<b>C</b>) Basal neutralization percentage, and (<b>D</b>) neutralization percentage after 21 days of the vaccination. The difference between all groups was calculated with the Kruskal–Wallis test, followed by the U-Mann–Whitney test. Data are provided as median and interquartile ranges.</p> Full article ">Figure 4
<p>Correlation between the age and neutralization percentage. (<b>A</b>) After 21 days of vaccination in patients without prior COVID-19; (<b>B</b>) in basal status in patients with prior COVID-19; (<b>C</b>) after 21 days of vaccination in patients with prior COVID-19. Analysis was evaluated by the Spearman’s rank correlation coefficient.</p> Full article ">Figure 5
<p>Anti-Ad5 antibodies and percentage of neutralization. Correlation between anti-Ad5 antibodies and percentage of neutralization of anti-SARS-CoV-2 antibodies: (<b>A</b>) after 21 days of vaccination in patients without prior COVID-19, (<b>B</b>) in basal status in patients with prior COVID-19, and (<b>C</b>) after 21 days of vaccination in patients with prior COVID-19. Levels of anti-Ad5 antibodies generated in response to the Ad5-nCoV vaccine in individuals without (<b>D</b>) and with (<b>E</b>) prior COVID-19.</p> Full article ">
<p>SARS-CoV-2 specific antibodies of each time-point. Neutralizing antibodies, RBD IgM, and IgG antibodies were examined on D-1, D14, and D42 after vaccination. (<b>A</b>) neutralizing antibodies; (<b>B</b>) RBD IgM antibodies; (<b>C</b>) RBD IgG antibodies. Data points show mean ± SD; the error bars reflect SD. * <span class="html-italic">p</span> < 0.05; ** <span class="html-italic">p</span> < 0.01.</p> Full article ">Figure 2
<p>Key cytokines of each time point. Key cytokines, containing IL-5, IFN-α, IL-2, IL-6, IL-1β, IL-10, IFN-γ, IL-8, IL-17, IL-4, IL-12P70, and TNF-α were examined on D-1, D14, and D42 after vaccination. (<b>A</b>) IL-5, IL-1β, IFN-γ, and IL-8; (<b>B</b>) IFN-α, IL-2, IL-6, and IL-10; (<b>C</b>) IL-17, IL-4, IL-12P70, and TNF-α. Data points show mean ± SD; the error bars reflect SD. * <span class="html-italic">p</span> < 0.05; ** <span class="html-italic">p</span> < 0.01.</p> Full article ">Figure 3
<p>Comparison of key cytokines in different groups. Key cytokines contained IL-5, IFN-α, IL-2, IL-6, IL-1β, IL-10, IFN-γ, IL-8, IL-17, IL-4, IL-12P70, and TNF-α. (<b>A)</b> In increased group, comparing the differences of cytokines between the two time points D14 and D42. (<b>B</b>) In decreased group, comparing the differences of the cytokines between the two time points D14 and D42. (<b>C</b>) Comparing the differences of each cytokine between the increased group and the decreased group on D14. (<b>D</b>) Differences of each cytokine between the increased group and the decreased group on D42. * <span class="html-italic">p</span> < 0.05; ** <span class="html-italic">p</span> < 0.01; NS—no statistically significant differences.</p> Full article ">Figure 4
<p>Comparison of lymphocyte subsets between 3 time points: (<b>A</b>) basic lymphocyte subsets; (<b>B</b>) activated lymphocyte subset (CD71+); (<b>C</b>) proliferating lymphocyte subsets (CD57+); (<b>D</b>) T-lymphocytes subsets; (<b>E</b>) B-lymphocyte subsets; (<b>F</b>) NK cell subsets. * <span class="html-italic">p</span> < 0.05; ** <span class="html-italic">p</span> < 0.01; *** <span class="html-italic">p</span> < 0.001; NS—no statistically significant differences.</p> Full article ">Figure 5
<p>Comparison of lymphocyte subsets between two vaccines: (<b>A</b>) basic lymphocyte subsets on D-1; (<b>B</b>) lymphocyte subsets on D14; (<b>C</b>) lymphocyte subsets on D42. * <span class="html-italic">p</span> < 0.05; ** <span class="html-italic">p</span> < 0.01; NS—no statistically significant differences.</p> Full article ">Figure 6
<p>Comparison of lymphocyte subsets in different groups: (<b>A</b>) in increased group, comparing the differences of lymphocyte subsets between the two time points D14 and D42; (<b>B</b>) in decreased group, comparing the differences of lymphocyte subsets between the two time points D14 and D42; (<b>C</b>) comparing the differences of lymphocyte subsets between the increased group and the decreased group on D14; (<b>D</b>) comparing the differences of lymphocyte subsets between the increased group and the decreased group on D42. * <span class="html-italic">p</span> < 0.05; ** <span class="html-italic">p</span> < 0.01; *** <span class="html-italic">p</span> < 0.001; NS—no statistically significant differences.</p> Full article ">
<p>Spike immunoglobulin G and neutralizing antibody levels after the two intramuscular CoronaVac vaccinations and one intradermal ChAdOx1 vaccination. The green bar graphs present neutralizing antibody levels (%) whereas the blue line graph presents spike IgG levels (AU/mL). Ab, antibody; ID, intradermal; IM, intramuscular; IgG, immunoglobulin G.</p> Full article ">Figure 2
<p>SARS-CoV-2-specific T cells were detected using interferon-gamma ELISpot assay after the intradermal ChAdOx1. The figure showed scanned images and SFU/well counts for unstimulated and stimulated PBMCs. The final SFU per one million PBMCs after subtracting the background was summarized in a table. ELISpot, enzyme-linked Immunospot; Neg, negative; Pos, positive; PHA, phytohemagglutinin; CMV, cytomegalovirus; RBD, receptor-binding domain; SFU, spot-forming unit; PBMCs, peripheral blood mononuclear cells.</p> Full article ">
<p>Flowchart for the process and results of study selection in the systematic review.</p> Full article ">Figure 2
<p>Forest plot of efficacy of vaccines based on different COVID-19 case definitions.</p> Full article ">Figure 3
<p>Adjusted funnel plots to examine publication bias: (<b>a</b>): safety; (<b>b</b>): efficacy after 2 doses; (<b>c</b>): efficacy after 1 dose; (<b>d</b>): severe cases; (<b>e</b>): hospitalization; (<b>f</b>): death (Begg’s funnel plot).</p> Full article ">
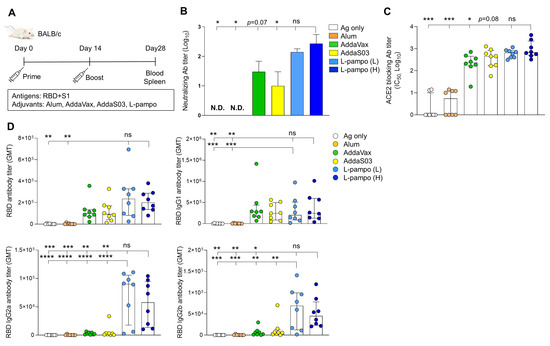
<p>Receptor-binding domain (RBD) and S1 antigens with L-pampo induce robust humoral responses. (<b>A</b>) A schematic of immunization strategy. BALB/c mice (total n = 48; n = 8/group) were immunized with severe acute respiratory syndrome coronavirus 2 (SARS-CoV-2) antigens (RBD and S1) with or without adjuvants intramuscularly (i.m.) on day 0 and day 14. (<b>B</b>) Neutralizing antibody production on day 28. (<b>C</b>) Angiotensin-converting enzyme 2 (ACE2)-blocking antibody titers on day 28. (<b>D</b>) RBD-specific total IgG, IgG1, IgG2a, and IgG2b antibodies on day 28. Data shown are median ± Interquartile range (IQR). Each dot represents an individual mouse. GMT in antibody assay indicates geometric mean titers. Data reflect 2 independent experiments (n = 4/group in single experiment). Asterisks indicate statistically significant differences in comparison to the L-pampo (L) or L-pampo (H). * <span class="html-italic">p</span> < 0.05; ** <span class="html-italic">p</span> < 0.01; *** <span class="html-italic">p</span> < 0.001; **** <span class="html-italic">p</span> < 0.0001; ns, non-significant, one way ANOVA with the Tukey’s test.</p> Full article ">Figure 2
<p>RBD and S1 antigens with L-pampo induce strong cell-mediated responses. (<b>A</b>,<b>B</b>) BALB/c mice (total n = 48, n = 8/group in (<b>A</b>); total n = 42, n = 7/group in (<b>B</b>)) were immunized with SARS-CoV-2 antigens (RBD and S1) with or without adjuvants i.m. on day 0 and day 14 as described in <a href="#vaccines-09-00957-f001" class="html-fig">Figure 1</a>A. On day 28, splenocytes were stimulated with the PepMix<sup>TM</sup> SARS-CoV-2(S-RBD) peptide pool, and RBD-specific IFN-γ secreting cells were analyzed as spot-forming cells (SFCs) by ELISPOT assay (<b>A</b>) or total IFN-γ production by ELISA assay (<b>B</b>). Data shown are median ± IQR. Each dot represents an individual mouse. Data reflect 2 independent experiments (n = 4/group in single experiment). Asterisks indicate statistically significant differences in comparison to the L-pampo (L) or L-pampo (H) groups. * <span class="html-italic">p</span> < 0.05; ** <span class="html-italic">p</span> < 0.01; *** <span class="html-italic">p</span> < 0.001; **** <span class="html-italic">p</span> < 0.0001; ns, non-significant, one way ANOVA with Tukey’s test.</p> Full article ">Figure 3
<p>RBD-Fc antigen with L-pampo induces robust humoral responses. (<b>A</b>) A schematic of the immunization strategy. BALB/c mice (total n = 42; n = 6/antigen-only; n = 8/Alum, AddaVax, AddaS03, or L-pampo (L); n = 4/CpG–Alum) were immunized with RBD-Fc with or without adjuvants i.m. on day 0 and day 21. (<b>B</b>) Neutralizing antibody production on day 35. (<b>C</b>) ACE2-blocking antibody titers on day 35. (<b>D</b>) Total RBD-specific IgG, IgG1, IgG2a, and IgG2b antibodies on day 35. Data shown are median ± IQR. Each dot represents an individual mouse. GMT in the antibody assay indicates geometric mean titers. Data reflect 2 independent experiments (n = 3/antigen-only group; n = 4/Alum, AddaVax, AddaS03, or L-pampo (L) group; n = 2/CpG-Alum group in single experiment). Asterisks indicate statistically significant differences in comparison to the L-pampo (L) group. * <span class="html-italic">p</span> < 0.05; ** <span class="html-italic">p</span> < 0.01; *** <span class="html-italic">p</span> < 0.001; **** <span class="html-italic">p</span> < 0.0001; one way ANOVA with the Tukey’s test.</p> Full article ">Figure 4
<p>RBD-Fc antigen with L-pampo induces cell-mediated responses. (<b>A</b>,<b>B</b>) BALB/c mice (total n = 42; n = 6/antigen-only; n = 8/Alum, AddaVax, AddaS03, or L-pampo (L); n = 4/CpG–Alum) were immunized with RBD-Fc with or without adjuvants i.m. on day 0 and day 21 as described in <a href="#vaccines-09-00957-f003" class="html-fig">Figure 3</a>A. On day 35, splenocytes were stimulated with the PepMix<sup>TM</sup> SARS-CoV-2(S-RBD) peptide pool, and RBD-specific IFN-γ secreting cells were analyzed as SFCs by ELISPOT assay (<b>A</b>) or total IFN-γ production by ELISA assay (<b>B</b>). Data shown are median ± IQR. Each dot represents an individual mouse. Data reflect 2 independent experiments (n = 3/antigen-only group; n = 4/Alum, AddaVax, AddaS03, or L-pampo (L) group; n = 2/CpG–Alum group in single experiment). Asterisks indicate statistically significant differences in comparison to the L-pampo (L) group. * <span class="html-italic">p</span> < 0.05; ** <span class="html-italic">p</span> < 0.01; *** <span class="html-italic">p</span> < 0.001; **** <span class="html-italic">p</span> < 0.0001; one way ANOVA with the Tukey’s test.</p> Full article ">Figure 5
<p>RBD and S1 antigens with L-pampo induce robust humoral and cellular responses in the ferret model. (<b>A</b>) A schematic of the immunization and virus challenge strategy in the ferret model. Ferrets (total n = 16, n = 4/PBS; n = 6/Ag only; n = 6/Ag + L-pampo) were immunized with the SARS-CoV-2 antigens (RBD and S1 with 30 μg per each) with L-pampo i.m. on day 0 and day 14. The antigen-only and PBS groups were as controls. On day 35, ferrets were intranasally challenged with 10<sup>5.5</sup> 50% tissue culture infective doses (TCID<sub>50</sub>/<sub>mL</sub>) SARS-CoV-2 (Korea Centers for Disease Control and Prevention; resource no. 43326) under anesthesia. Blood was collected every week for 5 weeks from the first immunization. After virus challenge, the nasal wash was collected on days 2, 4, 6, 8, 10, and 12. (<b>B</b>) Neutralizing antibody production on day 35 prior to challenge of virus. (<b>C</b>) On day 35, ferret PBMCs were stimulated with the RBD or S1 antigen and RBD or S1-specific IFN-γ-secreting cells were analyzed as SFCs by ELISPOT assay. (<b>D</b>) Viral load in nasal wash on days 2, 4, 6, and 12 after virus challenge by using a TCID<sub>50</sub> assay. Dotted lines represent lower limits of detection. Data shown are median ± IQR. Each dot represents an individual ferret. Data reflect 2 independent experiments (n = 2/PBS group; n = 3/Ag only or Ag + L-pampo group in single experiment). * <span class="html-italic">p</span> < 0.05; ** <span class="html-italic">p</span> < 0.01; two tailed Mann–Whiteny test (<b>B</b>); one way ANOVA with the Tukey’s test (<b>C</b>,<b>D</b>).</p> Full article ">Figure 6
<p>Signs of clinical symptoms after SARS-CoV-2 virus challenge. Immunized ferrets (total n = 16, n = 4/PBS; n = 6/Ag only; n = 6/Ag + L-pampo) were intranasally challenged with 10<sup>5.5</sup> TCID<sub>50</sub>/<sub>mL</sub> SARS-CoV-2 (Korea Centers for Disease Control and Prevention, resource no. 43326) under anesthesia. The body weight (%) (<b>A</b>) and temperature (°C) (<b>B</b>) of ferrets on days 2, 4, 6, 8, and 10 after SARS-CoV-2 virus challenge. Data shown are mean ± SD.</p> Full article ">
Full article ">Figure 1
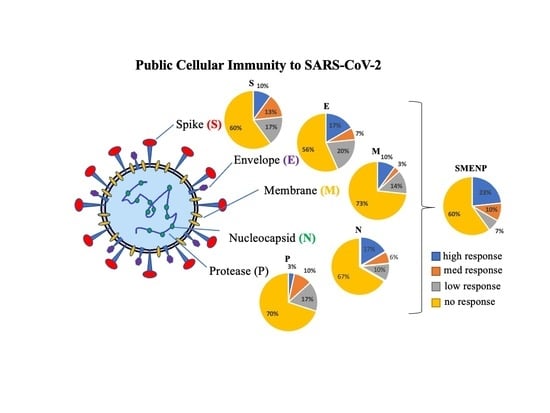
<p>Synthetic peptides of SARS-CoV-2 S, E, M, N, and P proteins and in vitro generation of antigen-specific T cells. (<b>A</b>) Schematic illustration of SARS-CoV-2 particle. (<b>B</b>) Representative S, E, M, N, and P protein domains. (<b>C</b>) Diagram of in vitro antigen-specific T cell generation. DCs and T lymphocytes were prepared from PBMCs and synthetic viral peptide-pulsed DCs were used as antigen presenting cells (APCs) to activate T cells.</p> Full article ">Figure 2
<p>SARS-CoV-2 specific T-cell precursor frequencies in healthy subjects. (<b>A</b>) IFN-γ ELISPOT assay. PBMCs of 30 healthy subjects were activated in vitro with individual or pooled S, E, M, N, and P peptide mixes, and IFN-γ reactive cells were detected. PHA activated T cells were used as positive controls. The HIV-1 Pol peptide pool was included as background control as all donors were HIV-1-negative. The group (PBMC) without antigen stimulation was also included as background control. Representative ELISPOT wells are shown on top, and the machine-documented spot numbers listed below were the mean values of duplicates for all 30 donors. (<b>B</b>) The number of spot-forming cells after background subtraction per indicated target antigens (below the background levels were shown as 0). Each symbol represents a peptide pool, and different colors represent different subjects. The bar represents the median response value of all subjects to each antigen peptide pool after deducting the background value. (<b>C</b>) Pie graph illustration of the diverse individual cellular immune response to the different viral antigens based on fold of increase of spot forming cells. The color classification of individual response illustrates different ranges of IFN-γ specific spots: high responder, >3 fold of increase in spots; medium responder, 2–3 fold of increase; low responder, 1.5–2 fold of increase; and no responder, <1.5 fold of increase.</p> Full article ">Figure 3
<p>Primary activated T cells for 12 days against SARS-CoV-2 antigens. (<b>A</b>) IFN-γ ELISPOT assay of T cells from selected responders. T cells were cultured for 12 days from the different subjects including no, low, medium, and high responders. PHA treatment served as positive control, and HIV-1 peptides and CTL without antigen served as background controls. (<b>B</b>) Bar graph analysis of the IFN-γ specific T-cell expansion fold of increase based on spot-forming cells against the different viral antigens for the five subjects. The error bars depict the variation range of the duplicates.</p> Full article ">Figure 4
<p>Secondary DC/T-cell activation at 30 days against SARS-CoV-2 antigens. (<b>A</b>) IFN-γ ELISPOT assay of two no responders after secondary antigen activation. The T cells after primary and secondary DC activation were cultured for 30 days from two no response donors. PHA served as a positive control, and HIV-1 peptide pools and CTL without antigen stimulation served as background controls. (<b>B</b>) The comparison of primary day 12 versus secondary day 30 IFN-γ spot expansion folds of T cells against indicated target antigens.</p> Full article ">Figure 5
<p>Effector function analyses of T cells against SARS-CoV-2 SEMNP antigens. After DC–T-cell coculture, the viral antigen-specific CTLs were analyzed for cytokine release and CD107a degranulation by intracellular staining and flow cytometry. The TNF-α, IFN-γ, IL-2, and CD107a production in T cells were illustrated in the FACS graphs after stimulations with SARS-CoV-2 antigenic peptides. PMA and ionomycin (PMA + ION) activation served as positive control, and HIV-1 peptide pools and CTL without antigen served as background controls. Flow cytometry analyses of TNF-α, IL-2, IFN-γ, and CD107a-positive cells in CD4-gated or CD8-gated populations of the representative subjects are illustrated. (<b>A</b>) The gated CD3 and CD8 T-cell populations and the control isotype antibody staining of the intracellular effectors. (<b>B</b>) Flow cytometry analysis of intracellular IFN-γ and CD107a in CD3, CD4, and CD8 gated populations. (<b>C</b>) Flow cytometry analysis of intracellular TNF-α and IL-2 in CD3, CD4, and CD8 gated populations.</p> Full article ">Figure 5 Cont.
<p>Effector function analyses of T cells against SARS-CoV-2 SEMNP antigens. After DC–T-cell coculture, the viral antigen-specific CTLs were analyzed for cytokine release and CD107a degranulation by intracellular staining and flow cytometry. The TNF-α, IFN-γ, IL-2, and CD107a production in T cells were illustrated in the FACS graphs after stimulations with SARS-CoV-2 antigenic peptides. PMA and ionomycin (PMA + ION) activation served as positive control, and HIV-1 peptide pools and CTL without antigen served as background controls. Flow cytometry analyses of TNF-α, IL-2, IFN-γ, and CD107a-positive cells in CD4-gated or CD8-gated populations of the representative subjects are illustrated. (<b>A</b>) The gated CD3 and CD8 T-cell populations and the control isotype antibody staining of the intracellular effectors. (<b>B</b>) Flow cytometry analysis of intracellular IFN-γ and CD107a in CD3, CD4, and CD8 gated populations. (<b>C</b>) Flow cytometry analysis of intracellular TNF-α and IL-2 in CD3, CD4, and CD8 gated populations.</p> Full article ">
<p>Perception of cancer patients on COVID-19 vaccination.</p> Full article ">Figure 2
<p>Responses of participants’ perception and concerns regarding COVID-19 pandemics.</p> Full article ">Figure 3
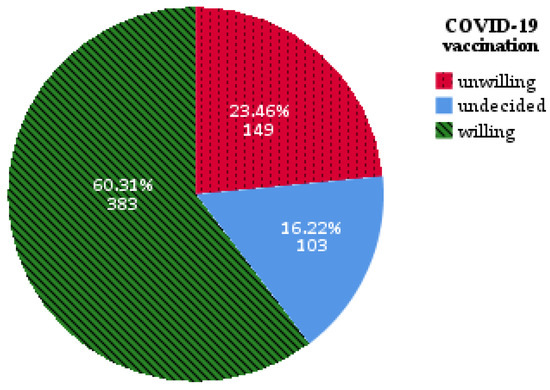
<p>Pie chart on score distribution of knowledge about vaccine (number of correct answers).</p> Full article ">
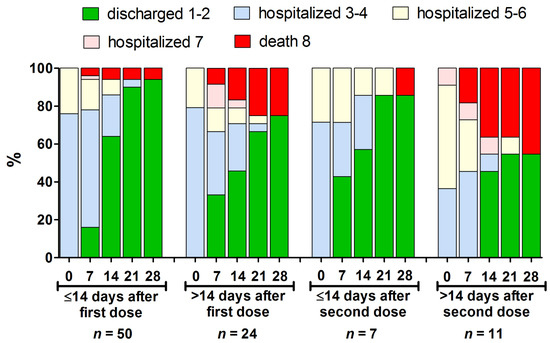
<p>The clinical course presented using an eight-score disease severity scale [<a href="#B19-vaccines-09-00781" class="html-bibr">19</a>] from baseline to day 28 of hospitalization in the different subsets of hospitalized patients who received at least one vaccine dose (<span class="html-italic">n</span> = 92). Further, 1–2 indicates not hospitalized patients; 3–4—hospitalized requiring no oxygen supplementation; 5–6—hospitalized, requiring normal oxygen supplementation or non-invasive ventilation; 7—hospitalized, requiring invasive mechanical ventilation or extracorporeal membrane oxygenation; 8—death.</p> Full article ">
<p>Comparison of the binding antibody units per milliliter (BAU/mL) ratio of SARS-CoV-2 IgG antibodies of the LT recipients and HCWs after the second vaccination. HCW: healthcare worker; BAU: binding antibody units; ml: milliliter; SARS-CoV-2: severe acute respiratory syndrome coronavirus type 2. **** <span class="html-italic">p</span> < 0.0001.</p> Full article ">
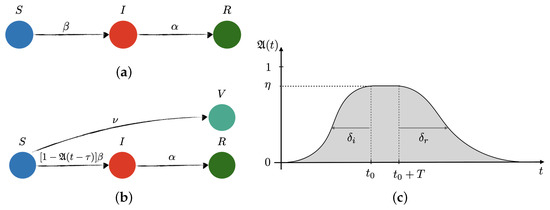
<p>Sketch of transitions in the (<b>a</b>) free and (<b>b</b>) controlled SIR network models of disease transmission, and (<b>c</b>) model of the preventive social response, <math display="inline"><semantics> <mrow> <mi mathvariant="fraktur">A</mi> <mo>(</mo> <mi>t</mi> <mo>)</mo> </mrow> </semantics></math>. <span class="html-italic">S</span>, <span class="html-italic">I</span>, <span class="html-italic">R</span> and <span class="html-italic">V</span> stand for susceptible, infected, recovered, and vaccinated, respectively. Additionally, <math display="inline"><semantics> <mi>β</mi> </semantics></math>, <math display="inline"><semantics> <mi>α</mi> </semantics></math> and <math display="inline"><semantics> <mi>ν</mi> </semantics></math> are the infection, recovery, and vaccination rates, respectively. In the controlled SIR model, the infection rate is reduced by the factor <math display="inline"><semantics> <mrow> <mo>(</mo> <mn>1</mn> <mo>−</mo> <mi mathvariant="fraktur">A</mi> <mo>(</mo> <mi>t</mi> <mo>−</mo> <mi>τ</mi> <mo>)</mo> <mo>)</mo> </mrow> </semantics></math>, which depends on the incubation time period, <math display="inline"><semantics> <mi>τ</mi> </semantics></math>, the effectiveness of the social response, <math display="inline"><semantics> <mrow> <mi>η</mi> <mo>∈</mo> <mo>[</mo> <mn>0</mn> <mo>,</mo> <mn>1</mn> <mo>]</mo> </mrow> </semantics></math>, the time when the awareness reaches its peak, <math display="inline"><semantics> <msub> <mi>t</mi> <mn>0</mn> </msub> </semantics></math>, the time extension of the maximum level of alert, <span class="html-italic">T</span>, and the characteristic times for reaching maximum awareness, so-called social inertia, <math display="inline"><semantics> <msub> <mi>δ</mi> <mi>i</mi> </msub> </semantics></math>, and the relaxation time after lifting restrictions, <math display="inline"><semantics> <msub> <mi>δ</mi> <mi>r</mi> </msub> </semantics></math>, respectively.</p> Full article ">Figure 2
<p>SARS-CoV-2 new daily cases (left axis): blue circles for first-wave data used to fit free and controlled SIR models (light-blue lines), red circles for second- and third-wave data used to test the models and their predictions (light-blue dashed lines). (<b>a</b>) Free SIR model captures the essence of the time evolution of new CoVid-19 cases over March–July 2020 (inset plot), but totally fails to predict the second and third waves. (<b>b</b>) The controlled SIR model without vaccination fits better to first-wave data (inset plot) than the free version. The grey area represents the effectiveness of preventive measures, <math display="inline"><semantics> <mrow> <mi mathvariant="fraktur">A</mi> <mo>(</mo> <mi>t</mi> <mo>)</mo> </mrow> </semantics></math> (right axis). The first wave of social awareness is fit together with <math display="inline"><semantics> <mi>β</mi> </semantics></math> and <math display="inline"><semantics> <mi>α</mi> </semantics></math>, showing a maximum of effectiveness <math display="inline"><semantics> <mrow> <msub> <mi>η</mi> <mn>1</mn> </msub> <mo>≃</mo> <mn>65</mn> <mo>%</mo> </mrow> </semantics></math>, social inertia <math display="inline"><semantics> <mrow> <msub> <mi>δ</mi> <mi>i</mi> </msub> <mo>≃</mo> <mn>21</mn> <mspace width="0.166667em"/> <mi mathvariant="normal">d</mi> </mrow> </semantics></math>, and social relaxation starting at mid June 2020, with prediction of no measures in <math display="inline"><semantics> <mrow> <msub> <mi>δ</mi> <mi>r</mi> </msub> <mo>≃</mo> <mn>45</mn> <mspace width="0.166667em"/> <mi mathvariant="normal">d</mi> </mrow> </semantics></math> after relaxation begins. The second wave of social awareness begins in September (confirmed by the Prime Minister [<a href="#B10-vaccines-09-00735" class="html-bibr">10</a>]), reaching <math display="inline"><semantics> <mrow> <msub> <mi>η</mi> <mn>2</mn> </msub> <mo>≃</mo> <mn>60</mn> <mo>%</mo> </mrow> </semantics></math> by mid October 2020 (three-tier system was introduced [<a href="#B11-vaccines-09-00735" class="html-bibr">11</a>]). The upsurge of CoVid-19 cases in December 2020 is again a consequence of social relaxation. (<b>c</b>–<b>e</b>) Controlled SIR model with vaccination rates: <math display="inline"><semantics> <mrow> <mn>0.1</mn> <mo>%</mo> <msup> <mi mathvariant="normal">d</mi> <mrow> <mo>−</mo> <mn>1</mn> </mrow> </msup> <mo>,</mo> <mspace width="0.166667em"/> <mn>0.2</mn> <mo>%</mo> <msup> <mi mathvariant="normal">d</mi> <mrow> <mo>−</mo> <mn>1</mn> </mrow> </msup> <mo>,</mo> </mrow> </semantics></math> and <math display="inline"><semantics> <mrow> <mn>0.4</mn> <mo>%</mo> <msup> <mi mathvariant="normal">d</mi> <mrow> <mo>−</mo> <mn>1</mn> </mrow> </msup> </mrow> </semantics></math>, respectively, along with a third-wave of preventive measures (expected to reach maximum effectiveness, <math display="inline"><semantics> <mrow> <msub> <mi>η</mi> <mn>3</mn> </msub> <mo>=</mo> <mn>70</mn> <mo>%</mo> </mrow> </semantics></math>, by the mid January 2021). To avoid a fourth wave, the vaccination campaign would need to deliver <math display="inline"><semantics> <mrow> <mo>∼</mo> <mn>200</mn> <mo>×</mo> <msup> <mn>10</mn> <mn>3</mn> </msup> </mrow> </semantics></math> vaccines per day (<math display="inline"><semantics> <mrow> <mo>∼</mo> <mn>0.4</mn> <mo>%</mo> <mi>N</mi> <mo>/</mo> <mi mathvariant="normal">d</mi> </mrow> </semantics></math>) as of the first week of January 2021.</p> Full article ">Figure 3
<p>Daily new cases (7-day moving average): UK (blue), Spain (red) and Italy (green).</p> Full article ">
<p>Characterization of VP6-RBD fusion protein. Rotavirus VP6 protein was used as a backbone to generate fusion protein (FP) carrying SARS-CoV-2 Spike (S) protein derived receptor-binding domain (RBD) as described in the Materials and Methods. The FP was crude purified from Sf9 insect cell pellets after 6-day culture with recombinant baculovirus and separated (5 μg/lane of total protein) under reducing conditions in SDS-PAGE following staining with Coomassie blue (<b>a</b>) or immunoblotting using primary antibodies against VP6 (<b>b</b>) or SARS-CoV-2 S protein (<b>c</b>). VP6-RBD FP (~70 kDa) before (A) and after (B) final clarification step is indicated by an arrow (<b>a</b>–<b>c</b>). Wild-type VP6 (~42 kDa) and commercial RBD protein (~23 kDa, migrating as a higher molecular weight due to glycosylation) were used as positive controls in SDS-PAGE and/or Western blot. Molecular weight marker (M) is shown with the respective molecular sizes (kDa). Binding of VP6-RBD, SARS-CoV-2 S (CoV-2 S, a positive control), and SARS-CoV-2 nucleoprotein (CoV-2 NP, a negative control) to immobilized human angiotensin-converting enzyme 2 (hACE2) by an ELISA-based binding assay (<b>d</b>). Optical density (OD) values at 490 nm of VP6-RBD (0–2.4 µg/well), CoV-2 S, and NP (both 0–0.04 µg/well) binding to 0.05 µg/well hACE2 are shown.</p> Full article ">Figure 2
<p>SARS-CoV-2 and VP6-specific antibody and T cell responses. Serum IgG antibody responses in mice following immunization with VP6-SARS-CoV-2 receptor-binding domain (VP6-RBD) fusion protein (FP), SARS-CoV-2 Spike (CoV-2 S, a positive control), or carrier only (PBS, a negative control) were analyzed by antigen-specific ELISAs and/or Western blot. SARS-CoV-2 S, RBD, and nucleoprotein (NP)-specific IgG antibodies are shown, represented by mean optical density (OD) values with standard error of the mean (SEM) of sera diluted 1:100 (<b>a</b>) and serum titration curves of CoV-2 S immunized mice (<b>b</b>). VP6-RBD FP immune sera were further used as a pool of individual sera (1:100 dilution) to detect SARS-CoV-2 RBD, S, and VP6 (each 1μg/lane) proteins under denaturing conditions in a Western blot (<b>c</b>). Molecular weight marker (M) is shown with the respective molecular sizes (kDa). VP6-specific IgG responses of VP6-RBD FP immunized and control mice are illustrated by mean OD values with SEM (<b>d</b>) and geometric mean titer (GMT) with 95% confidence intervals (<b>e</b>). If the starting dilution resulted in an OD value below the set cutoff, the sample was given an arbitrary value half of the starting dilution (ctrl, (<b>e</b>)). T cell responses of immunized and control mice splenocytes were analyzed by ELISPOT IFN-γ against SARS-CoV-2 S1 and NP (a negative control) peptide pool stimulation (<b>f</b>). Cell culture medium (CM) alone was used to determine background cytokine release. Mean IFN-γ spot-forming cells (SFC)/10<sup>6</sup> live splenocytes of duplicate wells with SEM are shown. Dashed horizontal lines in the panels represent the cutoff value for ELISA ((<b>a</b>,<b>b</b>,<b>d</b>,<b>e</b>), mean OD<sub>490</sub> + 3 × SD and at least 0.1 OD of negative control mice) and ELISPOT ((<b>f</b>), mean SFC/10<sup>6</sup> cells + 3 × SD of CM wells). Statistical significance was defined as <span class="html-italic">p</span> < 0.05 and hypothesis testing was two tailed. ns: not significant <span class="html-italic">p</span>-value.</p> Full article ">
<p>Frequency distribution of IgG<sub>SP</sub> versus days after the second dose of COVID-19 vaccines in LT recipients (<b>a</b>) BNT162b2 (Pfizer-BioNTech); (<b>b</b>) mRNA-1273 (Moderna). DA2D, days after the second dose of COVID-19 vaccines; prior-infected, pink-filled circle (<a href="#vaccines-09-00708-f001" class="html-fig">Figure 1</a>a); broken red and blue lines, IgG<sub>SP</sub> serology assay’s manufacturer-recommended positive cut-off value.</p> Full article ">Figure 2
<p>IgG<sub>SP</sub> levels in naïve subjects and LT patients after 2 doses of COVID-19 vaccine. NA2D, naïve subjects (non-transplanted and not had previous SARS-CoV-2 infection) after 2 doses of vaccine; TA2D, LT patients after 2 doses of vaccine; thick red line, median value.</p> Full article ">Figure 3
<p>Evaluation of immunogenicity following the double-dose Pfizer and Moderna vaccine regimen in LT recipients. Thick red line, median value; median (95% CI) (Pfizer—0.9 (0.0–4.1); Moderna—20.6 (0.8–80.2)).</p> Full article ">
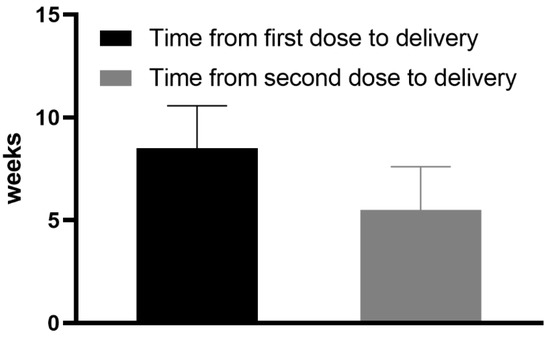
<p>Mean time (weeks) from the first and the second dose of vaccine to delivery.</p> Full article ">Figure 2
<p>Mean anti-S antibody titers in maternal and umbilical cord blood.</p> Full article ">Figure 3
<p>Correlation between the number of weeks from the first vaccine dose to delivery and the anti-S antibody titer in cord blood serum.</p> Full article ">Figure 4
<p>Correlation between the period (weeks) from the first vaccine dose to delivery and cord-to-maternal anti-S titer ratio.</p> Full article ">Figure 5
<p>Correlation between the period (weeks) from the second vaccine dose to delivery and cord-to-maternal anti-S titer ratio.</p> Full article ">Figure 6
<p>Correlation between the week of gestation when the first vaccine dose was administered and cord-to-maternal anti-S titer ratio.</p> Full article ">Figure 7
<p>Correlation between the week of gestation when the second vaccine dose was administered and cord-to-maternal anti-S titer ratio.</p> Full article ">
<p>Kaplan–Meier plots showing the probability of survival for the whole patient population.</p> Full article ">Figure 2
<p>Kaplan–Meier plots showing the probability of survival based on patients’ characteristics. (<b>A</b>) Patients aged less than 70 years (solid line) or older than or equal to 70 years (dashed line). Age showed prognostic significance for survival at a cut-off point set at 70 years (<span class="html-italic">p</span> < 0.0001), with an estimated 28-day survival rate of 67.4% and 21.4%, respectively. (<b>B</b>) Survival was not affected by gender (female, solid line; male, dashed line) (<span class="html-italic">p</span> = 0.086).</p> Full article ">Figure 3
<p>Kaplan–Meier plots showing the probability of survival based on clinical variables. (<b>A</b>) Patients with no comorbidity (solid line), 1 comorbidity (dashed line), and 2 or more comorbidities (dotted line). The number of comorbidities showed prognostic significance for survival (<span class="html-italic">p</span> = 0.0008), with an estimated 28-day survival rate of 61.8%, 51.7%, and 35.3%, respectively. (<b>B</b>) P/F ratio at presentation more than 200 (solid line) or less than or equal to 200 (dashed line). P/F ratio at presentation showed prognostic significance for survival at a cut-off point set at 200 (<span class="html-italic">p</span> < 0.0001), with an estimated 21-day survival rate of 52.4% and 14.7%, respectively. (<b>C</b>) CRP less than 124 (solid line) or more than or equal to 124 (dashed line). CRP values showed prognostic significance for survival at a cut-off point set at 124 mg/L (<span class="html-italic">p</span> = 0.0001), with an estimated 28-day survival rate of 74.9% and 25.4%, respectively. (<b>D</b>) LDH less than 395 (solid line) or more than or equal to 395 (dashed line). LDH values showed prognostic significance for survival at a cut-off point set at 395 U/L (<span class="html-italic">p</span> = 0.0001), with an estimated 28-day survival rate of 65.3% and 26.4%, respectively.</p> Full article ">Figure 4
<p>Kaplan–Meier plots showing the probability of survival based on treatments. (<b>A</b>) Patients treated with low-flux (solid line) or high-flux (dashed line) oxygen therapy. O2 therapy showed prognostic significance for survival (<span class="html-italic">p</span> < 0.0001), with an estimated 28-day survival rate of 50.0% and 23.3%, respectively. (<b>B</b>) No anticoagulation therapy (solid line) vs. LMWH at prophylaxis dose (dashed line) or therapeutic dose (dotted line). LMWH treatment showed prognostic significance for survival (<span class="html-italic">p</span> = 0.0001), with an estimated 28-day survival rate of 23.8%, 36.9%, and 37.1%, respectively. (<b>C</b>) No HCQ (solid line) vs. HCQ treatment (dashed line). HCQ showed prognostic significance for survival (<span class="html-italic">p</span> = 0.0029), with an estimated 28-day survival rate of 27.3% and 35.7%, respectively. (<b>D</b>) No antiviral (solid line) vs. antiviral treatment (dashed line). Antiviral therapy showed prognostic significance for survival (<span class="html-italic">p</span> < 0.0001), with an estimated 28-day survival rate of 22.4% and 60.1%, respectively. (<b>E</b>) No steroid (solid line) vs. steroid treatment (dashed line). Steroid therapy showed prognostic significance for survival (<span class="html-italic">p</span> < 0.0001), with an estimated 28-day survival rate of 18.2% and 47.9%, respectively. (<b>F</b>) No tocilizumab (solid line) vs. tocilizumab treatment (dashed line). Tocilizumab therapy showed prognostic significance for survival (<span class="html-italic">p</span> = 0.0059), with an estimated 28-day survival rate of 29.6% and 69.4%, respectively.</p> Full article ">Figure 5
<p>Kaplan–Meier plots showing the probability of survival based on the prognostic score model. Patients presenting none (solid line), one (dashed line), or both (dotted line) of the positive markers. Estimated 28-day survival rate varies from 94.0% to 51.3% and to 21.0%, respectively (<span class="html-italic">p</span> < 0.0001).</p> Full article ">
<p><b>Characterization of the B.1.1.50 + P681H variant.</b> Phylogenetic trees highlighting the genotype at site 681 in the S protein, with the wild-type proline (P) in green and the mutations histidine (H) and arginine (R) in yellow and blue, respectively. (<b>A</b>) SARS-CoV-2 genomes sequenced in Israel from March 2020 to January 2021 (<span class="html-italic">n</span> = 2482). The main clusters harboring the P681H mutation (in yellow) are the B.1.1.7 (20I/501Y.V1) and the B.1.1.50 + P681H variant. (<b>B</b>) SARS-CoV-2 genomes from of the B.1.1.50 lineage only (<span class="html-italic">n</span> = 489). The B.1.1.50 + P681H cluster is composed of local (Israel) viruses only, with the exception of 2 sequences from isolates identified in the Palestinian authorities, and includes a sub-cluster with an additional S protein non-synonymous mutation, A27S. Additional mutations are listed by each branch. Phylogenetic trees were created with Nextstrain Augur pipeline and visualized with Auspice [<a href="#B3-vaccines-09-00616" class="html-bibr">3</a>]. Non-Israeli B.1.1.50 lineage sequences were downloaded from GISAID and identified with Pangolin classification [<a href="#B4-vaccines-09-00616" class="html-bibr">4</a>].</p> Full article ">Figure 2
<p><b>Identification of the P681H mutation in sewers across Israel.</b> Frequency of P681H mutation in SARS-CoV-2 genomes sequenced from nine sewage samples of wastewater treatment plants across Israel each month in August 2020–January 2021. The frequency of the P681H mutation in each region was estimated by measuring the fraction of the mutation from the total number of nucleotides mapped at this position (i.e., depth of sequencing).</p> Full article ">Figure 3
<p><b>Neutralization of the B.1.1.50 + P681H variant.</b> Neutralization assays were carried out with VERO-E6 cells infected with the B.1.1.50 + P681H variant, B.1.1.7 variant and an Israel WT strain from Israel, using sera from fully vaccinated individuals. On day 6, plates were colorized overnight with Gentian violet +4% formaldehyde solution for virus neutralization. Titers were calculated by qualitative measurements of the cytopathic effect for each patient. Bars represent the geometric mean titer (GMT) and 95% confidence intervals.</p> Full article ">
<p>Model fit given different initial conditions for the mutant strain. (<b>Top row</b>, (<b>a</b>,<b>b</b>)) 100 cumulative cases on 26 December 2020. (<b>Bottom row</b>, (<b>c</b>,<b>d</b>)) 1000 cumulative cases on 26 December 2020. (<b>Left column</b>, (<b>a</b>,<b>c</b>)) The active and cumulative cases are shown given the model with (dashed lines) and without (solid lines) the mutant strain (dashed lines). Active mild and severe wildtype infected cases are shown in red and blue. Active and severe mutant infected populations are shown in dark red and dark blue. The cumulative known and total cases of the wildtype and mutant strains are shown in light and dark green, and light and dark purple, respectively. (<b>Right column</b>, (<b>b</b>,<b>d</b>)) The new reported cases per day given the model with (wildtype—solid pink line, mutant—dashed blue line, and total—solid black line) and without (wildtype—solid blue line) the mutant. Ontario reported case data, from September 2020 to January 2021, are also shown (dots).</p> Full article ">Figure 2
<p>The proportion of active cases of the mutant strain. (<b>Left</b>) 60 active cases (100 cumulative cases) on 26 December 2020. (<b>Right</b>) 600 active cases (1000 cumulative cases) on 26 December 2020.</p> Full article ">Figure 3
<p>Model fit given vaccination and relaxation. (<b>Top row</b>, (<b>a</b>,<b>b</b>)) vaccination without relaxation, (<b>middle row</b>, (<b>c</b>,<b>d</b>)) vaccination with slow relaxation, and (<b>bottom row</b>, (<b>e</b>,<b>f</b>)) vaccination with fast relaxation. Vaccination assumes that <math display="inline"><semantics> <mrow> <mn>10</mn> <mo>%</mo> </mrow> </semantics></math> of the population is vaccinated by 31 March 2021 and that <math display="inline"><semantics> <mrow> <mn>75</mn> <mo>%</mo> </mrow> </semantics></math> of the population is inoculated by the end of 2021. Relaxation allows for rules and behaviours to change in a way that allows for more contact between individuals. We assume that behaviours will eventually lead to pre-February 2020 contact rates between individuals. (Left column) The active and cumulative cases are shown given the model with (dashed lines) and without (solid lines) the mutant strain (dashed lines). Active mild and severe wildtype infected cases are shown in red and blue. Active and severe mutant infected populations are shown in dark red and dark blue. The cumulative known and total cases of the wildtype and mutant strains are shown in light and dark green, and light and dark purple, respectively. (Right column) The new reported cases per day given the model with (wildtype—solid pink line, mutant—dashed blue line, and total—solid black line) and without (wildtype—solid blue line) the mutant. Ontario reported case data, from September 2020 to January 2021, are also shown (dots).</p> Full article ">Figure 3 Cont.
<p>Model fit given vaccination and relaxation. (<b>Top row</b>, (<b>a</b>,<b>b</b>)) vaccination without relaxation, (<b>middle row</b>, (<b>c</b>,<b>d</b>)) vaccination with slow relaxation, and (<b>bottom row</b>, (<b>e</b>,<b>f</b>)) vaccination with fast relaxation. Vaccination assumes that <math display="inline"><semantics> <mrow> <mn>10</mn> <mo>%</mo> </mrow> </semantics></math> of the population is vaccinated by 31 March 2021 and that <math display="inline"><semantics> <mrow> <mn>75</mn> <mo>%</mo> </mrow> </semantics></math> of the population is inoculated by the end of 2021. Relaxation allows for rules and behaviours to change in a way that allows for more contact between individuals. We assume that behaviours will eventually lead to pre-February 2020 contact rates between individuals. (Left column) The active and cumulative cases are shown given the model with (dashed lines) and without (solid lines) the mutant strain (dashed lines). Active mild and severe wildtype infected cases are shown in red and blue. Active and severe mutant infected populations are shown in dark red and dark blue. The cumulative known and total cases of the wildtype and mutant strains are shown in light and dark green, and light and dark purple, respectively. (Right column) The new reported cases per day given the model with (wildtype—solid pink line, mutant—dashed blue line, and total—solid black line) and without (wildtype—solid blue line) the mutant. Ontario reported case data, from September 2020 to January 2021, are also shown (dots).</p> Full article ">Figure 4
<p>The Federal Government vaccine roll-out plan, adapted from [<a href="#B22-vaccines-09-00592" class="html-bibr">22</a>].</p> Full article ">Figure 5
<p>Figure showing the model fit with both the wildtype and mutant. Red is mild cases, blue is severe cases, green is the cumulative reported cases, and purple is the total cases. The light colours are the wildtype, and dark colours are the mutant.</p> Full article ">Figure 6
<p>Model fit assuming the period over Christmas to be anomalous, including vaccination and relaxation. Vaccination assumes that <math display="inline"><semantics> <mrow> <mn>10</mn> <mo>%</mo> </mrow> </semantics></math> of the population is vaccinated by 31 March 2021 and that <math display="inline"><semantics> <mrow> <mn>75</mn> <mo>%</mo> </mrow> </semantics></math> of the population is inoculated by the end of 2021. Relaxation allows for NPIs to be lifted on 1 May 2021. (<b>Left column</b>, (<b>a</b>)) The active and cumulative cases are shown given the model with (dashed lines) and without (solid lines) the mutant strain (dashed lines). Active mild and severe wild-type infected cases are shown in red and blue. Active and severe mutant infected populations are shown in dark red and dark blue. The cumulative known and total cases of the wild-type and mutant strains are shown in light and dark green, and light and dark purple, respectively. (<b>Right column</b>, (<b>b</b>)) The new reported cases per day given the model with (wild-type—solid pink line, mutant—dashed blue line, and total—solid black line) and without (wild-type—solid blue line) the mutant. Ontario reported case data, from September 2020 to December 2020, are also shown (dots).</p> Full article ">Figure A1
<p>Figure validating model fitting and scenario building. The model is fit to data from 12 December 2020 to 11 January 2021. We augment the data with data from 12 January 2021 until 7 May 2021. We see that the hybrid data and scenario approach properly detected peaks out to four months in advance. Between January and April 2021, Ontario went through multiple phases of lockdown and relaxation of non-pharmaceutical interventions, which the model does not capture (as they were unknowable at the time). The peak detection makes the model a valuable tool for long-term planning. Thee pink line is the continuation of the fit, the blue line is the new wildtype trajectory when the mutant scenario is introduced, and the dashed line is the mutant strain. The black line is the combination of wildtype and mutant. The black line is the total new cases per day, and this is what should be compared to the data as the new cases per day is reported as a total. The shaded region is the <math display="inline"><semantics> <mrow> <mn>95</mn> <mo>%</mo> </mrow> </semantics></math> confidence interval from the fit.</p> Full article ">Figure A2
<p><a href="#vaccines-09-00592-f006" class="html-fig">Figure 6</a>a augmented with data up to 7 May 2021. The model is still only fit to data up to 11 January 2021. We see that the line fit (cumulative known wildtype cases) is still relatively close 4 months out. As before, green represents the cumulative known cases, purple is the total incidence, red is active mild cases, and blue is active severe cases. Dark lines are mutant compartments, and light colours are wildtype. Dashed lines are the extended scenario, and solid lines the original fit without a separation of wildtype and mutant. The light green line is what is being fit by the model. We see some anomalous behaviours in the extension due to the period of lockdown–relaxation cycles in Ontario. While the log scale obfuscates some detail, the consequence of these lockdown–relaxation cycles not being present in thee model causes an over-estimation on the order of <math display="inline"><semantics> <msup> <mn>10</mn> <mn>4</mn> </msup> </semantics></math> cases.</p> Full article ">Figure A3
<p>The model projections from the first wave of COVID-19 in Ontario. The red dots are data not used in the model fitting. The green line is the cumulative known cases, purple is the total incidence, red is active mild cases, and blue is active severe cases. In the right panel (<b>b</b>), we see the new cases per day. We see that the model performs well for at least two weeks when non-pharmaceutical interventions remain relatively constant. The shaded region is the <math display="inline"><semantics> <mrow> <mn>95</mn> <mo>%</mo> </mrow> </semantics></math> confidence interval from the fit. The <math display="inline"><semantics> <mrow> <mn>95</mn> <mo>%</mo> </mrow> </semantics></math> confidence interval was able to detect the presence of a second wave in the fall.</p> Full article ">
<p>Vaccine development pipeline: the design stages of the multi-epitope vaccine proposal are shown. Each stage is important for meeting the objective of identifying peptides capable of generating an immune response, taking into account the most frequent alleles in Latin America. The important servers and cutoff values used in the process are specified.</p> Full article ">Figure 2
<p>Antigenic presentation from the proposed vaccine: The assembly of peptides with vaccine potential are recognised by cell membrane receptors capable of recognising patterns associated with pathogens, such as TLR2 and 4 from dendritic cells. After recognition, the construct is phagocytized by the cell together with TLR, allowing its interaction with MyD88 and the maturation of the phagosome. From the phagosome, the peptide can take two routes: the first route is towards the proteasome, where the peptide is degraded, internalised in the ER and assembled with HLA-I molecules; the second route involves the internalization of the peptide in the late endosome, where it is assembled with HLA-II molecules and subsequently presented on the cell membrane of the LT [<a href="#B103-vaccines-09-00581" class="html-bibr">103</a>,<a href="#B104-vaccines-09-00581" class="html-bibr">104</a>,<a href="#B105-vaccines-09-00581" class="html-bibr">105</a>].</p> Full article ">Figure 3
<p>Estimation of flexible molecular protein-peptide coupling: In the complexes (upper panels) are two non-redundant HLA-I molecules most frequently found in the Latin American population coupled with a peptide with vaccine potential from SP, namely FAMQMAYRF. (<b>a</b>), Cluster 1, density of 239, <math display="inline"><semantics> <mo>Δ</mo> </semantics></math>G of −5.2. (<b>b</b>), Cluster 1, density of 355, <math display="inline"><semantics> <mo>Δ</mo> </semantics></math>G of −4.9. In the complexes (lower panels) are two non-redundant HLA-II molecules most frequently found in the Latin American population coupled with a peptide with vaccine potential from MG, namely SFRLFARTRSMWSFN. (<b>c</b>), Cluster 1, density of 138, <math display="inline"><semantics> <mo>Δ</mo> </semantics></math>G of −4.6. (<b>d</b>), Cluster 2, density of 168, <math display="inline"><semantics> <mo>Δ</mo> </semantics></math>G of −4.4.</p> Full article ">Figure 4
<p>Construction of the Proposed Multi-Epitope Vaccine. Structure of the multi-epitope construct: three-dimensional diagrammatic structure of the multi-epitope construct showing (<b>a</b>), the separators, origin of the peptides and adjuvants used; (<b>b</b>), the location of the adjuvants PADRE, TpD and M cell ligand; and (<b>c</b>), the location of the epitope’s cytotoxic T lymphocytes (CTLs), T helper lymphocytes (HTLs) and B lymphocytes (BLs). (<b>d</b>), Ribbon diagram of the multiepitope construct.</p> Full article ">Figure 5
<p>Analysis of trajectory. (<b>a</b>), Root mean square deviation (RMSD) C<math display="inline"><semantics> <mi>α</mi> </semantics></math> atoms. (<b>b</b>), Root mean square fluctuation for C<math display="inline"><semantics> <mi>α</mi> </semantics></math> atoms (RMSF), TLR-4 receptor initialize at amino acid 1 and goes to amino acid number 1482, and the vaccine from amino acid number 1483 to 1992. (<b>c</b>), Rg plot; vaccine construct is stable in its compact form during the simulation time. (<b>d</b>), Changes in the number of hydrogen bonds between the TLR-4 receptor and multi-epitope vaccine molecule during MD simulation.</p> Full article ">Figure 6
<p>Immune simulation using the multi-epitope construct. (<b>a</b>), BLs, (<b>b</b>), CD4+ TLs and (<b>d</b>), CD8+ TLs were simulated, presenting a cumulative effect towards the third injection on the 56th day of simulation. This suggests the early presence of TLs memory and a change towards the immunoglobulin isotype, immunoglobulin G (IgG), being more predominant. While the antigenic stimulus lasts, there is a polarization towards a certain type of response (<b>c</b>), HTL-1, which is consistent with (<b>e</b>), the active antigenic presentation of professional antigen-presenting cells. This could be partly stimulated by other non-presenters, as well as the production of interleukins, such as (<b>f</b>), IFN <math display="inline"><semantics> <mi>γ</mi> </semantics></math>, TGF-<math display="inline"><semantics> <mi>β</mi> </semantics></math> and IL-2. An infection challenge, composed of a virus responding to the sequence of SARS-CoV-2 proteins covered by the multi-epitope construct, was simulated on day 366. (<b>g</b>), An indifference in immunoglobulin M (IgM) production and increased IgG response suggests favourable conditions for viral antibody clearance in the BLs. (<b>h</b>), The duplication and antigenic presentation of BLs correspond to the stimulated response by the simulated virus, which lasts beyond the viral challenge. (<b>i</b>), An IgG isotype shows a substantial response to the viral challenge, with subtype IgG1 most notably responding. (<b>j</b>), The CD4+ TLs population is globally stimulated; the memory response results in consolidation, which increases cell numbers and is still available over 100 days after the viral challenge. (<b>k</b>), The population of memory CD8+ cells is stimulated by the viral challenge, acting directly on viral clearance.</p> Full article ">
<p>Open hospital capacity, predicted mean ± standard deviation per day, for top down (blue) and exposure focused (green) vaccine rollout, base case scenario of <a href="#vaccines-09-00546-t004" class="html-table">Table 4</a>.</p> Full article ">Figure 2
<p>Statistical model convergence, expected relative open capacity averaged for <span class="html-italic">n</span> runs with corresponding standard deviation per model run <span class="html-italic">n</span>, for top down (blue) and exposure focused (green) vaccine rollout, base case scenario of <a href="#vaccines-09-00546-t004" class="html-table">Table 4</a>.</p> Full article ">Figure 3
<p>Predicted open hospital capacity over product of infectiousness <span class="html-italic">R<sub>S</sub></span> and prevalence in A&E-patients <span class="html-italic">p<sub>pos</sub></span> for top down (blue), and exposure focused rollout (green), together with their respective ratio (orange).</p> Full article ">Figure 4
<p>Relative open capacity split on to unit level for base case (<span class="html-italic">R<sub>S</sub></span> = 7, <span class="html-italic">p<sub>pos</sub></span> = 0.25, <a href="#vaccines-09-00546-t004" class="html-table">Table 4</a>), and parameter variation (<span class="html-italic">R<sub>S</sub></span> = 10, <span class="html-italic">p<sub>pos</sub></span> = 0.75).</p> Full article ">Figure 5
<p>Predicted open hospital capacity over recovery time <span class="html-italic">t<sub>rec</sub></span> [d] for top down (blue), and exposure focused rollout (green), together with their respective ratio (orange).</p> Full article ">Figure 6
<p>Predicted number of infected staff by hierarchy group (<a href="#vaccines-09-00546-t001" class="html-table">Table 1</a>) over time for base case scenario (<a href="#vaccines-09-00546-t004" class="html-table">Table 4</a>).</p> Full article ">Figure 7
<p>Predicted open hospital capacity over daily rate of vaccines available <span class="html-italic">v<sub>S</sub></span> [1/d] for top down (blue), and exposure focused rollout (green), together with their respective ratio (orange).</p> Full article ">Figure 8
<p>Predicted open hospital capacity depending on initial staff reserve (<a href="#vaccines-09-00546-t001" class="html-table">Table 1</a>) for top down (blue), and exposure focused rollout (green), together with their respective ratio (orange).</p> Full article ">Figure 9
<p>Predicted open hospital capacity over age factor <span class="html-italic">T<sub>S</sub></span> [-] for top down (blue), and exposure focused rollout (green), together with their respective ratio (orange).</p> Full article ">
<p>Vaccination Strategy. (<b>A</b>). Vaccination scheme. Three groups of 12 mice were immunized at Day 0 by an intradermal injection of DNA plasmid coding for SARS-CoV-2 spike protein. For two groups, the immunization was adjuvanted either with recombinant muGM-CSF or with muGM-CSF secreted by encapsulated cells. On the day of immunization, a submandibular blood puncture was performed for baseline serum isolation. On Days 10 and 28, 5 mice per group were sacrificed to assess T Cell and B Cell responses. At Day 28, the 2 remaining mice per group received a boost DNA spike plasmid injection and were kept until Day 56 for B Cell responses assessment. (<b>B</b>). Dermal SARS-CoV-2 Spike protein expression by western blot analysis. Skin punch biopsies were taken at the site of intradermal injection from all animals, digested, and analyzed by western blot for the presence of the SARS-CoV-2 spike protein. Three randomly selected mice per time points are represented. (<b>C</b>). muGM-CSF Adjuvant quantification by ELISA. The muGM-CSF secreted by encapsulated cells was quantified by ELISA before and after implantation in mice. **** <span class="html-italic">p</span> < 0.0001.</p> Full article ">Figure 2
<p>TNF-α and IFN-γ production by CD8+ T cells 10 days after vaccination. Mice were immunized with a single dose of spike DNA plasmid with or without GM-CSF (recombinant or secreted by encapsulated cells) as an adjuvant. T cells response was measured at Day 10 by intracellular cytokine staining (ICS) after stimulation of splenocytes with spike protein peptide pools or DMSO as a negative control. Data show the percentage of TNF-α or IFN-γ-secreting CD8+ T cells after stimulation. Data are represented as min-to-max boxes with individual values. ** <span class="html-italic">p</span> < 0.01, *** <span class="html-italic">p</span> < 0.001, and **** <span class="html-italic">p</span> < 0.0001.</p> Full article ">Figure 3
<p>Polyfunctionality of Spike-specific CD8+ T cells at day 10 post-vaccination. (<b>A</b>). Histogram representing the percentage of functional CD8+ T cells with 1, 2, 3, 4 or 5 functions after pool 1 and pool 2 stimulation. (<b>B</b>). Pie charts representing the proportion of responding CD8+ T cells expressing different combinations of cytokines and degranulation markers after stimulation with spike peptide pool 1 or pool 2, PMA/ionomycin (positive control) or DMSO (negative control) stimulation. Histograms and Pie charts represents the mean of 5 animals per group.</p> Full article ">Figure 4
<p>Cytokines profile of spike-specific CD4+ T cells 10 and 28 days after vaccination. Mice were immunized with a single dose of spike DNA plasmid with or without GM-CSF (recombinant or secreted by encapsulated cells) as an adjuvant. T cells responses were measured at day 10 and 28 by intracellular cytokines staining (ICS) after stimulation of splenocyte with spike protein peptide pools or DMSO as a negative control. Data show the percentage of cytokines secreting CD4+ T cells after stimulation. Data show the percentage of responding CD4+ T cells after stimulation. Data are represented as min-to-max boxes with individual values. * <span class="html-italic">p</span> < 0.05, ** <span class="html-italic">p</span> < 0.01, *** <span class="html-italic">p</span> < 0.001, and **** <span class="html-italic">p</span> < 0.0001.</p> Full article ">Figure 5
<p>Antibodies against SARS-CoV-2 Spike Protein Detected by ELISA.Mice were immunized with a single dose of spike DNA plasmid with or without GM-CSF (recombinant or secreted by encapsulated cells) as an adjuvant. B cell response was measured at day 10 and 28 by quantification of the serum’s antibodies. (<b>A</b>). IgG, IgM, IgA against SARS CoV2 Spike Protein. Day 10, <span class="html-italic">p</span> value * = 0.0324; Day 28, <span class="html-italic">p</span> value * = 0.0277; Day 56, <span class="html-italic">p</span> value **** < 0.0001. (<b>B</b>). IgG against SARS CoV2 Spike Protein. Day 10, <span class="html-italic">p</span> value * = 0.0162; Day 28, <span class="html-italic">p</span> value ** = 0.0089; Day 56, <span class="html-italic">p</span> value **** < 0.0001. Fold change is calculated between the baseline and the day of sacrifice values. Data analysis are represented with geometric means with geometric SD.</p> Full article ">
<p>Diagram and immunogenicity of SARS-CoV-2 DNA vaccines. Schematic diagram of COVID-19 DNA vaccine expressing soluble SARS-CoV-2 S protein (S<sub>ΔTM</sub>) or full-length SARS-CoV-2 S protein (S) (<b>a</b>). BALB/c mice (<span class="html-italic">n</span> = 4–10/group) were immunized at weeks 0 and 2 with pGX27-S<sub>ΔTM</sub>, pGX27-S, or pGX27 (empty control vector) as described in the Methods. Sera were collected at 2 weeks post-prime (blue) and 2 weeks post-boost (red) and evaluated for SARS-CoV-2 S-specific IgG antibodies (<b>b</b>). All data are represented as individual values. ** <span class="html-italic">p</span> < 0.01 as determined by the Mann–Whitney test.</p> Full article ">Figure 2
<p>GX-19 elicits robust binding and neutralizing antibody responses in mice. BALB/c mice (<span class="html-italic">n</span> = 4–7/group) were immunized at weeks 0 and 2 with indicated doses of GX-19 or pGX27 as described in the Methods (<b>a</b>–<b>c</b>). Sera were collected at 2 weeks post-prime (blue) and 2 weeks post-boost (red) and assessed for SARS-CoV-2 S-specific IgG antibodies by ELISA (<b>a</b>), and for post-boost sera, neutralizing antibodies against SARS-CoV-2 live virus (<b>c</b>). Bronchoalveolar lavages (BALs) were collected at 2 weeks post-boost and assayed for SARS-CoV-2 S-specific IgG antibodies by ELISA (<b>b</b>). Data representative of two independent experiments. All data are represented as individual values. * <span class="html-italic">p</span> < 0.05, ** <span class="html-italic">p <</span> 0.01 as determined by the Mann–Whitney test.</p> Full article ">Figure 2 Cont.
<p>GX-19 elicits robust binding and neutralizing antibody responses in mice. BALB/c mice (<span class="html-italic">n</span> = 4–7/group) were immunized at weeks 0 and 2 with indicated doses of GX-19 or pGX27 as described in the Methods (<b>a</b>–<b>c</b>). Sera were collected at 2 weeks post-prime (blue) and 2 weeks post-boost (red) and assessed for SARS-CoV-2 S-specific IgG antibodies by ELISA (<b>a</b>), and for post-boost sera, neutralizing antibodies against SARS-CoV-2 live virus (<b>c</b>). Bronchoalveolar lavages (BALs) were collected at 2 weeks post-boost and assayed for SARS-CoV-2 S-specific IgG antibodies by ELISA (<b>b</b>). Data representative of two independent experiments. All data are represented as individual values. * <span class="html-italic">p</span> < 0.05, ** <span class="html-italic">p <</span> 0.01 as determined by the Mann–Whitney test.</p> Full article ">Figure 3
<p>Immunization with GX-19 elicits Th1-biased T cell responses in mice. BALB/c mice (<span class="html-italic">n</span> = 3–7/group) were immunized at weeks 0 and 2 with indicated doses of GX-19 or pGX27 (empty control vector) as described in the Methods (<b>a</b>–<b>c</b>). Sera were collected at 2 weeks post-boost and assessed for SARS-CoV-2 S-specific IgG1 and IgG2a/b. Endpoint titers (<b>a</b>), and endpoint tier ratios of IgG2a/b to IgG1 (<b>b</b>) were calculated. At 2 weeks post-boost, mouse splenocytes were isolated and re-stimulated with peptide pools spanning the SARS-CoV-2 S protein ex vivo. Indicated cytokines in the supernatants of culture were quantified using a Th1/Th2 cytometric bead array kit. Mean value of the medium alone background (mean ± s.d., pg ml<sup>−1</sup>) was 19.17 ± 8.61 for IFN-<span class="html-italic">γ</span>, 57.12 ± 6.53 for TNF-α, 33.10 ± 6.72 for IL-2, 7.83 ± 0.45 for IL-4, and 4.66 ± 0.13 for IL-5 (<b>d</b>). T cell responses were measured by IFN-<span class="html-italic">γ</span> ELISPOT in splenocytes stimulated with peptide pools spanning the SARS-CoV-2 S protein. Shown are spot-forming cells (SFC) per 10<sup>6</sup> splenocytes (<b>c</b>). Cells were stained for intracellular production of IFN-<span class="html-italic">γ</span>, TNF-α, and IL-2. Shown are the frequency of S-specific CD4<sup>+</sup> or CD8<sup>+</sup> T cells after subtraction of background (DMSO vehicle, Sigma-Aldrich, St. Louis, MO, USA) (<b>e</b>). Data representative of two independent experiments. All data are represented as individual values. * <span class="html-italic">p</span> < 0.05, ** <span class="html-italic">p</span> < 0.01 as determined by the Mann–Whitney test.</p> Full article ">Figure 4
<p>Antibody and T cell responses after GX-19 vaccination in macaques. Macaques (<span class="html-italic">n</span> = 3) were immunized with 3 mg of GX-19 as described in the Methods. Serum and PBMCs (peripheral blood mononuclear cells) were collected before (week 0), during (week 4 and 5.5), and after (week 8) vaccination and were assessed for SARS-CoV-2 S-specific IgG antibodies by ELISA (<b>a</b>) and neutralizing antibodies against SARS-CoV-2 live virus (<b>b</b>). Data represent mean SEM of individual macaques (GX-19 #1, GX-19 #2, GX-19 #3), and dashed line indicates the assay limits of detection. The number of SARS-CoV-2 S-specific IFN-<span class="html-italic">γ</span>-secreting cells in PBMCs was determined by IFN-<span class="html-italic">γ</span> ELISPOT assay after stimulation with peptide pools spanning the SARS-CoV-2 S protein. Shown are spot-forming cells (SFC) per 10<sup>6</sup> PBMCS in triplicate wells (<b>c</b>). The frequency of S-specific CD4<sup>+</sup> or CD8<sup>+</sup> T cells producing IFN-<span class="html-italic">γ</span>, TNF-α, or IL-2 was determined by intracellular cytokine staining assays stimulated with SARS-CoV-2 S peptide pools. Shown are the frequency of S-specific CD4<sup>+</sup> or CD8<sup>+</sup> T cells after subtraction of background (DMSO vehicle) (<b>d</b>). Data of (<b>a</b>,<b>b</b>,<b>d</b>) are represented as individual values. <span class="html-italic">p</span>-Values determined by the Wilcoxon matched-pairs signed rank test; <span class="html-italic">p</span>-values are shown.</p> Full article ">Figure 5
<p>Protective efficacy of GX-19 against SARS-CoV-2 challenge. Non-vaccinated (<span class="html-italic">n</span> = 3, blue) and GX-19-vaccinated macaques (<span class="html-italic">n</span> = 3, red) were challenged by intratracheal, oral, conjunctival, intranasal, and intravenous administration of 2.7 × 10<sup>7</sup> TCID<sub>50</sub> SARS-CoV-2. Viral load was assessed in nasal swab (<b>a</b>) and throat swab (<b>b</b>) at multiple time points following challenge. Summary of peak viral loads and viral load area under the curve (AUC) in nasal swab (<b>c</b>,<b>e</b>) and throat swab (<b>d</b>,<b>f</b>) following challenge. Dashed line indicates the assay limit of detection. Histopathological changes in the lungs of SARS-CoV-2-challenged macaques (<b>g</b>). Interstitial pneumonia score by microscopic evaluation (<span class="html-italic">n</span> = 6 lung lobes of each animal per group) (<b>h</b>). The lung tissue sections were stained with hematoxylin and eosin (H&E). Data of (<b>a</b>–<b>f</b>) are represented as individual values. Data of (h) is represented as 6 lung lobes of each animal per group. <span class="html-italic">p</span>-Values determined by the Mann–Whitney test; <span class="html-italic">p</span>-values are shown * <span class="html-italic">p</span> < 0.05 as determined by the Mann–Whitney test.</p> Full article ">
<p>Daily volume of collected Italian tweets, from 7 October 2020 to 26 January 2020. Tweets were collected through several keywords: “vaccino”, “vaccini”, “vaccinazione”, “vaccinazioni”. A vertical line is drawn on the days where we observed a relative increase of tweets volume higher than 50%.</p> Full article ">


