As an update to our previous Gensler City Pulse surveys, we surveyed residents across 30 cities around the world to learn more about their mobility experiences, opinions, and preferences.
Between increasing return to the office rates in many cities and a resurgence of in-person shopping and dining, urban residents are interacting with cities at rates that have not been seen since the start of the pandemic. The future of urban life — from how metropolitan areas are planned and built, to how sustainable our cities can become — will be affected by how people choose to travel in and around their cities and how cities evolve to support new mobility behaviors. Featuring diverse voices from 14 countries, this study demonstrates how cities can adapt to a new era of urban mobility by championing proximity, safety, and sustainability.

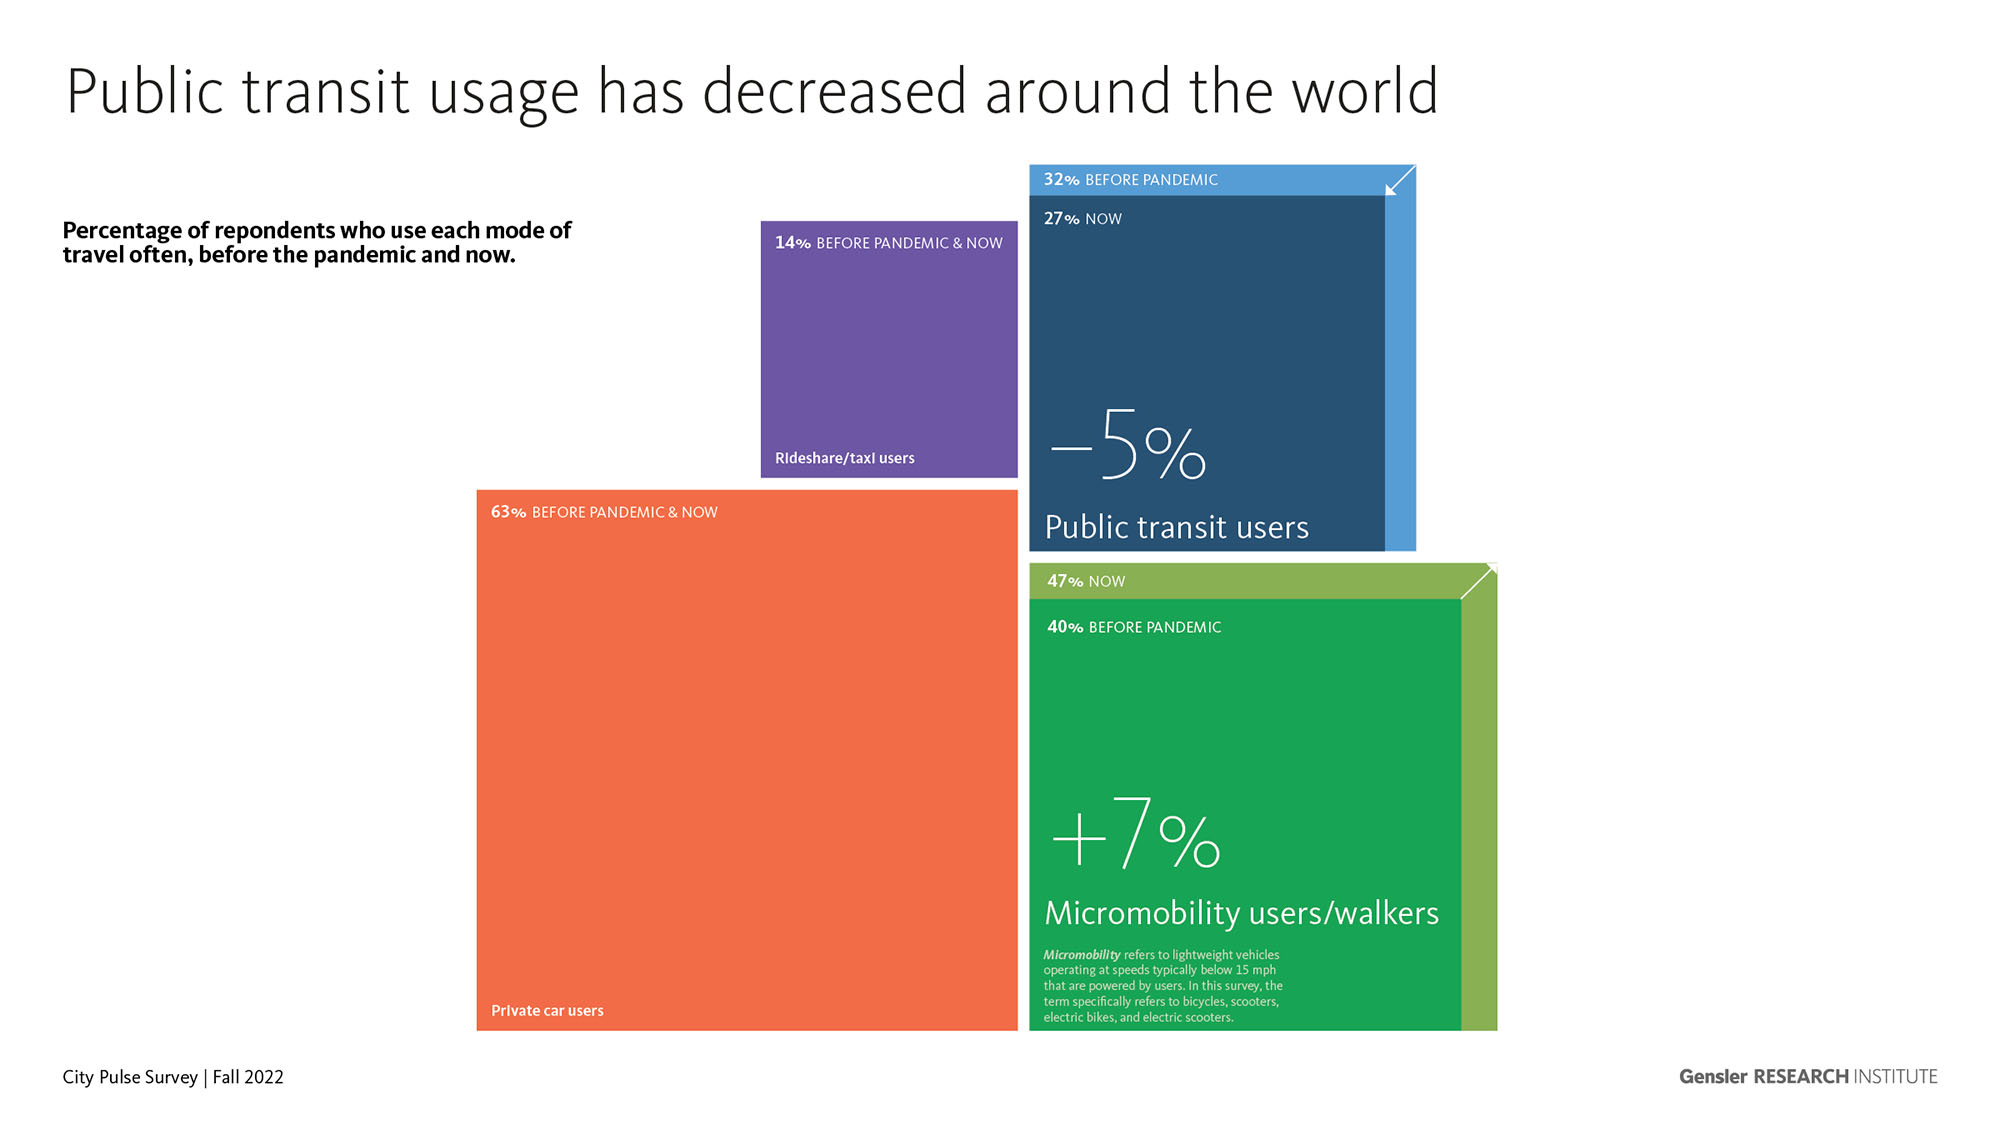
Micromobility is on the rise around the world — but public transit usage has declined.
Our data provides key insights into how mobility patterns changed during the public health crisis. While respondents currently report using cars and rideshares/taxis as much as they did before the pandemic, we found pronounced shifts in other forms of transportation. People are using public transit less than they did before the global shutdowns, and now spend more time walking or using some form of micromobility.

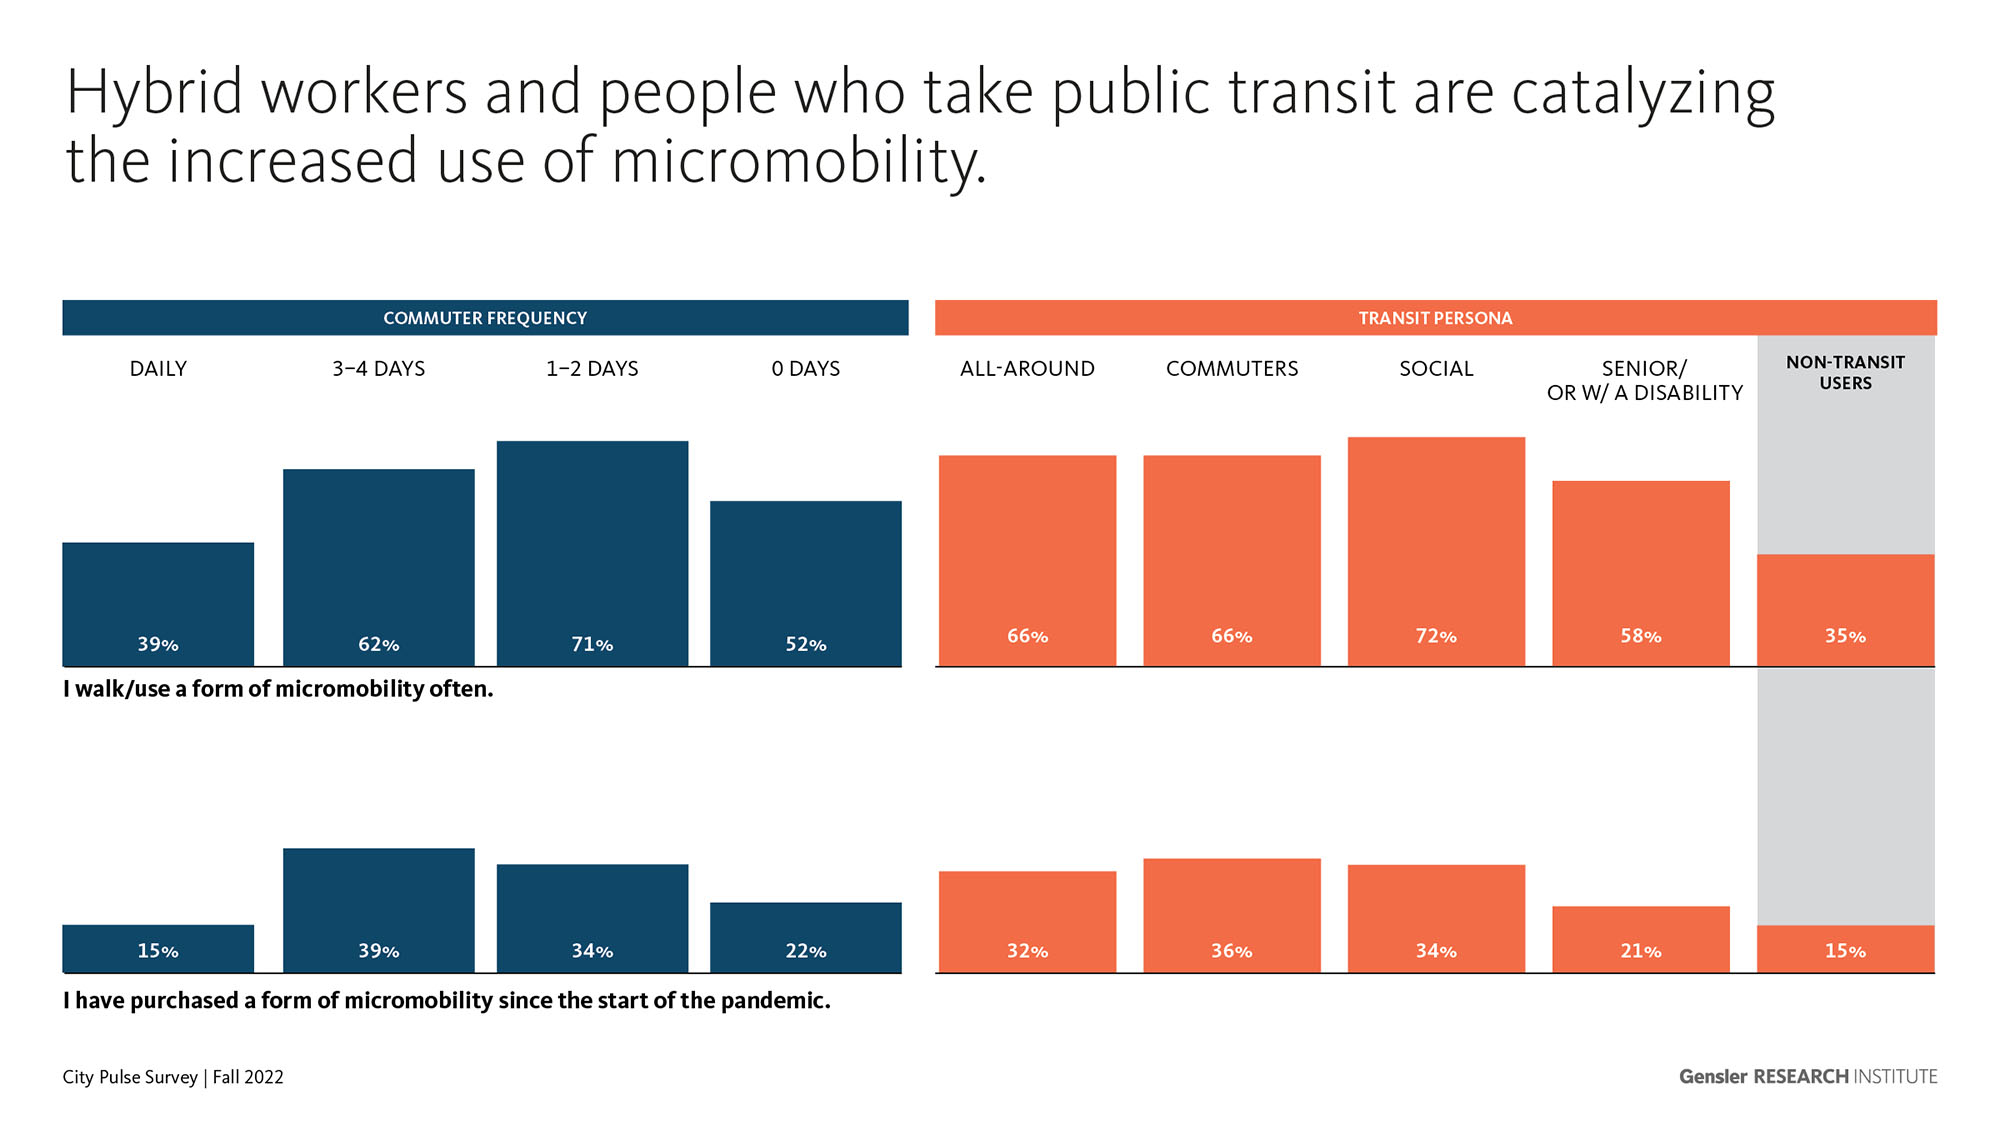
Micromobility, public transit ridership, and the rise of hybrid work are interconnected.
As public transit systems shut down in urban centers, micromobility options provided safer forms of transportation for people who needed to get around their cities during the pandemic. People began to use micromobility options more frequently, and they also began to take longer journeys on electric and non-electric bikes and scooters. One U.S.-based e-scooter company reported that the length of the average trip on their product increased by 26% during the pandemic, and many cities have taken notice. Paris, for example, plans to convert over 50 kilometers of car lanes to bike paths, and Seattle has closed 30 kilometers to vehicular traffic to allow for more pedestrian/bicycle use.
The increased usage of micromobility also led to higher rates of ownership. During the pandemic, e-bike sales grew by 190%, bicycle sales increased by 120%, and e-scooter sales jumped by 61.2%. Our data shows that people who commute to work between one to four days and those who use public transit, are more likely than their counterparts to use and purchase forms of micromobility. This suggests that increased flexibility coupled with decreased satisfaction with public transit may be driving urban residents to explore alternative transportation options.

Safety challenges in our cities are a barrier to public transit ridership.
With rates of crime on public transit increasing in many of the largest urban centers in the world, people in cities are now foregoing public buses and trains for reasons of personal security, not due to concerns about COVID-19. And it isn’t just safety within the public transit itself that’s a concern — in the United States alone, more than 88% of people feel that violent crime is increasing in their communities.
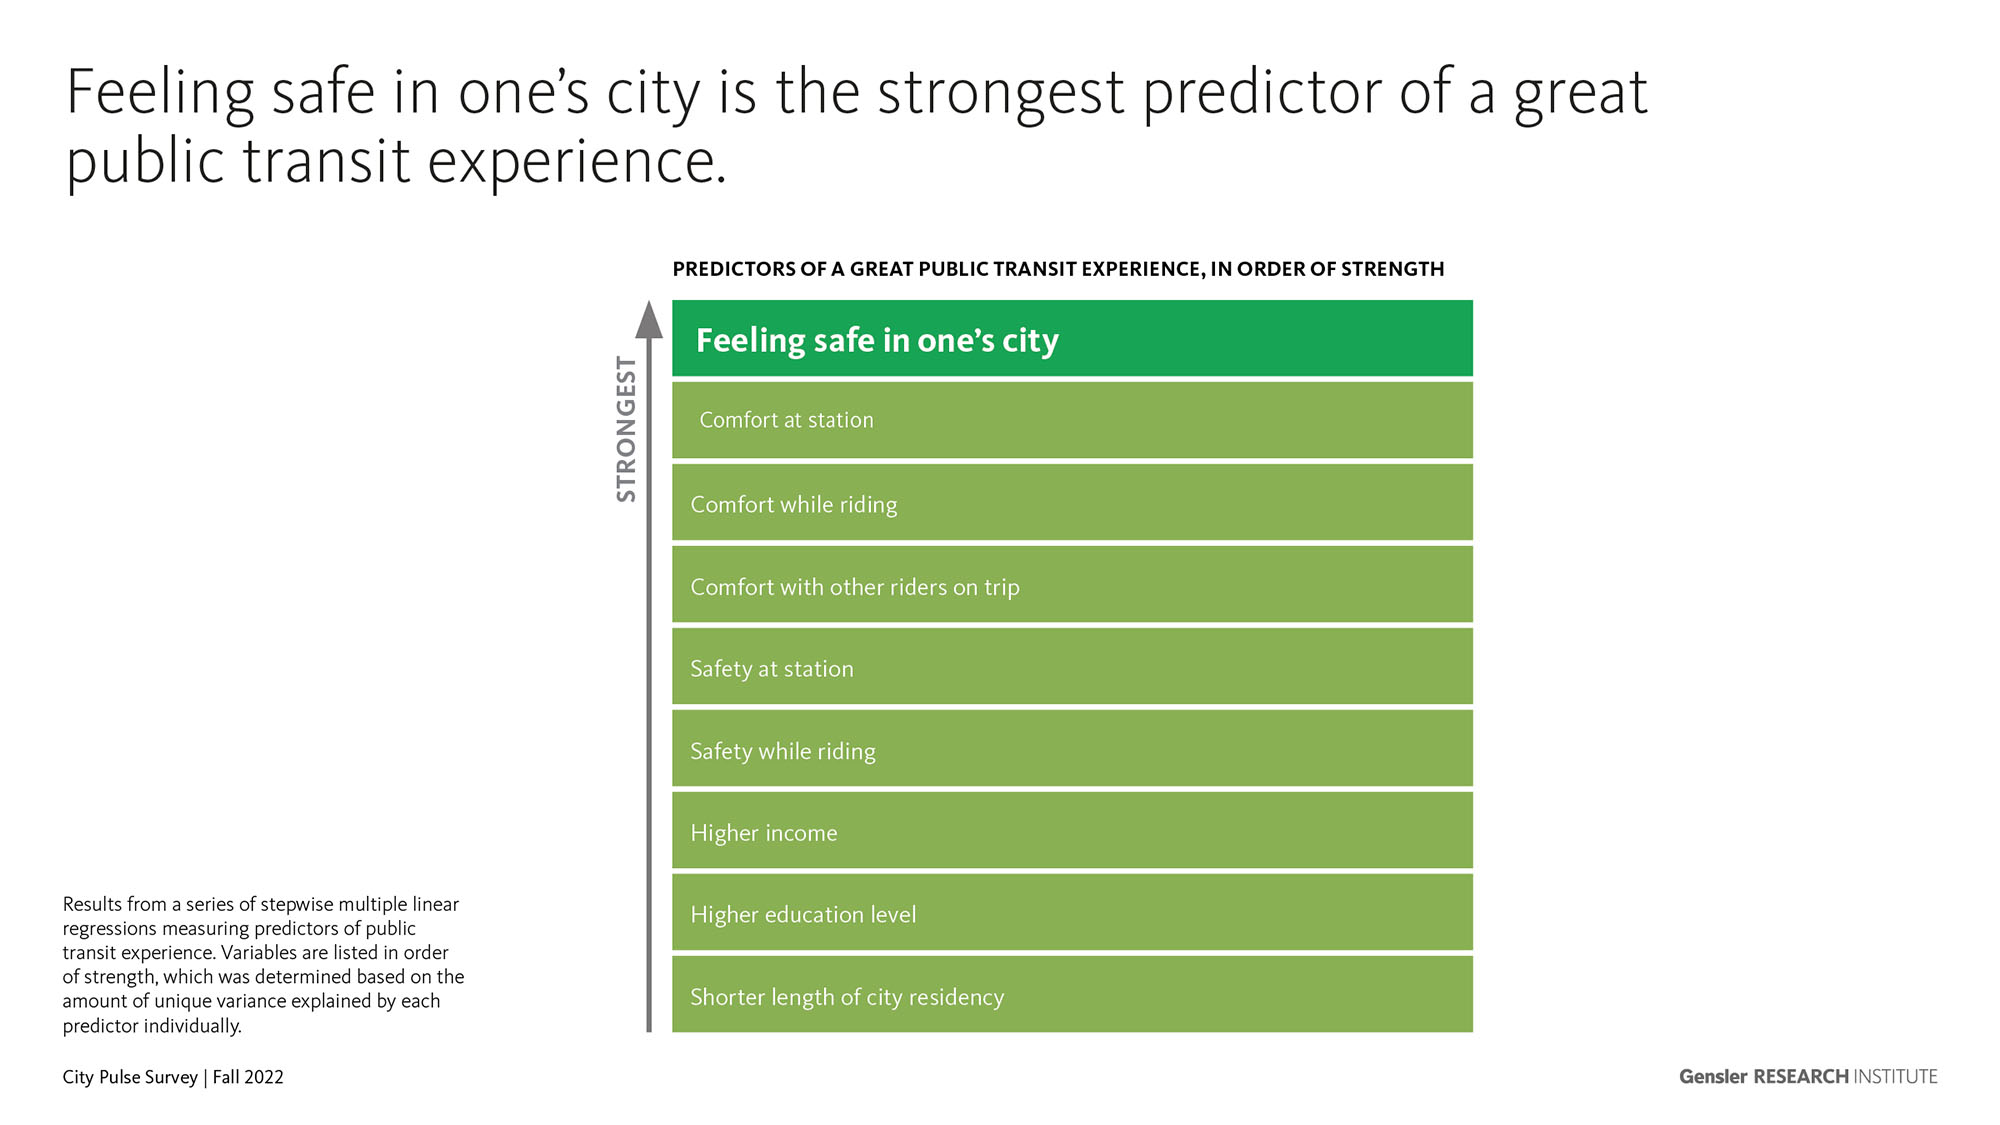
Safety in cities has always been a concern, but our data shows that it’s now a vital part in people’s public transit experiences. We found that a feeling of safety in one’s city is the strongest driver of a great public transit experience. People who feel safe in their city are three times more likely to feel that they’re having a great experience. They also feel significantly safer while riding and experience less hesitation about taking public transit at night.
City Pulse 2022 Methodology
Data for Gensler’s City Pulse Urban Mobility Study was gathered via an anonymous, panel-based survey of 15,136 total urban residents in 30 cities across the world. The survey was conducted online from July 18 to August 15, 2022. Survey respondents were recruited by Qualtrics (a third-party research firm). Respondents were required to live within the city administrative boundaries, with the exception of Los Angeles – where residents were required to live within the county administrative boundaries. Respondents were demographically diverse across gender, age (18+), race/ethnicity (in U.S. cities only), income, employment, and education levels.
Download the full Gensler City Pulse 2022 Urban Mobility Report to learn how today’s “new normal” can influence and inform tomorrow’s urban design decisions.
For press and media inquiries, please contact . To reach our Mobility practice area, contact and . To learn more about Gensler’s Cities research, please reach out to .